Bitcoin:False Breakout at $76,500? Bulls Eye $79,300 and $80,880Bitcoin:False Breakout at $76,500? Bulls Eye $79,300 and $80,880
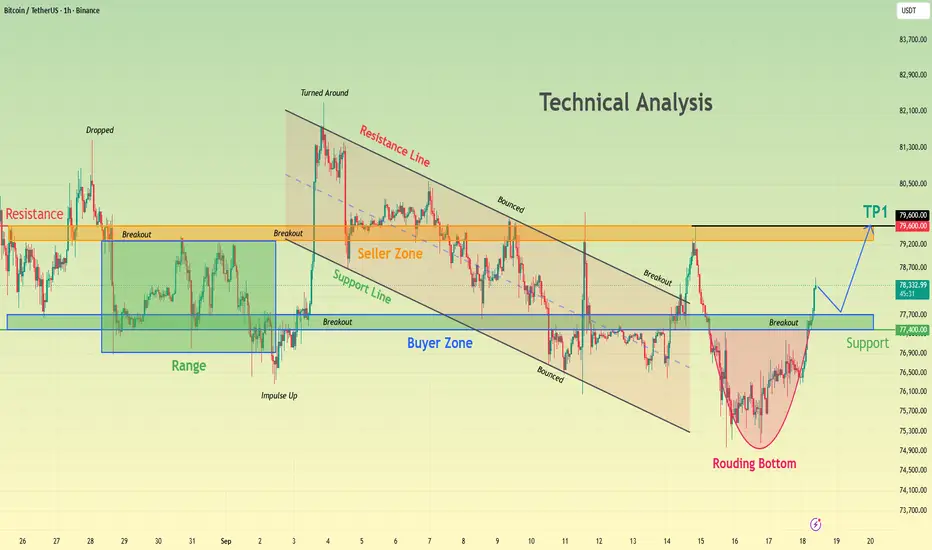
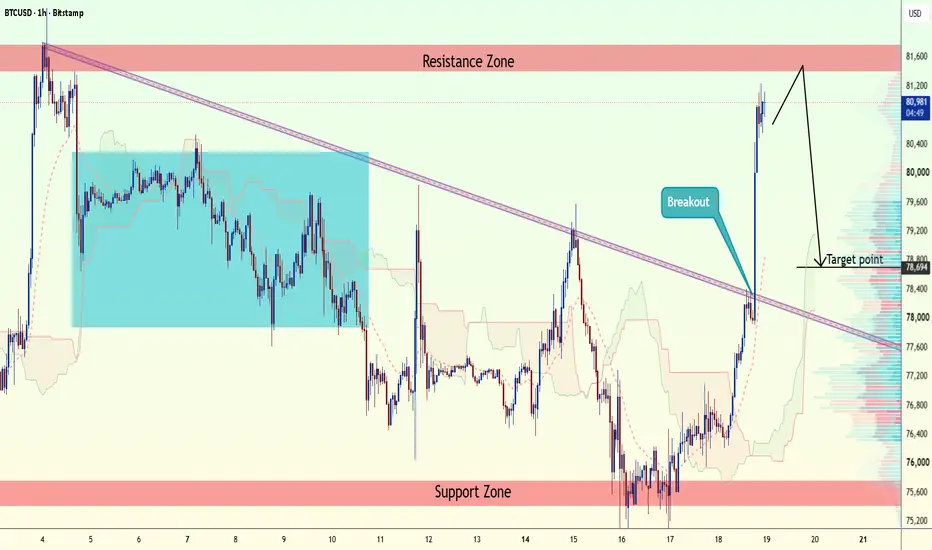
Bitcoin tested a major support zone near $76,500 that has repeatedly acted as an important reaction area on the 4H chart.
Price recently broke below this level, but the move has so far failed to produce strong continuation. Instead, BTC has started consolidating back around the zone, raising the possibility that the breakdown could develop into a false breakout.
If Bitcoin can hold above $76,500, the next important resistance areas are:
$79,300
$80,880
A decisive rejection from $76,500 or another sustained move below the support zone would weaken the bullish scenario and could expose BTC to further downside.
Given that the Clarity Act failed to pass the procedural vote and BTC did not fall more than 75000, then this is increasing the chances of BTC rising further.
You can find more details on the chart.
Thank you! 🍀
⚠️PS: Do your own analysis and use your own strategy to join the trade.
❤️ If this analysis helps your trading day, please support it with a like or comment ❤️  Long
Long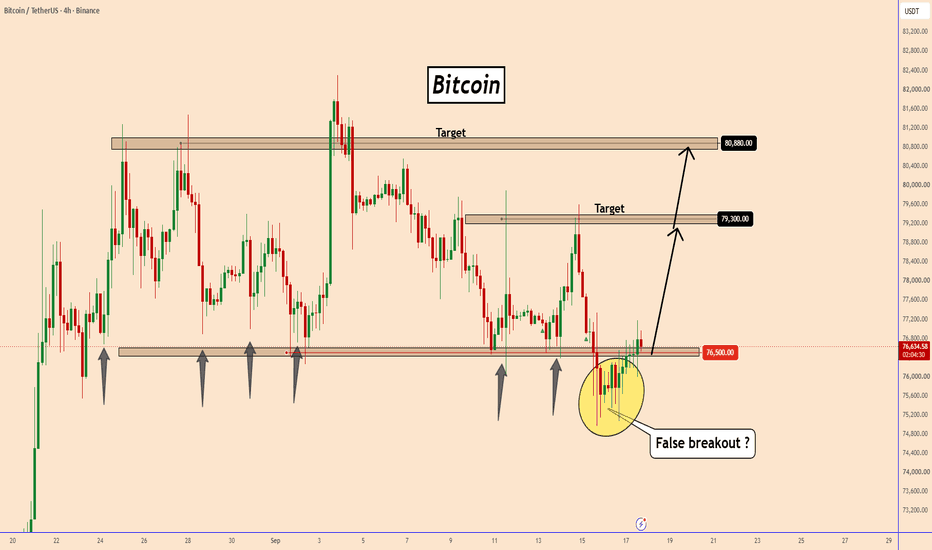
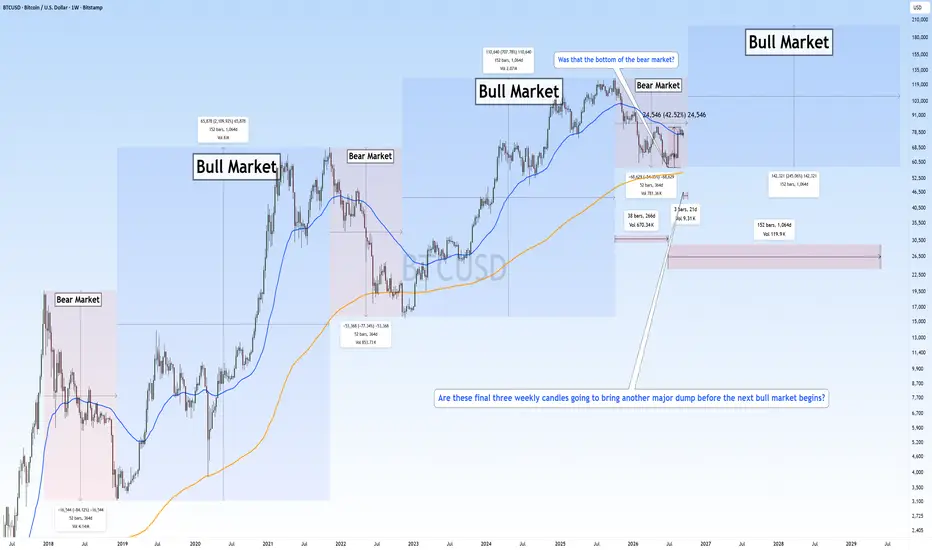
Was $57,735 the Bottom of This Bear Market?The biggest question on my mind right now is simple:
Was $57,735 actually the bottom of this bear market?
If that was the cycle low, Bitcoin has completed roughly 266 days of this bear-market phase from the 2025 top.
And this is where the current cycle becomes very interesting when we compare it with previous Bitcoin bear markets.
Historical Bear Markets
Looking at the previous major cycles, Bitcoin's bear markets have generally lasted around a full year.
In 2018, the bear market started after the December 2017 top and continued until the December 2018 bottom roughly 52 weekly candles / one year.
Then, after the November 2021 ATH, Bitcoin entered another major bear market that eventually bottomed in November 2022, again taking roughly one year.
So historically, a full-year duration has been a common characteristic of major BTC bear markets.
But this cycle is behaving differently.
The Current Cycle
From the 2025 ATH to the low around $57,735, Bitcoin experienced a significant correction.
According to the structure shown on the chart, that decline lasted around 266 days.
If $57,735 was the final low, then this bear market would have ended considerably earlier than the previous major cycles.
And since that low, Bitcoin has already recovered approximately 42%.
That's a very significant recovery.
The question now is whether this recovery represents the beginning of the next bull-market phase or simply a strong relief rally inside a larger bear market.
The 3-Week Question
This is the part I find most interesting.
Based on the historical duration shown on the chart, Bitcoin would still need approximately three more weekly candles to reach the one-year timeframe seen in previous major bear markets.
That creates two very different possibilities.
Scenario 1 The June Low Was the Bottom
If $57,735 was the cycle bottom, then this bear market has been much shorter than previous major cycles.
The ~42% recovery from the low could mean Bitcoin has already transitioned into the next bullish phase.
In that case, the historical one-year duration would simply not apply this time.
Scenario 2 One More Major Correction
The other possibility is that Bitcoin hasn't completed the bear market yet.
If the historical timing pattern continues to matter, these next three weekly candles could become extremely important.
We could potentially see another significant correction before the market finally establishes the next major cycle bottom.
What I'm Watching
The most important thing for me is confirmation rather than prediction.
Bitcoin has already recovered strongly from the June low, so I don't think it's wise to automatically assume that another major dump must happen simply because previous cycles lasted around a year.
At the same time, I also don't think we should declare a new bull market confirmed solely because BTC has bounced around 42%.
The next few weekly closes should tell us much more.
If BTC continues holding the recovery structure and starts establishing higher highs and higher lows, that would support the idea that the June low was the bottom.
But if we see a major rejection and a breakdown of the current structure, then the possibility of another deeper correction becomes much more relevant.
Final Thoughts
This is one of those situations where historical data gives us a framework, not a guarantee.
Previous cycles suggest that major bear markets can last around a year.
This cycle has already given us a roughly 42% recovery from the $57,735 low, while the historical timeframe suggests we still have around three weekly candles to reach that one-year mark.
So the real question is:
Did Bitcoin already finish its bear market early, or are these final three weeks going to surprise us with another major move lower?
BTC has surprised us many times before.
For now, I'm going to wait for the next few weekly closes before making any strong conclusion about the cycle bottom.
What do you think was $57,735 the actual bottom of this bear market, or are we going to see one more major correction before the next bull market begins? Long 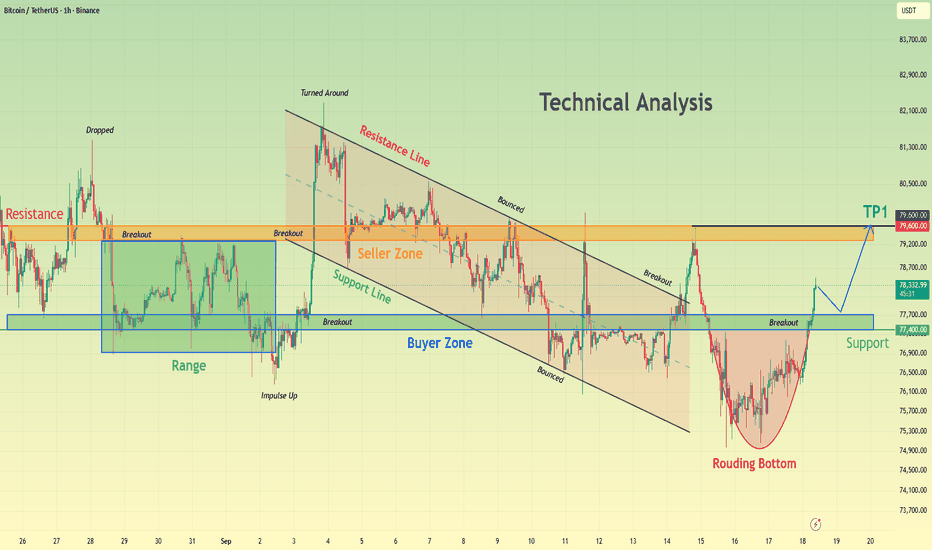
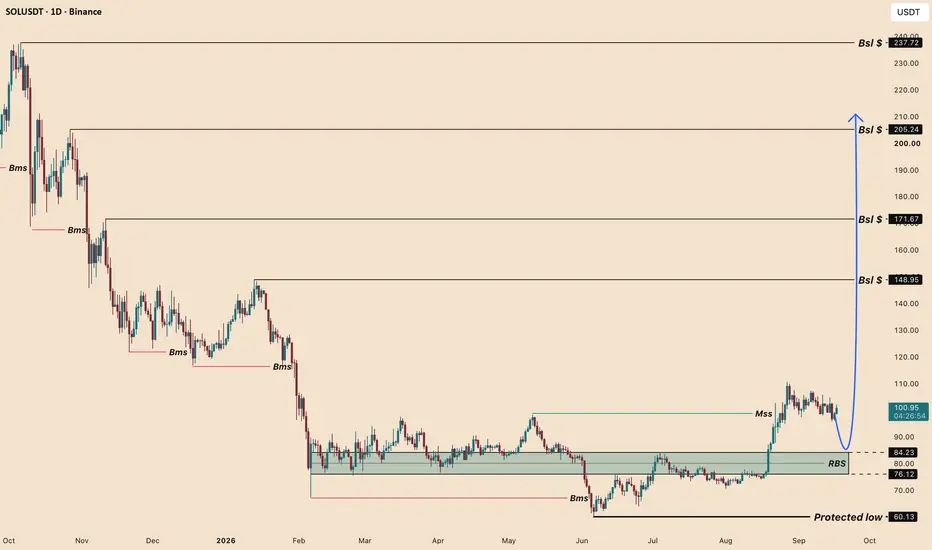
SOL | Structure Turned, Four Pools Sit AboveBy analyzing the #SOL (Solana) chart on the Daily timeframe, we can see a market that spent a year making lower lows, shifted structure upward in September, and now holds a discount zone beneath price with four untouched liquidity pools stacked above.
━━━━━━━━━━━━━━━━━━━━
DAILY TIMEFRAME
━━━━━━━━━━━━━━━━━━━━
The downtrend was relentless. From the October high at $237.72 price printed five separate BMS events on the way down — through October, November, December, February and again into June. Each consolidation that looked like a base became the next break.
The last of them bottomed at the Protected Low of $60.13 in June. From there price built for three months and then, in September, broke the May swing high with the MSS — the first upside structural break of the entire move. Price is now at $100.95 , holding above the break.
━━━━━━━━━━━━━━━━━━━━
THE LIQUIDITY ABOVE
━━━━━━━━━━━━━━━━━━━━
BSL 1 — $148.95
BSL 2 — $171.67
BSL 3 — $205.24
BSL 4 — $237.72
Four old highs, none revisited since they formed. A high that has never been defended isn't resistance, it's a target.
━━━━━━━━━━━━━━━━━━━━
THE BIAS
━━━━━━━━━━━━━━━━━━━━
Bullish for as long as price holds above the Protected Low at $60.13 .
━━━━━━━━━━━━━━━━━━━━
SCENARIO A — THE BASE CASE
━━━━━━━━━━━━━━━━━━━━
The entry is not here. The area worth waiting for is the RBS zone at $76.12 – $84.23 — the resistance that capped price from February through May, broken in September and now flipped to support. Price consolidated inside that band for seven months, which is what makes it the strongest demand on the chart rather than just a line.
A reaction from there targets $148.95 first, and above it the ladder opens.
━━━━━━━━━━━━━━━━━━━━
SCENARIO B — NO RETRACE
━━━━━━━━━━━━━━━━━━━━
Price never returns to the zone and continues directly from current levels. Same destination, worse price, and no defined risk — which is why this version is the one to watch rather than trade. The confirmation for a continuation entry is a daily close above $110.60 , the September swing high.
━━━━━━━━━━━━━━━━━━━━
INVALIDATION
━━━━━━━━━━━━━━━━━━━━
A daily close below the Protected Low at $60.13 . That is the origin of the shift, and beneath it the bullish structure is finished.
An earlier warning: a daily close below $76.12 with no reclaim means the RBS zone failed as support and the entry thesis is broken well before the structure is.
And the rule that governs all of it: a break is a candle close, not a wick. The RBS zone is where a wick beneath will look like failure — seven months of range-trading inside that band means stops sit on both sides of it, and that is exactly what a wick is built to collect.
━━━━━━━━━━━━━━━━━━━━
FUNDAMENTAL BACKDROP
━━━━━━━━━━━━━━━━━━━━
The network side is improving. Weekly network revenue rose to $45.35 million from $32 million , transactions climbed to 1.07 million , and the Transaction V1 upgrade lifted maximum transaction size to 4,096 bytes . Solana ETFs have now run an 11-week streak of positive inflows holding roughly $1.41 billion in assets.
The other side is real. Weekly ETF inflows collapsed 96% — from $153.87 million to $6.18 million — and trading volume halved from $699.39 million to $350.27 million . Much of the on-chain revenue is memecoin-driven, with Pump.fun at ~85% of launchpad activity, and that demand disappears faster than it arrives.
Strong network metrics, thinning institutional bid. That combination supports a retracement into discount far more than it supports chasing — which is exactly what the chart is already saying.
This analysis will be updated as the market evolves.
Best Regards, BigBeluga 🐳  Long
Long
Long
Short 
Should You Move Your Stop Loss to Breakeven?Breakeven feels safe. Moving it too early can still ruin a good trade.
🔵 Breakeven Feels Safer Than It Is
Moving a stop loss to breakeven feels smart because the trade can no longer lose on paper. Price moves a little in profit, the trader moves the stop to entry, and the mind relaxes.
The problem is that the market does not care that the trader wants comfort. A breakeven stop can be useful, but moving it too early can turn a good trade into a scratch before the setup has enough time to work. That is why breakeven should not be automatic. If the only reason for moving the stop is “I do not want this green trade to turn red,” the decision is emotional, not technical.
🔵 Too Early Means Too Tight
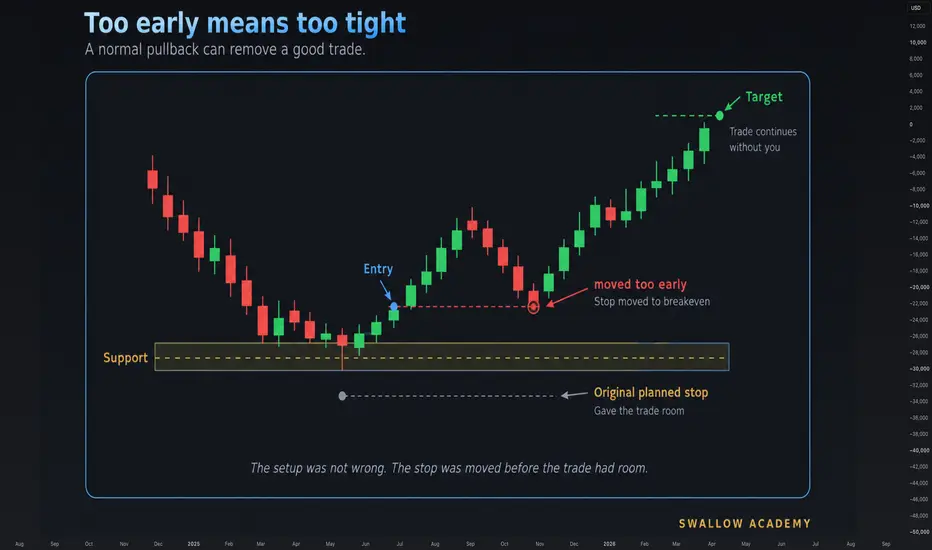
The most common mistake is moving to breakeven the moment price is slightly in profit. At that point, the trade may still be inside normal movement. Price can pull back to the entry, tap the stop, and then continue toward the original target without you.
This is not protection. It is often fear with a cleaner name. The trader wants the emotional relief of “I cannot lose now,” but the price may still need space to build the move. A stop should not move just because the trade is green. It should move because the trade has changed enough to justify a new risk point.
🔵 Move It When There Is A Reason
A better rule is to move the stop only after the market gives a real reason. That can be after price breaks and holds a key level, after a clean retest, after a new structure forms, or after partial profit has already been taken.
This is the difference between planned management and emotional management. Planned management says, “If price reaches this area and confirms, I can reduce risk.” Emotional management says, “I am slightly in profit and I want to feel safe.” At Swallow, moving the stop is not the problem. We also move stops when the trade gives the right reason. The mistake is moving it only for psychological safety while ignoring the structure of the trade.
🔵 Partials Make It Cleaner
Taking partial profit can make breakeven cleaner because some money is already secured. The rest of the position can then be managed with less pressure. But even then, the stop move should be part of the plan before entry, not a panic decision after seeing a small green number. For example, a trader may take partial profit at a planned area, then move the stop on the remaining position once price has reached a proper level. That is very different from moving to breakeven after a tiny push just to avoid feeling a loss.
Breakeven is useful when it supports the trade plan. It becomes harmful when it cuts the trade before the real target had a chance.
🔵 Ask Before You Move It
Before moving your stop, ask one simple question: am I moving it because the market gave me a reason, or because I want emotional comfort?
That question removes a lot of bad adjustments. It also keeps the trader honest. If the trade has not cleared a key level, has not formed new structure, and has not reached a planned partial area, there may be no reason to rush the stop. Sometimes the best move is leaving the stop where the original plan placed it.
🔵 Final Take
Moving your stop loss to breakeven can help, but only when it is part of the trade plan. Moving it too early does not make the setup better. It only makes the trader feel safer for a moment. Move the stop after proof, structure, or planned partials. Do not move it just because green feels better than risk.
Swallow Academy Education 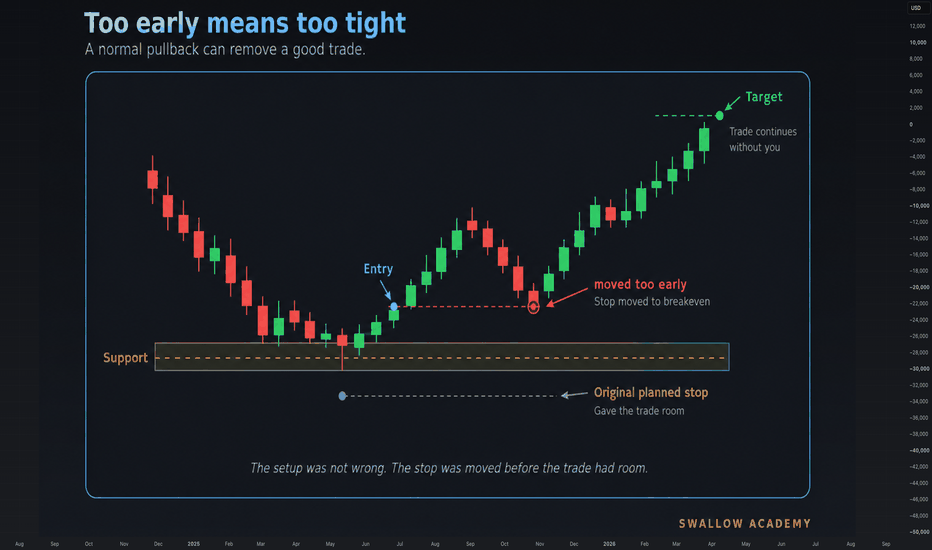
 Short
Short
BTCUSDT – Sellers Still Have the Upper HandIn my view, BTCUSDT remains tilted toward a bearish scenario in the short term, as macro pressure has not fully disappeared and the H4 structure remains contained within a descending channel.
From a fundamental perspective, the Fed has raised interest rates to 3.75%–4.00% and signaled that further tightening remains possible, an environment that can weigh on risk assets. At the same time, uncertainty surrounding U.S. crypto regulation continues to add pressure. However, easing Treasury yields and a recovery in U.S. equities are providing some support, meaning the bearish pressure is not entirely one-sided.
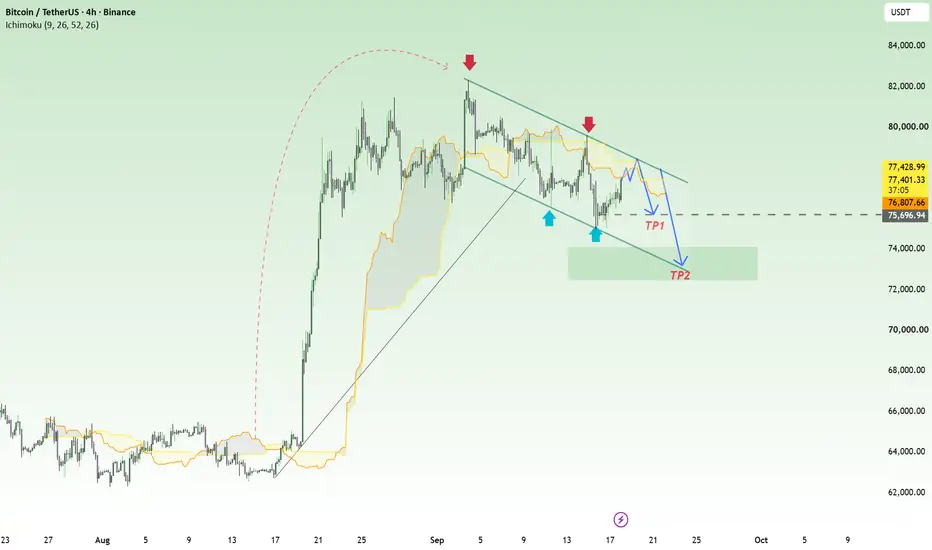
Looking at the H4 chart, BTC has recovered toward $77,445, but price has yet to break above the descending resistance line extending from the highs above $82,000. Recent rebounds have continued to form lower highs, while the $77,800–$78,500 area is becoming an important test for buyers.
My preferred scenario is for price to recover toward the upper boundary of the channel before sellers step back in. If BTC fails to break and hold above this resistance area, price could return to test $75,700. A clear break below this level could open the door for a deeper move toward $72,700–$74,000.
As long as the descending channel remains intact, I continue to favor bearish continuation, with $75,700 as the first downside target and $72,700–$74,000 as the next key area to watch. Short 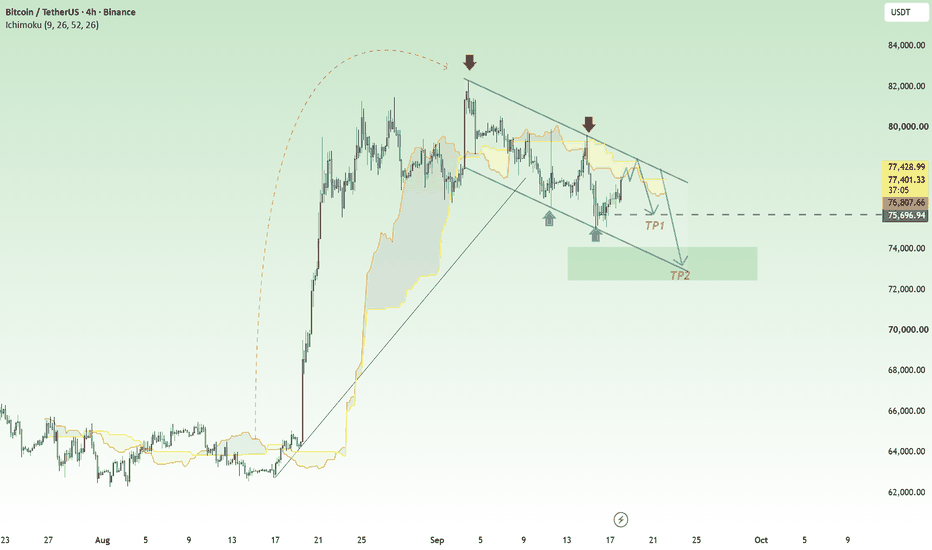
Long 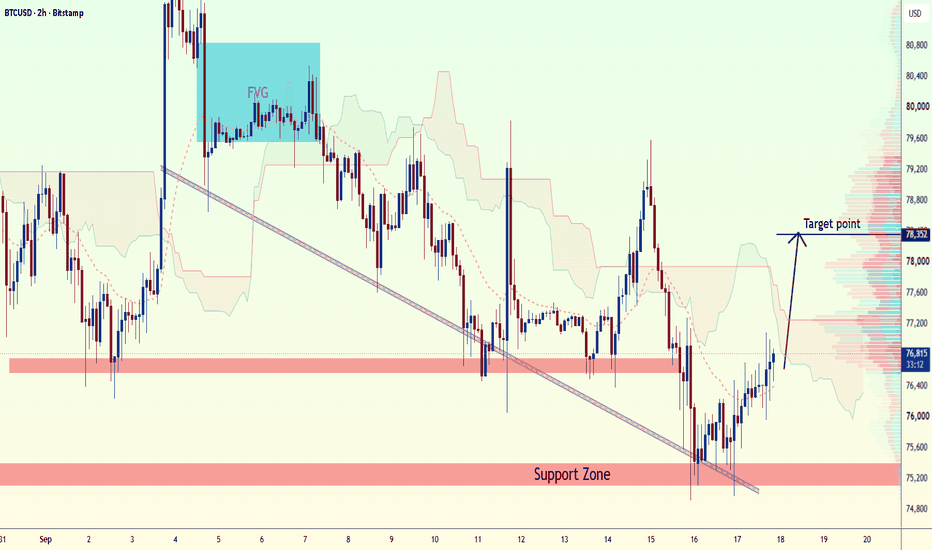
Location Gives Candles MeaningA bearish engulfing candle, hammer or long rejection wick can look convincing on a chart, but the shape itself tells you very little about whether the reaction actually matters.
The first question should be: where did it happen?
Suppose CRYPTOCAP:BTC prints a large bearish engulfing candle after moving from $78,000 to $80,000. If it forms somewhere in the middle of a range where price has already traded repeatedly, it may simply represent another short-term rotation between buyers and sellers.
Now imagine the identical candle appears after CRYPTOCAP:BTC pushes above a previous weekly high, trades into $84,000 and then closes back below that high. The candle has not become inherently more bearish, but its location gives the reaction much more information. Buyers attempted to establish price above an important reference and failed to maintain it.
This is why candle patterns become more useful when they appear at locations where something meaningful is being tested.
Previous highs and lows are one example, but location can also include the edge of an established range, a recent breakout area, a high-volume region, or the extreme of a strong directional move. At these places, the candle can help answer a specific question: did the market accept the new price or reject it?
There is another filter that makes this more useful: what did the candle actually accomplish?
A long lower wick at support may initially look bullish, but if the next several candles remain below nearby structure and price returns to the wick almost immediately, buyers achieved very little. The candle showed a reaction, not necessarily control.
Compare that with a rejection candle that forms below a previous low, closes back above it and is followed by price reclaiming the most recent short-term high. Now the reaction has changed the surrounding structure rather than simply creating an attractive candle.
This gives traders a better sequence for reading candlesticks: identify the location first, understand what price was attempting to do there, observe the reaction, and then judge whether that reaction produced a meaningful consequence.
The same candle can therefore deserve completely different treatment depending on where it forms and what follows it.
Do not ask whether a candle is bullish or bearish in isolation.
Ask what was being tested, who failed at that location, and whether the reaction was strong enough to change what price was doing beforehand.
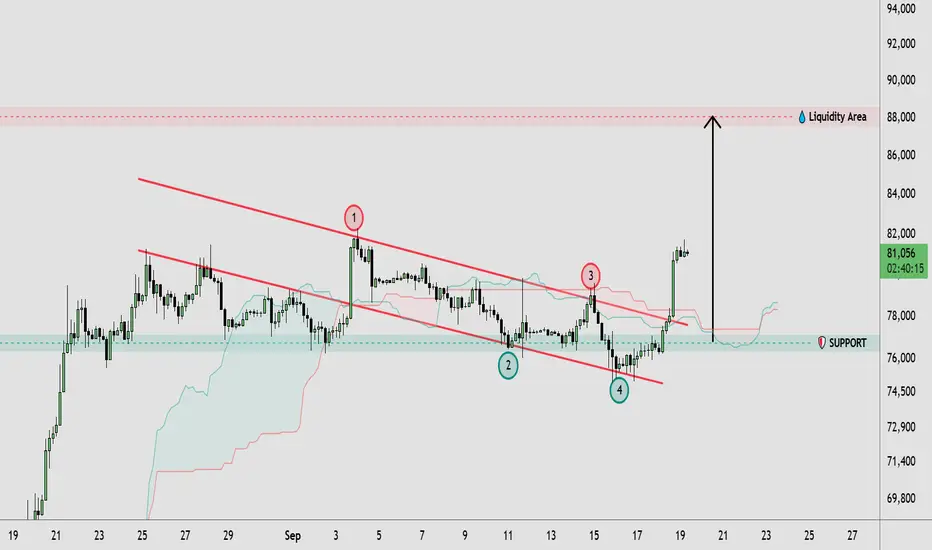
BTCUSD Breaks Descending Channel | 88K Liquidity in Focus🔹 BTCUSD has broken above the descending channel structure after multiple tests of its upper boundary, suggesting a shift in short-term price action. Price is currently holding around the 81,000 area after a strong bullish expansion from the 76,000–77,000 support zone. The breakout places attention on the recent swing highs around 82,000, while the larger highlighted liquidity area near 88,000 remains an important resistance region. The previous channel structure and support zone continue to provide key areas for market structure analysis.
🔸 If BTCUSD maintains the breakout and holds above the former channel resistance, price could continue building toward higher liquidity, with the 88,000 area becoming a potential zone of interest. Traders may wait for price confirmation and a successful retest before considering any trade. If the breakout fails and price moves back below the 76,000–77,000 support area, the bullish structure could weaken and a deeper retracement might develop.
This analysis is for educational purposes only and does not constitute financial or investment advice. Always conduct your own research before making trading decisions. Long 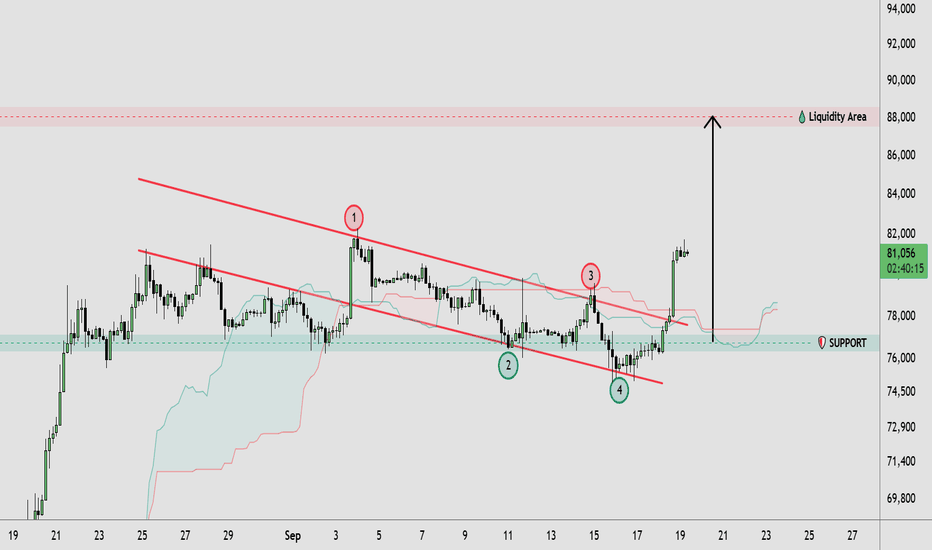
Bitcoin enters week Gaussian channel - September 2026Next stop: $95-96k with 100% probability.
Do you remember this idea?
At that time price action printed a candle body inside the channel around 101k on the weekly chart. Fairly unpopular amongst the Bitcoin maxis to tell them precious was going down.
Price action has now confirmed the channel once more. And the 100% ??
“At its core statistics is not about cleverness and technique, but rather about honesty.”
as my professor in operational research used to quote me.
Statistics also say most people die in hospital.. so stay away from hospitals. It’s not wrong, but you go there when you need to and people buy market tops because they must. Ask the maxis.
The also sell the bottoms, just like Tech lead..
If you can bring yourself to part with the fundamental mumbo jumbo, I’ll lay on the facts. Facts with confluence.
The Gaussian channel on the week after a bull / bear market.
Each of the weekly charts below has price action entering the channel after:
The end of a bull market
The end of a bear market
The all make this distinction short after the recently reported death cross. The would be the confluence mentioned earlier.
March 2023
April 2019 & March 2020
October 2015
But there’s more, $95-96k, why are you so certain?
That annoying subject again, statistics. Some say this is no strategy at all. You know who you are. Take another glance at the above charts, what do you see?
Every time price action enters AND confirms the entry (it has), price action will continue until the upper side is tested. Most assets do this, stock, crapto, Bonds, price of Hong Kong fishcakes. For the high majority of the time the statistic will play out. Bitcoin has a track record of 100% as measured throughout all price action history available.
Summery, no short selling amigo.
Is $95-96k the next market top?
No.
Do you know what it is?
Certainly do. A flex not many can make. Annoying isn't he?
It was the exact same process used to call the market to at strike120k from around 18k.
Do you know what that process was?
Some of you do, some of you don’t. If you’re meant to know, you will. If not, social media has done its work on you.
Is it possible for price action to reverse and test the lows? For sure.
Is it probable? No.
Ww
====================================================
Disclaimer
Past observations are evidence, not guarantees. A statistical pattern can have a 100% historical hit rate and fail on the very next observation. That's statistics. Irritating, isn't it?
Markets contain risk. Bitcoin contains quite a lot of it. Price can rise, fall, reverse, collapse, overshoot, undershoot, or spend three weeks doing absolutely nothing simply to make everyone involved look stupid. So don't buy because I said $95-96k. Don't sell because I said $95-96k. Don't leverage your grandmother because I said $95-96k.
Do your own analysis, understand your risk, and make your own decisions. And if Bitcoin doesn't reach $95-96k, congratulations: you've just witnessed the historical statistic change from 100%.
Science marches on. Long 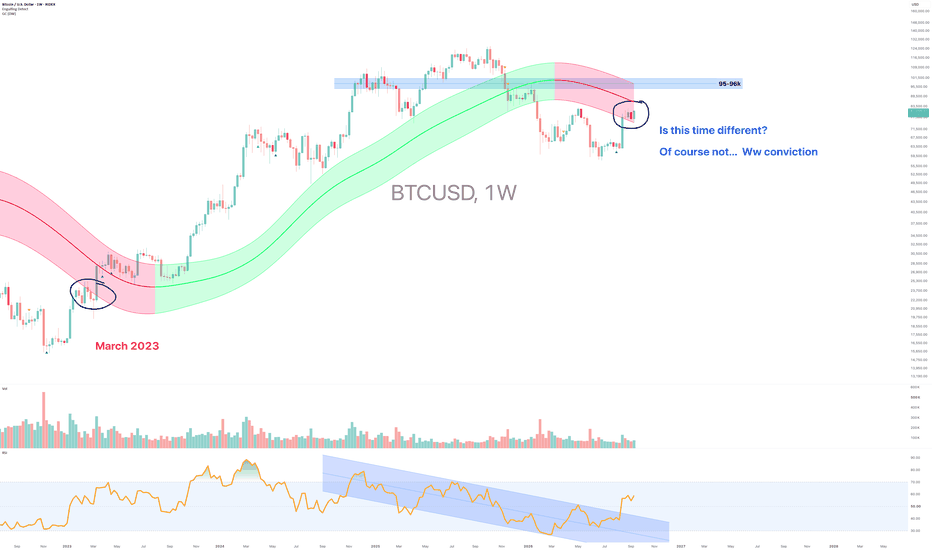
 Long
Long
Bitcoin Surges +7% — Is $85K a Breakout or a Bull Trap?Bitcoin ( BINANCE:BTCUSDT ) has gained more than 6–7% over the past few hours, building strong bullish momentum.
However, the rally is now entering a major technical resistance structure, while recent regulatory uncertainty and mixed institutional flows remain important risks.
Can Bitcoin establish itself above $85,000, or is the current move setting up another correction?
Macro Outlook
From a fundamental perspective, downside risk has not disappeared.
Bitcoin ETF flows have recently been volatile rather than consistently bullish, while the failure of the CLARITY Act to advance in the U.S. Senate has added further regulatory uncertainty.
For this reason, the current rally still needs confirmation before a sustained bullish continuation can be assumed.
Technical Analysis
Bitcoin is currently trading inside the Heavy Resistance Zone($84,500-$79,350), near the major Potential Reversal Zone(PRZ) , the Cumulative Short Liquidation Leverage($85,400-$82,300), and the Resistance Lines.
There is also a possibility that Bitcoin could finally fill the upper CME Gap($84,560-$83,215) after several months.
From an Elliott Wave perspective, Bitcoin appears to be completing Primary Wave 5, while Primary Wave 3 developed as an Extended Wave.
A Negative Regular Divergence(RD-) is also visible between Consecutive Peaks, providing another warning that bullish momentum may be weakening.
💡 Educational Note: When Wave 5 approaches major resistance while a Negative Regular Divergence develops, the risk of trend exhaustion and a corrective move can increase.
I expect Bitcoin to first enter deeper into the Cumulative Short Liquidation Leverage and the major Potential Reversal Zone(PRZ), potentially filling the upper CME Gap.
A Bull Trap above the Heavy Resistance Zone is also possible before the next bearish move begins.
From this area, I expect Bitcoin to decline toward at least $79,000. If bearish momentum increases, the correction could extend toward the key trading level of $77,700.
Trade Setup
First Take Profit(TP): $79,000
Second Take Profit(TP): $77,700
Stop Loss(SL): $87,300(Worst)
Key Trading Level: $77,700
Upper CME Gap: $84,560-$83,215
Which level do you think Bitcoin will reach first?
🔴 $77,700
🟢 $87,300
📌 Bitcoin Analysis(BTCUSDT) Daily time frame.
🛑 Always use proper risk management and set a Stop Loss(SL) for every position.
🚀 If this analysis helps your trading plan, a BOOST would help more traders discover it. Short 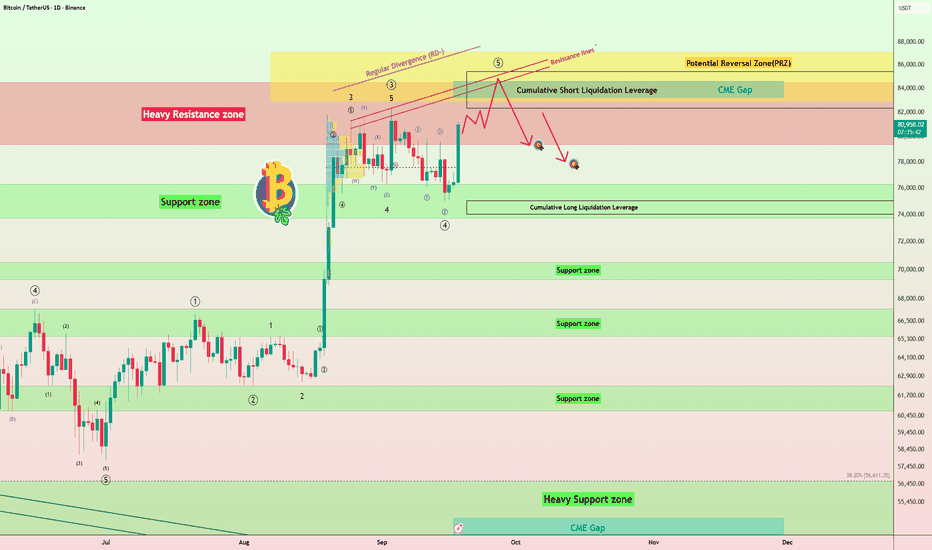
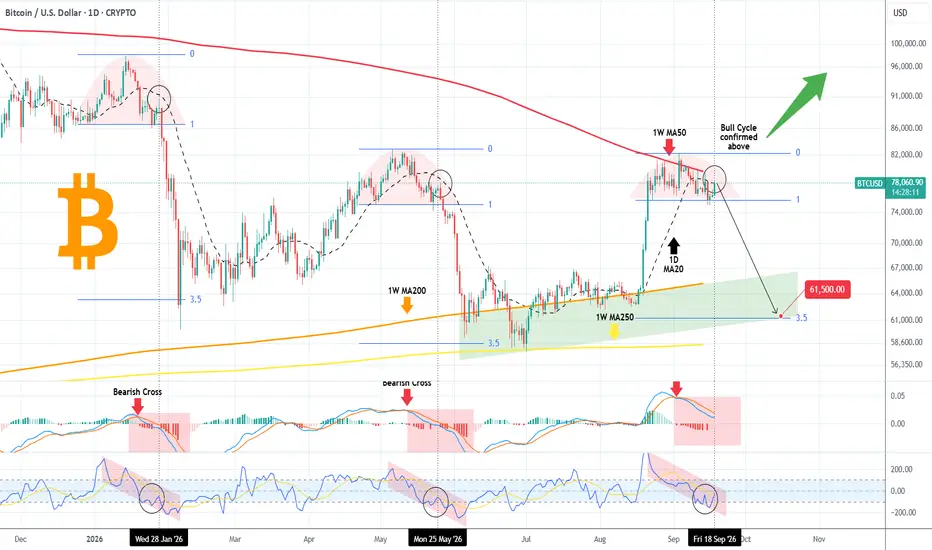
BITCOIN If this is avoided, the new Bull Cycle is confirmed.Bitcoin (BTCUSD) is having a strong 1D candle today, rebounding back to test its 1D MA20 (black trend-line). This is a critical moment as in relative terms, we are on the exact same spot as when the May (on the 25th) and January (on the 28th) Rounded Top Market formations started to break to the downside and initiated very aggressive corrections.
Additionally, today's 1D MACD and CCI patterns are almost identical to those of those two previous market Tops, the MACD still falling after a Bearish Cross, while the CCI is rebounding after marginally breaching -100.00.
This time BTC also faces, as we all know, the enormous bearish pressure from the 1W MA50 (red trend-line), which is the Bear Cycle's natural Resistance and has failed to break above it despite three straight weeks of testing. Essentially the 1W MA50 along with the 1D MA20 created our current Resistance Zone.
As long as it holds, BTC could follow the path of the previous two Bearish Legs that both hit their Rounded Tops 3.5 Fibonacci extensions. Based on that, the Target should be $61500. This falls almost in the middle of the 1W MA200 (orange trend-line) - 1W MA250 (yellow trend-line) Support Zone. The latter (1W MA250) is where the July 01 bottom was priced.
If BTC avoids the current enormous Resistance pressure an closes above its 1W MA50, then finally the new Bull Cycle can be confirmed. Enormous returns are expected for yet another Bull Cycle, so take advantage of this confirmed opportunity.
So do you think 1W MA50 will finally break or $61500 is in the cards? Feel free to let us know in the comments section below!
---
** Please LIKE 👍, FOLLOW ✅, SHARE 🙌 and COMMENT ✍ if you enjoy this idea! Also share your ideas and charts in the comments section below! This is best way to keep it relevant, support us, keep the content here free and allow the idea to reach as many people as possible. **
---
💸💸💸💸💸💸
👇 👇 👇 👇 👇 👇  Short
Short
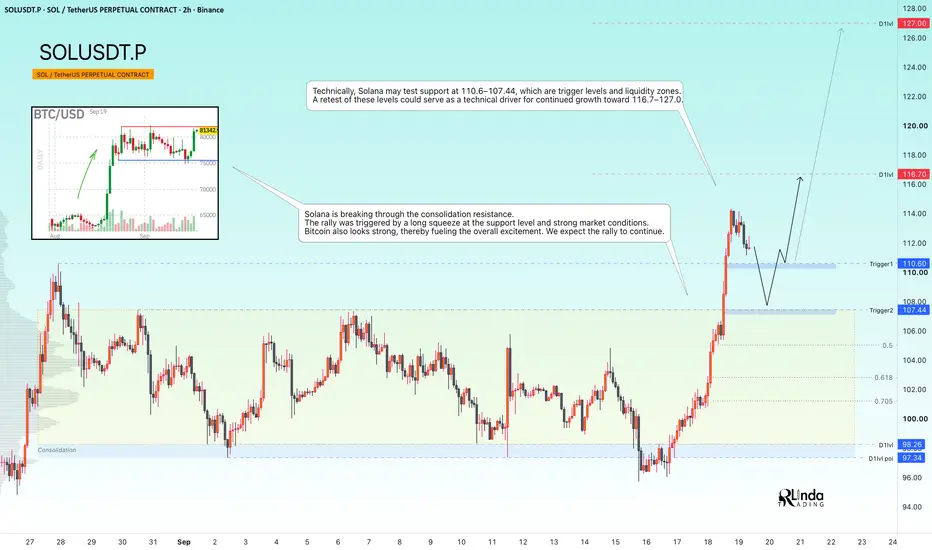
SOLUSDT - A hunt for liquidity ahead of the rally's continuationBINANCE:SOLUSDT confirms its bullish market structure. The long squeeze of support that we expected in the previous analysis played out perfectly. The bulls quickly took control of the situation and strengthened their positions...
Previously, we discussed how the market turned out to be stronger than expected: Bitcoin showed virtually no reaction to higher interest rates, the Fed’s hawkish stance, or the fact that the CLARITY Act was not passed. Consolidation continued, which further confirmed the strength of the market.
As for Solana, the altcoin is breaking through the consolidation resistance, suggesting that the coin is ready to continue its move higher. The rally was triggered by a long squeeze of support and the overall strength of the market
Resistance levels: 116.7, 127.0
Support levels: 110.6, 107. 44
Technically, Solana could retest the 110.6–107.44 support zone, which represents both key triggers and liquidity areas. A retest of these levels could become a technical catalyst for further upside toward 116.7–127.0
Best regards,
R. Linda!  Long
Long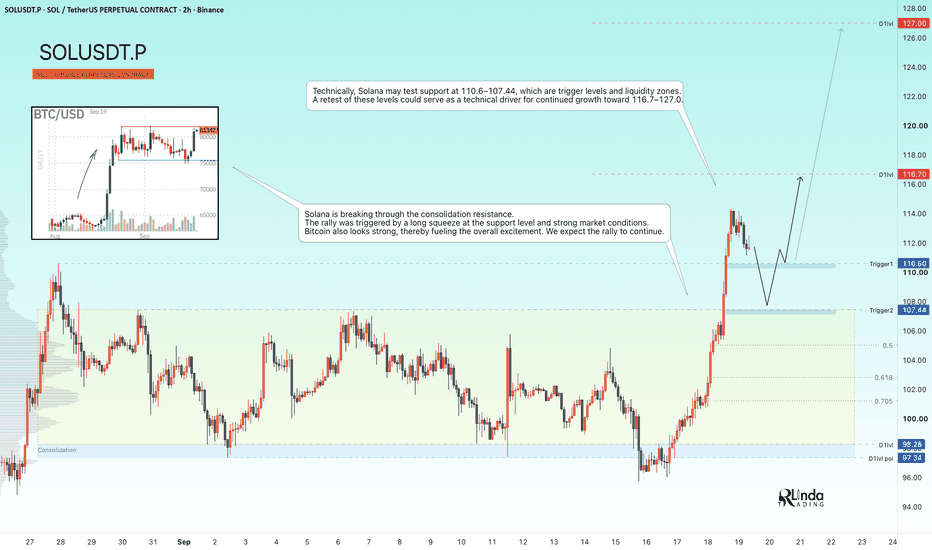
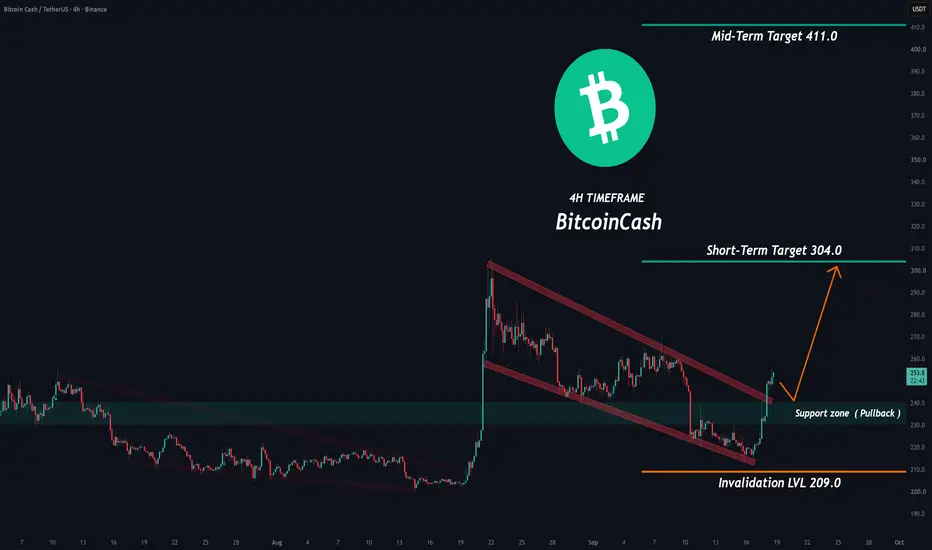
BCH: The Wedge Has Finally BrokenAfter spending time inside the corrective wedge, BCH has finally broken out of the structure.
This is the part of the chart I was waiting to see.
The breakout doesn't mean the entire move is guaranteed from here. What matters now is whether BCH can hold the breakout and continue building momentum above the pattern.
For the mid-term view, there is one important resistance ahead.
That resistance is where I want to see how the market reacts.
If BCH reaches that area with strong momentum and breaks it cleanly, the structure can open the door for another leg higher.
If it gets rejected, a pullback would not automatically invalidate the bullish structure. In that situation, I would rather watch how price reacts around the previous breakout area before making a new decision.
So the idea here is quite simple:
The wedge has broken.
Now we watch how price behaves after the breakout.
Setup
Current structure: Bullish breakout from the corrective wedge
Main scenario:
Hold the breakout → continue higher → test the first major resistance.
Mid-term scenario:
A clean break and confirmation above the major resistance can create room for the next expansion.
If price pulls back:
The previous breakout area becomes important. A healthy retest followed by bullish price action can provide a better-defined setup than chasing the current move.
I would not treat the breakout itself as a reason to enter blindly.
The quality of the retest and the reaction around the important levels matter more.
A little fundamental context
Bitcoin Cash remains one of the older large-cap cryptocurrencies, with its original focus centered on peer-to-peer payments and relatively low-cost on-chain transactions.
There is also a fresh market catalyst around BCH right now. Grayscale has filed to convert its Bitcoin Cash Trust into a spot Bitcoin Cash ETF, with the proposed vehicle intended to trade on NYSE Arca. The filing does not mean an ETF has been approved, but it has clearly become an important part of the current BCH narrative.
That development is worth keeping in mind because BCH has recently been moving with noticeably higher momentum. At the same time, the broader crypto market remains an important variable, and BCH has historically been capable of making relatively sharp moves in both directions.
For me, the fundamental news is supportive of paying attention to BCH, but the chart still has the final word on the setup.
What matters from here
The important part is that the wedge is no longer the resistance.
The market has already done the breakout.
Now we watch whether buyers can turn that breakout into a sustained move.
The next major resistance is the area I will be watching most closely for the mid-term.
Save this analysis.
When BCH reaches the marked targets or the structure changes, I'll update the analysis.
Risk Warning: This is educational market analysis, not financial advice. BCH and the wider crypto market can be highly volatile. Always define your risk and invalidation before entering a position.  Long
Long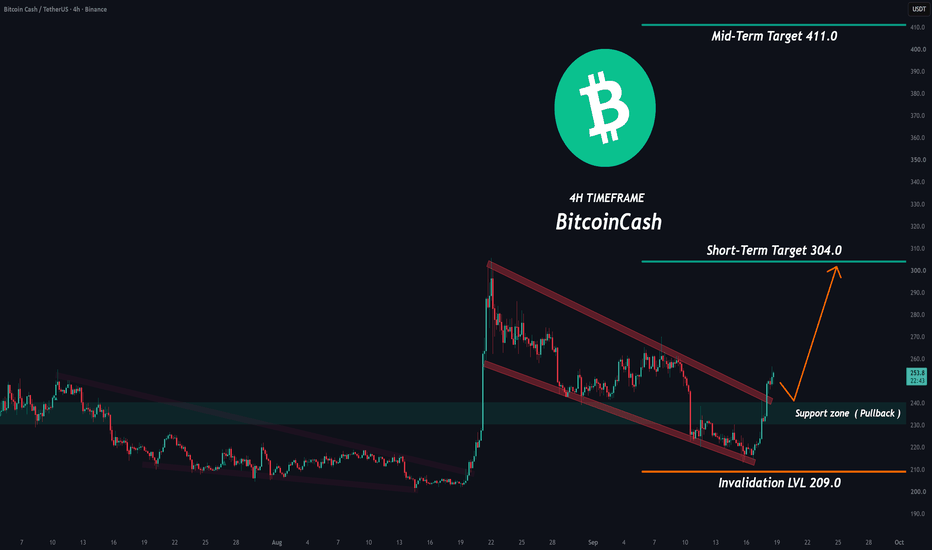
Long 
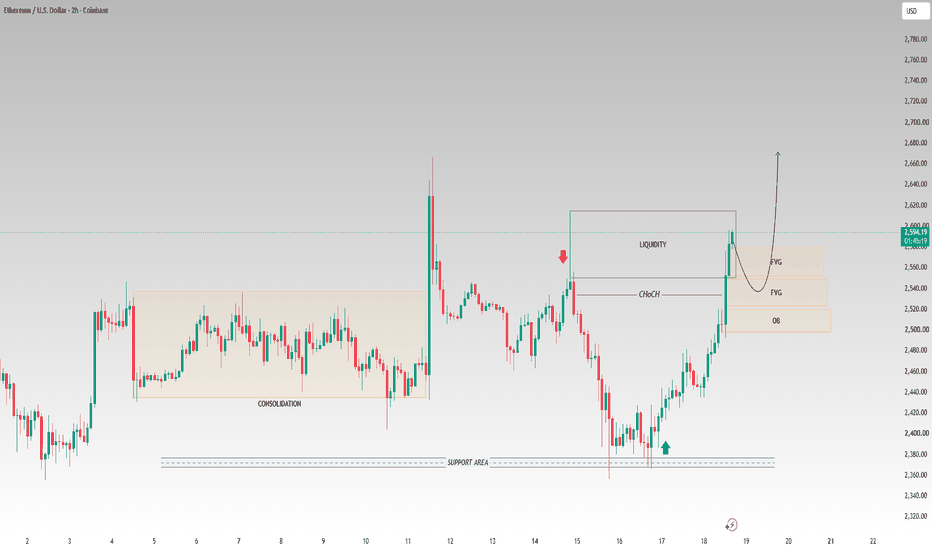
ETH/USD — Liquidity Sweep, CHoCH & Bullish Continuation🚀 ETH/USD — Liquidity Sweep, CHoCH & Bullish Continuation
📊 Market Structure
ETH/USD has shown a strong recovery from the 2,370–2,390 support area. After the downside move, buyers stepped in and price formed a clear bullish reaction, followed by an upward structure shift.
💧 Liquidity Zone
Price has now pushed into the marked 2,580–2,620 liquidity area, where previous price action suggests resting liquidity. This zone may produce short-term volatility or a pullback before the next directional move.
🔄 CHoCH Confirmation
The marked CHoCH around 2,535–2,545 indicates a shift from the previous bearish structure toward a more bullish intraday structure. Holding above this area keeps the bullish scenario technically supported.
📦 Key Zones
Liquidity: 2,580–2,620
FVG: 2,540–2,560
FVG: 2,520–2,540
Order Block: 2,500–2,520
Major Support: 2,370–2,390
🎯 Bullish Scenario
If price retraces into the FVG/Order Block area and buyers defend the zone, a continuation toward the upper liquidity and 2,650–2,680 region could be considered.
⚠️ Invalidation
A decisive break and sustained move below the 2,500–2,520 Order Block would weaken the current bullish structure and require reassessment.
🧠 Key Takeaway
The chart currently shows support reaction → CHoCH → strong upside displacement → liquidity test. The main focus is whether ETH can hold the marked FVG/OB zones during any pullback.
📌 Educational market analysis only. Wait for price confirmation and manage risk before taking any trade. Long