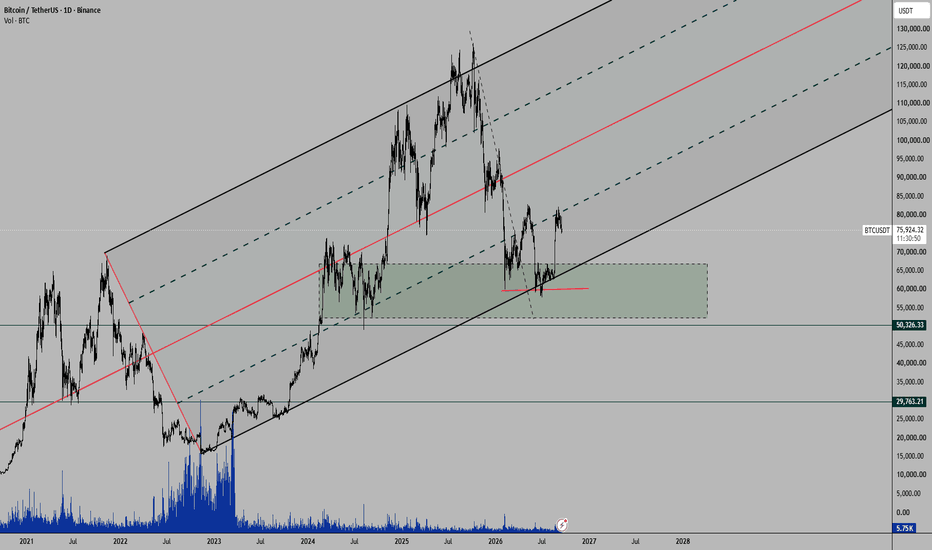
Long
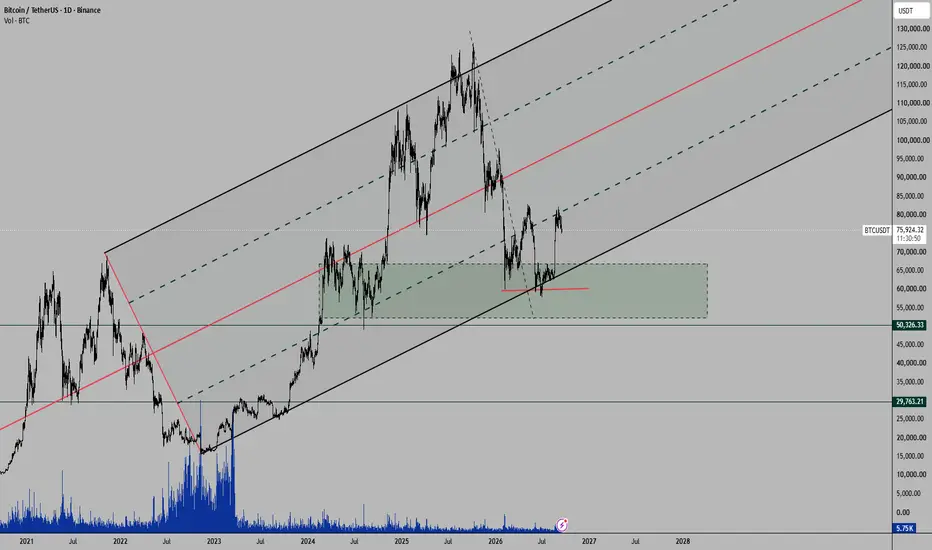
Long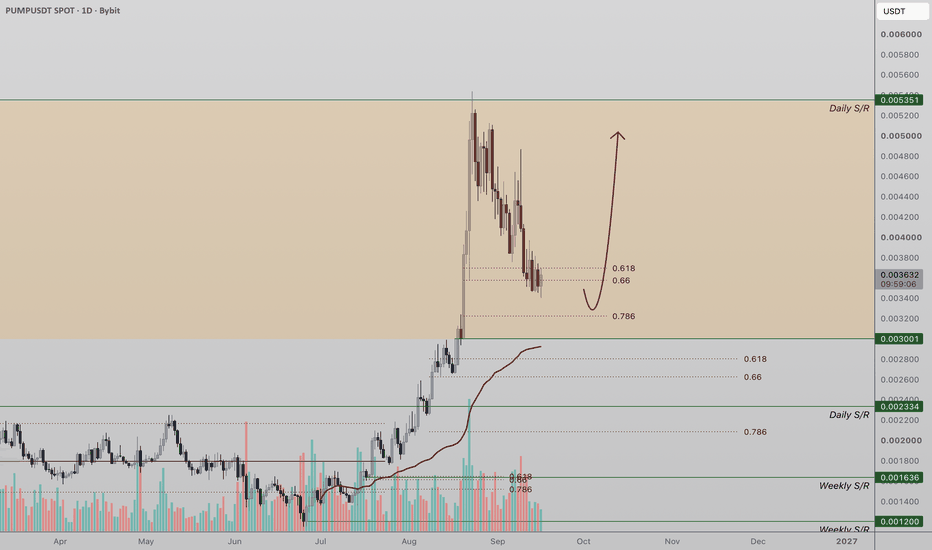
 Short
Short
Mean reversion is real on 1-minute bars and still doesn't payI logged 1-minute bars for 15 US equities and 8 crypto pairs for several weeks, computed 35 features on every bar, and wrote the tests down before I looked at anything. Then I ran them. The result is a negative one, and it is the more useful for it.
The dataset. 273 equity sessions (1.54 million bars) and 362 crypto days (3.04 million bars), one feed, one minute at a time. Horizons of 15, 60 and 240 bars, declared in advance. Cost model 2 basis points a side, so 4 basis points a round trip. Walk-forward folds by day, a daily cross-sectional t-statistic as the significance metric, a Bonferroni correction, and a holdout beginning where the live logging began, which I never opened.
What the data says, loudly. Short-term mean reversion exists. RSI, stochastics, Bollinger percent-b, the 5- and 15-bar returns, the 9/20 EMA spread - all negatively related to the next H bars. Information coefficient about -0.013 on equities with a daily t between -8 and -12; about -0.04 on crypto with t between -13 and -18. Alongside it, a volatility premium: Bollinger width, bar range and body size all positive. Statistically this is not in doubt.
What the data also says. It is worth roughly half a spread. The gross top-minus-bottom decile spread runs 1 to 4 basis points at every horizon in both asset classes, against a 4 basis point round trip on the equity side and closer to 50 for spot crypto at a 25 basis point taker fee.
It matters that these are two different families of test, because they answer different questions. Screening the features for significance is 35 features at each of three horizons: 105 tests. Asking whether anything is tradeable is separate - three pre-declared rule families, 96 Bonferroni-corrected tests in total, and zero of them pay their costs. Candle patterns added nothing worth the name either: pooled absolute t under 2, which at day level is nothing at all.
The lesson is not that mean reversion is fake. It is that significance and tradeability are different questions, and only one of them is answered by a p-value. A t-statistic of -18 tells you the sign is real. It tells you nothing about whether the magnitude clears the fee, and on 1-minute bars the magnitude is about half of what it would need to be.
Two things I would suggest to anyone running the same experiment. Declare the horizons and the cost model in writing before the first regression, so they cannot quietly move afterwards. And put the tradeability table - gross spread against round trip - next to the significance table, so the second number is never read without the first.
Historical research on logged data, not a live record. Not advice.  Long
Long
TSLA Is Stuck Under Its Own Moving Averages at $360Alright, I spent way too long on this chart today for something that's basically going sideways. TSLA pumped to around $380 in early September like it had somewhere to be, then turned around and dumped straight back toward $356 - the market equivalent of sprinting to the buffet and immediately regretting it. Now it's just sitting around $360, doing absolutely nothing, stuck around its moving averages like it can't decide if it wants to be a winner or a disappointment today.
What I'm actually watching:
🔴 $364 - the near-term invalidation
🔴 $360.45 - the fast SMA, also acting as a lid, because apparently TSLA wanted to fail twice for style points
🔴 $356 - the bottom of the resistance zone that's been tested repeatedly and refuses to disappear
🔴 ~$360 - current price
🟢 $355.35 - the long SMA
🟢 $352 - the next support / floor
The long case (if it actually earns it):
If TSLA closes a 4H candle above $364, I'll believe buyers showed up instead of just window shopping. Entry around $360-364, SL below that $356 area, TP1 $368, TP2 $372 if it actually has momentum instead of vibes.
The short case (if $356 finally gives up):
If $356 breaks and closes below, I'm not shorting the first red candle like it personally wronged me - I'd rather watch it confirm. If it does, the next stop I'd look at is $352, which is the next clear support/floor on this chart.
Disclaimer: This is my personal interpretation of market structure, not financial advice. I always define invalidation before entering, size positions carefully, and accept that price can do something different from my base case.  Long
Long
Short 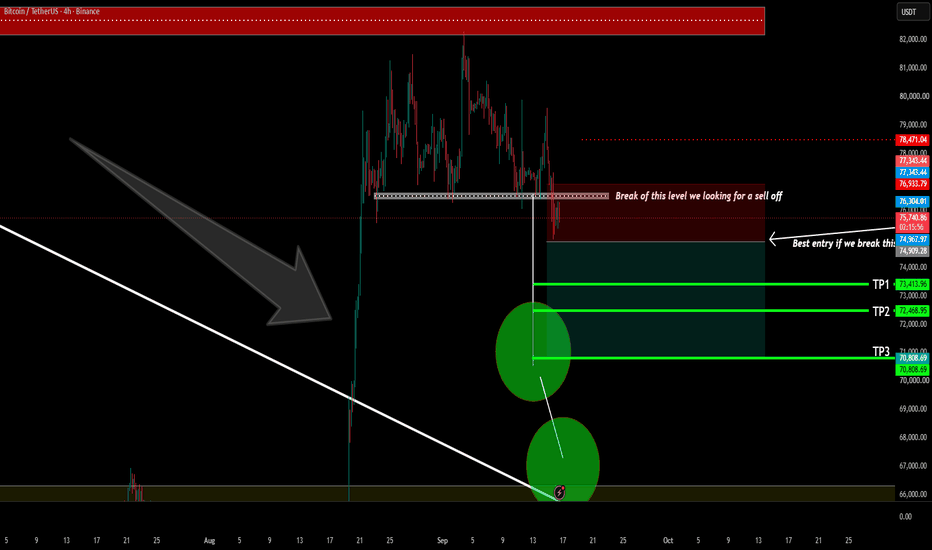
BITCOIN / USD — 2H DETAILED TECHNICAL ANALYSIS ₿ BITCOIN / USD — 2H DETAILED TECHNICAL ANALYSIS 📊
🔻 Bearish Channel + Liquidity + FVG Structure
Current price shown: ~75,722
Chart timeframe: 2H
Structure: Bearish / corrective
Major resistance: ~82,313
Major demand/FVG: ~73,000–74,100
1️⃣ MARKET STRUCTURE 🧭
The chart shows a clear sequence of lower highs and lower lows inside descending bearish channels.
Price initially moved through a strong bullish expansion around the 21st, but after reaching the 82K resistance region, sellers became active.
From the 82K area, BTC started forming:
Lower High → Lower Low → Lower High → Lower Low
This structure currently favors sellers unless price can reclaim the important overhead resistance zones.
2️⃣ BEARISH CHANNEL 📉
There are two visible descending channel structures.
The most recent channel is particularly important because price repeatedly respected its upper and lower boundaries.
The upper channel line acted as dynamic resistance, while the lower boundary provided temporary support.
Eventually, BTC broke lower from this structure and accelerated toward the 75K area.
⚠️ This suggests that the previous channel support did not produce a strong enough reversal.
3️⃣ CURRENT PRICE ACTION 🔍
Price is currently hovering around 75.7K after a sharp decline from approximately 79K–80K.
The candles around 75K show some consolidation.
This is important because consolidation after a strong decline can produce two possibilities:
🔻 Continuation
Price makes a small relief bounce, fails to reclaim resistance, and then resumes the downside.
🔄 Reversal
Price establishes a higher low, breaks the nearby resistance, and begins recovering toward 78K–80K.
At the moment, the chart itself does not yet show a confirmed bullish reversal.
4️⃣ IMPORTANT RESISTANCE ZONES 🧱
🔴 76,800–77,300
This is the first area I would monitor if BTC produces a relief bounce.
A rejection here could create another lower high.
🔴 78,000–79,000
This is a more significant reaction zone because previous price action consolidated and reacted around this region.
A strong reclaim would weaken the immediate bearish structure.
🔴 79,500–80,000
This is another major supply/rejection area.
If price reaches this region, watch carefully for:
bearish rejection candles
failed breakout
lower-timeframe market-structure shift
decreasing momentum
🔴 82,313 — MAJOR RESISTANCE
The chart explicitly marks this as the RESISTANCE AREA.
This is the major level separating the current bearish structure from a much stronger bullish recovery scenario.
5️⃣ SUPPORT & FVG ZONES 🟩
🟢 75,000–75,500
Immediate psychological/support region.
Price is currently testing this area.
A sustained hold could produce a short-term bounce.
🟢 73,900–74,100
First major FVG zone shown on the chart.
This area could attract price if the 75K support fails.
🟢 73,000–73,700
Second FVG / demand region.
This is particularly important because the chart shows multiple inefficiency zones stacked together.
A deeper retracement into this area would bring BTC closer to the previous bullish expansion base.
6️⃣ ORDER BLOCK 📦
The chart also identifies an ORDER BLOCK around the lower region near 72K–73K.
This area is important because it represents the origin/base associated with the previous strong upward move.
If price reaches this region, traders would typically watch for:
📌 liquidity sweep
📌 rejection
📌 bullish displacement
📌 market-structure shift
However, simply touching an order block does not guarantee a reversal.
Confirmation remains important.
7️⃣ LIQUIDITY ANALYSIS 💧
The recent decline has likely created liquidity around the recent lows.
The area below 75K is therefore important.
A possible sequence could be:
75K support → liquidity sweep → bounce → resistance test
or:
75K break → continuation → FVG fill → deeper demand test
The chart's projected path visually suggests a temporary upward retracement followed by another bearish leg.
That projection should be treated as a scenario rather than a certainty.
8️⃣ POSSIBLE BEARISH SETUP 🔻
The chart's projected movement suggests:
Current zone → relief bounce → resistance rejection → downside continuation
A technically cleaner bearish confirmation would be:
BTC holds/reclaims a nearby support.
Price bounces toward 76.8K–77.3K.
Price fails to break the resistance.
A lower high forms.
Price breaks the local consolidation low.
Downside targets become the FVG zones.
Potential downside areas:
🎯 TP1: 74.1K
🎯 TP2: 73.5K
🎯 TP3: 73.0K
🎯 Extended: 72K–73K order-block region
These are chart-based levels, not guaranteed targets.
9️⃣ BULLISH ALTERNATIVE 🟢
The bearish thesis becomes weaker if BTC starts reclaiming resistance.
A potential bullish sequence would be:
75K hold → higher low → 77K reclaim → 78K–79K breakout → 80K test
The important thing is not simply a wick above resistance.
I'd look for 2H candle acceptance above the level and follow-through.
A sustained reclaim of the descending structure would indicate that sellers are losing control of the short-term trend.
🔟 INVALIDATION / CONFIRMATION ⚠️
🔻 Bearish confirmation
A rejection from 76.8K–78K followed by a break below the current 75K consolidation would strengthen the bearish continuation scenario.
🟢 Bullish confirmation
A sustained reclaim of 78K–79K followed by a break of the descending resistance structure would weaken the bearish setup.
🚨 Major structural level
82,313 remains the major resistance marked on your chart.
📋 KEY LEVELS
Zone Importance Reaction to Watch
82,313 🔴 Major resistance Breakout / rejection
79.5K–80K 🔴 Supply Rejection or reclaim
78K–79K 🔴 Resistance Structure confirmation
76.8K–77.3K 🟠 Near resistance Relief-bounce rejection
75K 🟡 Current support Hold / breakdown
73.9K–74.1K 🟢 FVG Reaction / bounce
73K–73.7K 🟢 FVG Demand reaction
72K–73K 🟢 Order block Potential deeper demand
🧠 FINAL MARKET MAP
Above 78K–79K:
➡️ Bearish pressure starts weakening
➡️ 80K becomes relevant
➡️ 82.3K remains major resistance
Between 75K–78K:
➡️ High-volatility decision zone
➡️ Relief bounce remains possible
➡️ Watch for lower-high formation
Below 75K:
➡️ Downside continuation becomes technically more relevant
➡️ 74.1K FVG becomes the next area to monitor
➡️ 73K–73.7K becomes deeper demand
🎯 OVERALL CHART BIAS
🔻 Bearish while price remains below the major resistance structure.
The most important thing on this chart is not to chase the current drop. The cleaner technical confirmation would come from either a bounce into resistance followed by rejection or a confirmed breakdown of 75K support.
⚠️ Educational technical analysis only — not financial advice. Use appropriate risk management and wait for confirmation before taking a trade. Short 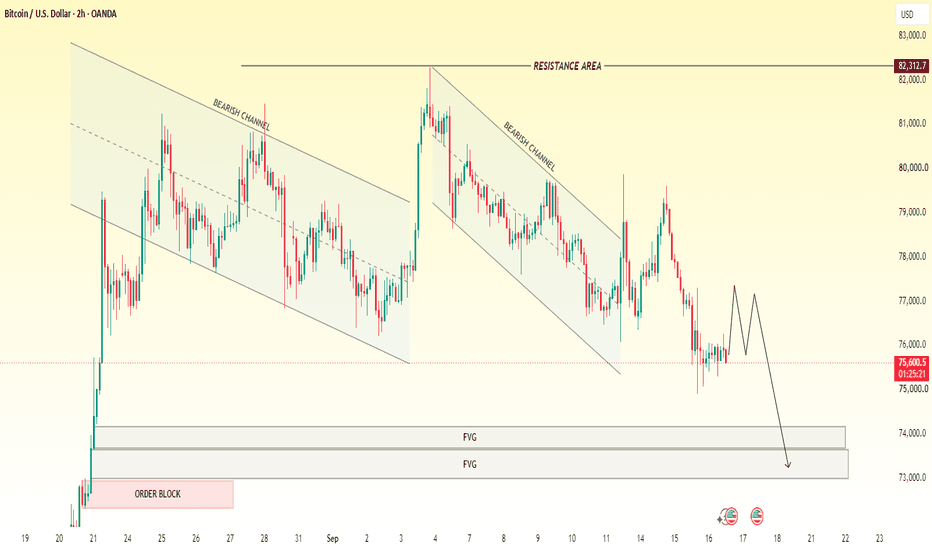
Short 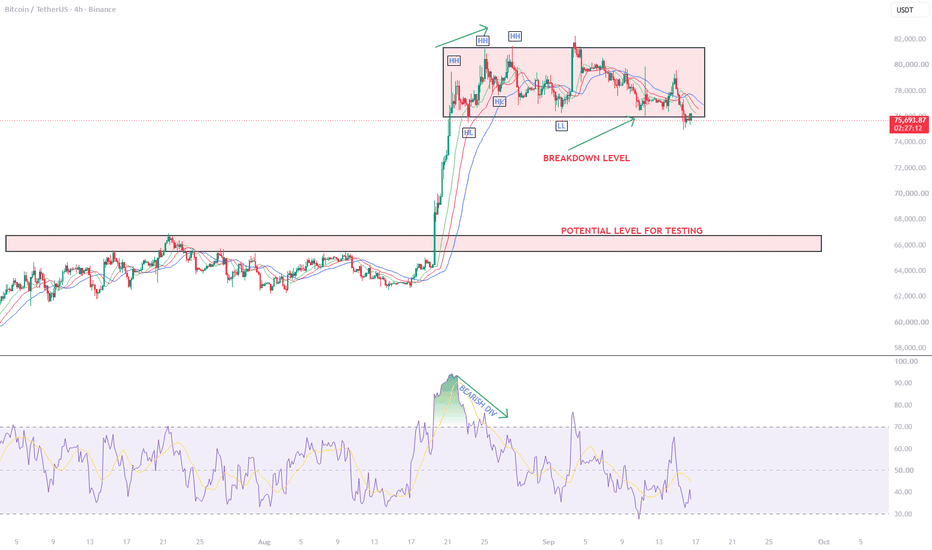
BTCUSD | $76.7K Pivot Could Decide Bitcoin’s Next Major MoveBITSTAMP:BTCUSD Bitcoin is entering a critical technical and fundamental window ahead of today’s Federal Reserve decision. BTC is trading around the mid-$75K area after recently losing momentum near $80K, while the market is simultaneously dealing with elevated Treasury yields and uncertainty around U.S. crypto legislation. Reuters notes that this week’s Fed decision is a major test for Bitcoin’s recent recovery, while the 10-year Treasury yield has recently pushed above 5%.
Technically
The daily chart shows an important change in Bitcoin’s structure.
After breaking out from the long consolidation around $65,800, BTC produced a strong bullish expansion toward the $82,350 area. However, buyers have so far failed to establish a sustained breakout above that resistance, and price is now correcting back toward the key $76,680 pivot area.
As long as Bitcoin remains below $76,680–$77,000, short-term bearish pressure remains active, with $72,600 representing the next important downside support.
A confirmed daily breakdown below $72,600 would weaken the post-August bullish structure considerably and could expose the previous breakout zone around $65,800.
That $65,800 area is particularly important because it previously acted as major resistance before the August breakout. A retest from above would therefore represent a major technical test of whether the broader recovery remains intact.
On the bullish side, stability back above $76,680 would improve the short-term structure and could support another attempt toward $82,350. A confirmed daily breakout above $82,350 would be the stronger signal that buyers have regained control.
Pivot Line: 76,680
Support: 72,600 – 65,800 – 60,280 – 57,360
Resistance: 82,350 – 88,170 – 92,520
Fundamental Structure
The Fed is currently Bitcoin’s biggest macro catalyst. Markets overwhelmingly expect a 25-basis-point rate hike, while the bigger question is whether Chair Kevin Warsh signals that this is a one-off adjustment or the beginning of additional tightening. Reuters reports that policymakers are expected to lift the target range to 3.75%–4.00%, against a backdrop of persistent inflation and very high Treasury yields.
For BTC, a hawkish Fed + higher Treasury yields would generally be the more difficult combination. Higher risk-free yields tighten financial conditions and make speculative/liquidity-sensitive assets less attractive, increasing the risk of BTC losing its current pivot and testing lower supports.
A 25bp hike accompanied by softer guidance, particularly if long-term yields retreat, could have the opposite effect and support a recovery toward the upper resistance zone.
There is one important complication today: Bitcoin has recently become less correlated with both the U.S. dollar and equities, meaning the immediate post-Fed reaction may not follow the traditional USD/yields relationship as cleanly as usual Short 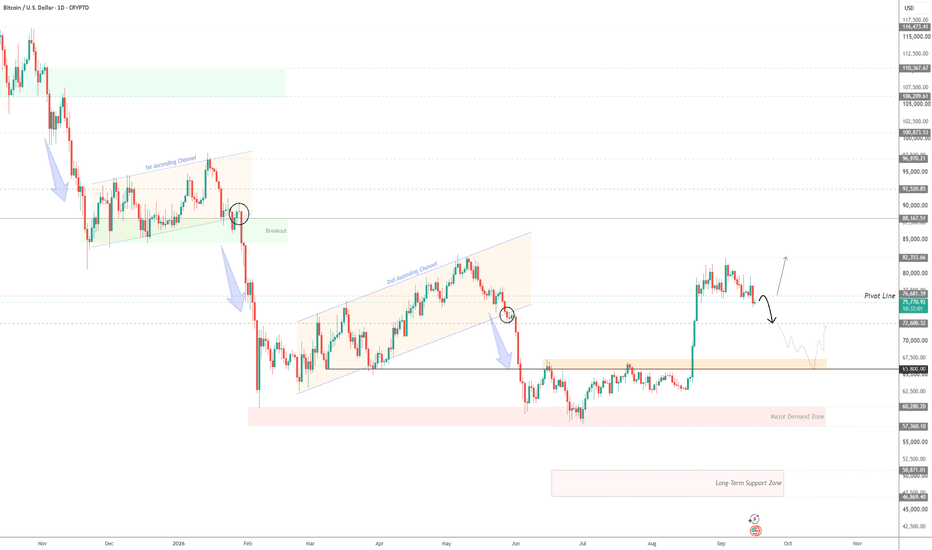
Long 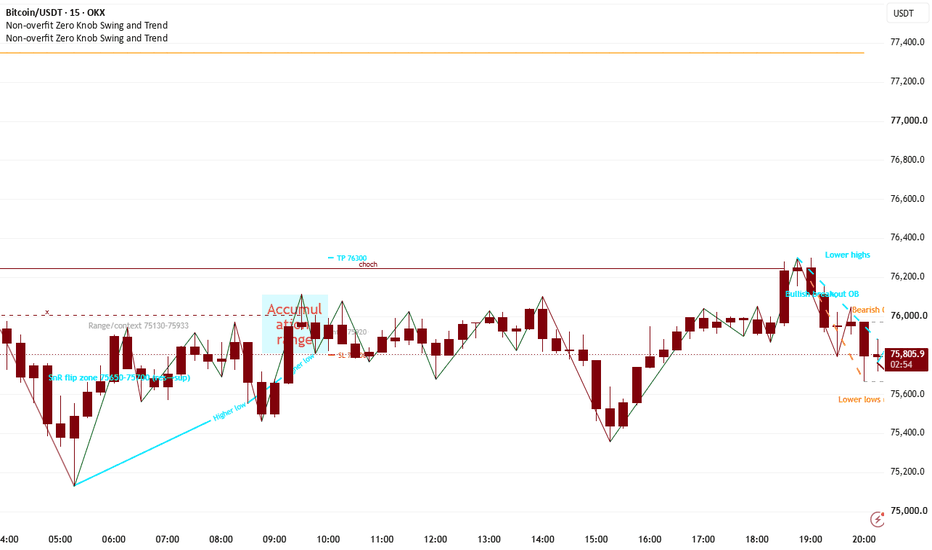
BTCUSD | TECHNICAL ANALYSIS | BULLISH SCENARIOBTCUSD is currently reacting from the 75,200–75,400 support zone after a strong bearish move.
Key Levels:
* 🟢 Support: 75,200–75,400
* 🟠 Resistance: 77,300–77,600
* 🔴 Higher Supply / OB: 78,800–79,600
Bullish Scenario:
If price continues to hold the support zone and develops bullish momentum, a move toward 77,300–77,600 could be possible. A confirmed breakout and close above this resistance may open the way toward the 78,800–79,600 area.
Bearish Scenario:
A decisive break and close below 75,200 would weaken the bullish setup and could indicate further downside.
⚠️ This is a technical analysis, not financial advice. Manage risk carefully and wait for confirmation before entering a trade.
Short 
Long 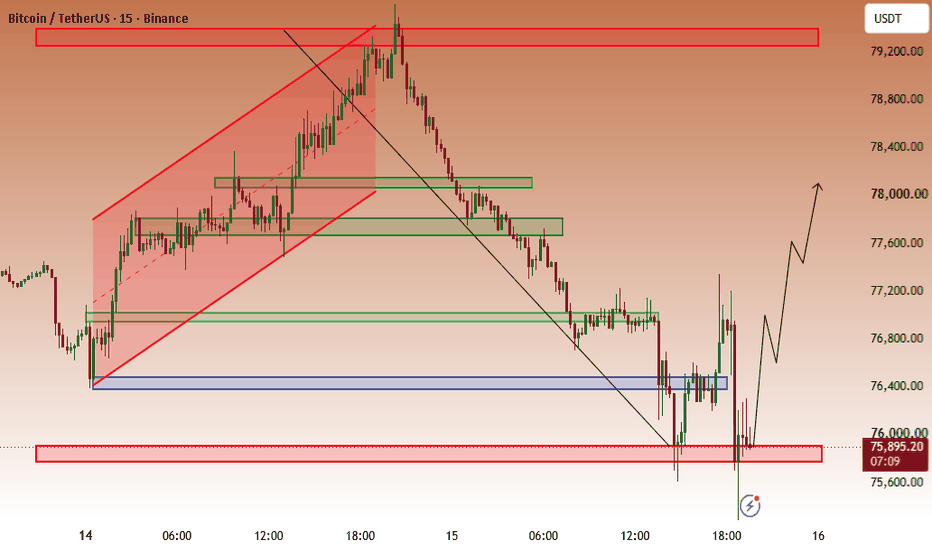
 Long
Long
Silver | When Structure Speaks, We Listen⏱️ Reading time: about 3 minutes
In our previous Silver analyses, we focused on identifying the first motive wave to the upside from the recent low — a structure that could develop into a five-wave impulse. After the latest movement, the main question is no longer simply “up or down?” but rather what degree does the current correction belong to, and is it still developing or already complete?
🟦 Scenario 1 | Bullish Case
In this view, the initial bullish structure remains important. The recent decline may be part of a corrective structure, while the current movement could be building the next stage of that correction.
If the current correction develops as a sideways structure and price then breaks out with a clear motive pattern, the possibility of further upside becomes more relevant.
But for us, a simple move through a price level is not enough — the structure must prove itself.
If the next advance is truly a motive wave, we should also be able to recognize a clear and consistent structure at the smaller degree.
In that case, a break of the recent high followed by a correction proportional to the wave’s degree and character could provide more information about the next phase.
⬛ Scenario 2 | Bearish Case
In the conservative view, the recent decline may represent the first part of a larger corrective structure — potentially something similar to W within a zigzag or double zigzag.
The current advance could therefore be a connecting or corrective wave, such as X, or part of a larger B wave.
If this advance fails to develop into a valid motive structure and price then declines with strength again, a deeper corrective structure becomes possible. Another zigzag could develop, eventually completing Y.
In that case, the larger decline would still be part of the same higher-degree corrective wave.
🔎 The Key Point
At this stage, both structures remain under observation, and the type of structure itself may still change. That is why every new price action requires a fresh review.
We are not deciding the future path in advance.
We wait for the market to show us whether the current movement can develop into a motive wave, or whether it will ultimately prove to be part of a more complex corrective structure.
Patterns whisper; I listen.
— Mr. Nobody 🎧📊
Silver / U.S. Dollar
Sep 6
Silver 4H | The Structure Is Speaking — Elliott Wave Update
Sep 2
Silver | Let the Waves Speak
CETUSDT🚨 End of an Era: CoinEx Announces Official Shutdown After 9 Years! 🚨
CoinEx, one of the most widely used crypto exchanges by non-KYC traders, has officially announced that it will cease all operations. Here is what you need to know about its journey and shutdown:
🔹 From Mining to Exchange:
Founded in late 2017 by Haipo Yang (creator of ViaBTC), CoinEx quickly grew into one of the top platforms by trading volume by mid-2018.
🚫 Major Security & Regulatory Hurdles:
After recovering from a $70M hot wallet hack in September 2023, the exchange faced severe regulatory pressure in the US, followed by reports highlighting significant transaction flows linked to international entity compliance risks.
⁉️ Why Is CoinEx Shutting Down?
CoinEx is not insolvent. According to its latest Proof of Reserves (PoR), it maintains over 100% backing across major assets. The official closure is driven by:
1️⃣ Prolonged crypto market stagnation
2️⃣ Sharp decline in trading volume & liquidity
3️⃣ Escalating regulatory and compliance costs
🗓 Crucial Timeline for Asset Withdrawal:
Sep 15, 2026: New registrations paused; Futures set to Close-Only.
Sep 29, 2026: Spot trading completely suspended.
Dec 22, 2026: Final deadline for all asset withdrawals and system shutdown.
📌 Action Required: If you still hold funds on CoinEx, make sure to withdraw all your crypto assets to a private wallet before the December deadline!
Amir Hassan Salek, CFTe financial markets analyst
امیرحسن سالک تحلیلگر بازارهای مالی Market Concepts · Lesson 18 — Channels, Wedges & TrendlinesLesson 18 - Channels, Wedges and Trendlines: Trading Structured Price Patterns
Difficulty: Intermediate
Not every move happens in random chop. Sometimes price organizes itself into clean geometric patterns — channels, wedges, trendlines — that tell you exactly where reactions are likely. Learning to read these patterns adds a whole layer of structure to your chart.
🔵 TRENDLINES: THE FOUNDATION
A trendline is a diagonal line connecting two or more swing points that move in the same direction. In an uptrend, connect the higher lows. In a downtrend, connect the lower highs. The line becomes a diagonal support or resistance that price often respects.
The strongest trendlines share a few traits:
- Three or more clean touches
- Reactions that are decisive, not slow drifts
- Visible across timeframes — a trendline that shows up on both the 4H and daily carries more weight
Trendlines eventually break. When they do, the break itself is often the trade signal — a decisive close through a well-tested trendline usually marks a real shift in direction.
🔵 CHANNELS: TRENDLINES IN PAIRS
A channel is two parallel trendlines — one connecting the lows, one connecting the highs. Price bounces between them like a corridor.
Channels come in three flavors:
- Ascending — both lines slope up. Price is trending higher inside the channel
- Descending — both lines slope down. Price is trending lower inside the channel
- Horizontal — the classic range. Both lines are flat, and price oscillates between fixed support and resistance
Trading channels is often simple: buy near the lower line, sell near the upper line, until one side breaks. The break usually leads to a strong directional move — often a full "measured move" equal to the channel's height.
🔵 WEDGES: THE SQUEEZE PATTERN
A wedge is like a channel that's narrowing — the two lines converge instead of running parallel. This "squeeze" builds pressure, and when the wedge finally resolves, the breakout tends to be sharp.
Two main types:
- Rising wedge — both lines slope up, but the upper line rises slower than the lower. Often bearish (usually breaks down)
- Falling wedge — both lines slope down, but the lower line falls slower than the upper. Often bullish (usually breaks up)
Wedges are compression patterns. The tighter the pattern gets, the more explosive the resolution usually is. Trading them is about waiting for the break, not fading the pattern.
🔵 TRADING STRUCTURED PATTERNS
A few practical habits when trading these patterns:
- Wait for at least 3 touches before treating a line as reliable
- Trade the break, not the pattern itself — many wedges and channels get retested before breaking
- Use the pattern's height to project targets — a break usually travels a distance similar to the pattern's size
- Combine with confluence — a channel break that aligns with an order block, FVG, or key reference level is much stronger than the break alone
Structured patterns aren't magic. They're just visual representations of the same forces you've been learning about — where buyers and sellers agree on prices, where they disagree, and where the balance eventually shifts.
🔵 COMMON MISTAKES TO AVOID
- Drawing lines that require force to "fit" — if it takes work to make the trendline touch the swings, it's not really there
- Trading inside a channel without watching for the eventual break — sooner or later, every channel resolves
- Fading a wedge before it breaks — the safer trade is with the break, not against it
- Ignoring the higher-timeframe context — a bullish wedge inside a strong downtrend still fights the trend
🐳 PRO TIPS
- The cleanest patterns are the ones you can spot in three seconds — if you have to squint, it's probably not there
- Higher-timeframe patterns are more reliable than lower-timeframe ones — a daily channel matters much more than a 5-minute one
- Watch for volume on the break. A break with real volume behind it is far more likely to follow through than a quiet drift through the line
- Failed breaks (a break that reverses quickly) are often powerful reversal signals in themselves — the trapped side becomes fuel for the opposite move
Structured price patterns are one of the older tools in trading — but they still work, because the human behavior behind them hasn't changed. Learn to read them, and you add another lens to your chart.
Market Concepts — All Lessons
Lesson 01 — What Order Blocks Are
Lesson 02 — Zone Strength Isn't About Size
Lesson 03 — Entering Trades With Order Blocks
Lesson 04 — Old Order Blocks As New S/R
Lesson 05 — Breaker Blocks
Lesson 06 — HTF Blocks With LTF Entries
Lesson 07 — BOS vs Change of Character
Lesson 08 — Structure Quality: Strong vs Weak
Lesson 09 — Fair Value Gaps
Lesson 10 — Order Blocks + FVG Confluence
Lesson 11 — Swing Failure Patterns (SFP)
Lesson 12 — Buyside & Sellside Liquidity
Lesson 13 — SFP + Liquidity Combo
Lesson 14 — Building A Solid S/R Map
Lesson 15 — Reading Volume Profiles
Lesson 16 — Combining Key Levels & Zones
Lesson 17 — Opening Range Breakouts
Best Regards, BigBeluga 🐳 Education 
Short 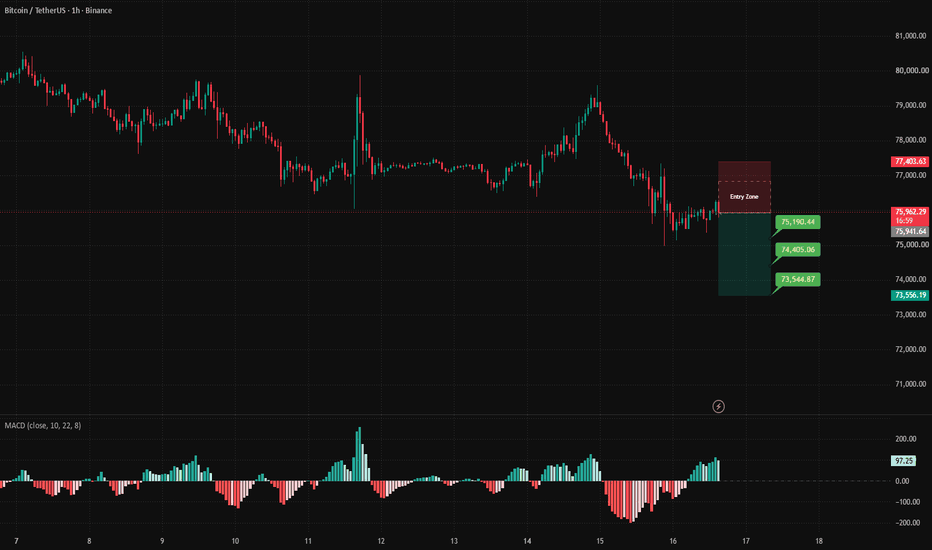
BTC/USD Range Sweep into Rebound or Trendline Continuation Drop?Technical Breakdown Liquidity Sweep:
Bitcoin performed a sharp liquidity sweep below the $76,400 low, tapping into the major Buying Zone ($76,000 – $76,600) before bouncing back toward $77,000.
Higher-Timeframe Trend: Order flow remains overall bearish under a descending resistance trendline and the primary Selling Zone ($79,200 – $79,600).
Current Action: Price is reacting off demand, setting up a corrective rally toward upper supply confluence.
Dual Trading Scenarios
Scenario A: Rebound to Overhead Supply (Primary Bias)Trigger: Lower-timeframe shift (MSS) holding inside the $76,000 – $76,600
Buying Zone. Execution: Long entry targeting the corrective push toward the trendline and upper supply.
Targets: $78,000 $\right arrow$ $79,200 – $79,600 (Selling Zone).
Scenario B: Trendline Rejection & Bearish Continuation Trigger: Mitigation of the $79,200 – $79,600 Selling Zone along the descending trendline.
Execution: Short entry upon bearish lower-timeframe rejection.
Targets: $77,000 $\right arrow$ $75,500.Community Discussion Are you playing the rebound off demand or waiting to short the trendline supply?
Comment 🟢 for Long Rebound or 🔴 for Supply Rejection below! 👇
Educational purposes only. Always manage risk strictly. Short 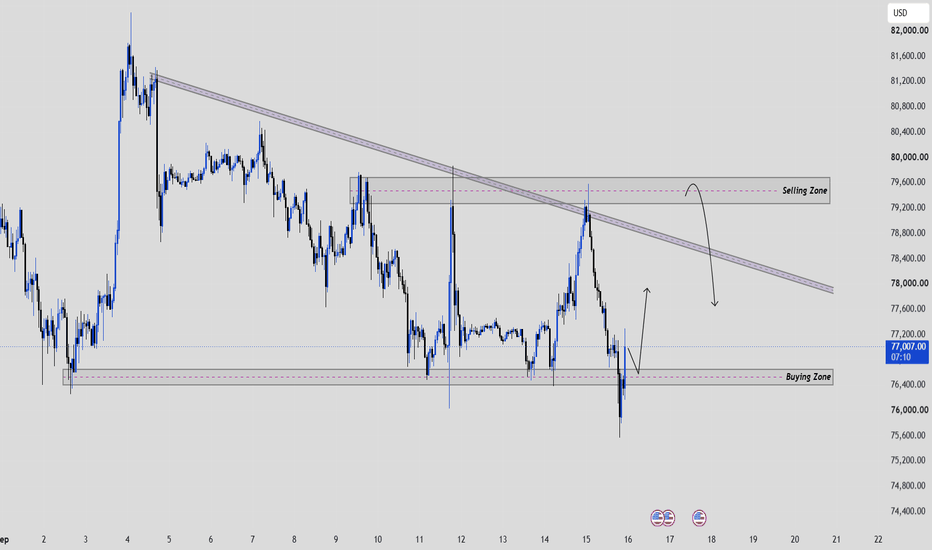
BTC Short Thesis: Clarity Act Rejection Adds PressureThe immediate catalyst is the Clarity Act failing to clear the Senate cloture vote yesterday, with the vote ending 49–50. The market had been pricing some regulatory optimism into crypto, and that catalyst is now off the table in the near term.
On the BTCUSDT 4H, Bitcoin pushed into the high $70Ks before reversing sharply. Price is now around $75.8K, below the $76.4K–$78.4K resistance area. I’m trading this setup as part of my Bitget KCGI 2026 journey, and the key question now is whether BTC can reclaim that resistance or continue weakening from here.
My BTC short setup:
🔴 Entry: $76,528.00 or market price
🛑 SL: $78,749.00The ascending trendline from the August lows is still intact, so I’m not calling for a confirmed breakdown yet. The key resistance levels remain $76,401, $76,959 and $78,393–$78,587, while $72.8K and $69.1K are the downside levels I’m watching.
I’ll document the entry, size, invalidation and final result in my KCGI journal — including the loss if this one fails. One clean contest line is enough.
Not financial advice. This is my personal market thesis.
🎯 TP1: $72,812.00
🎯 TP2: $69,177.00
Short 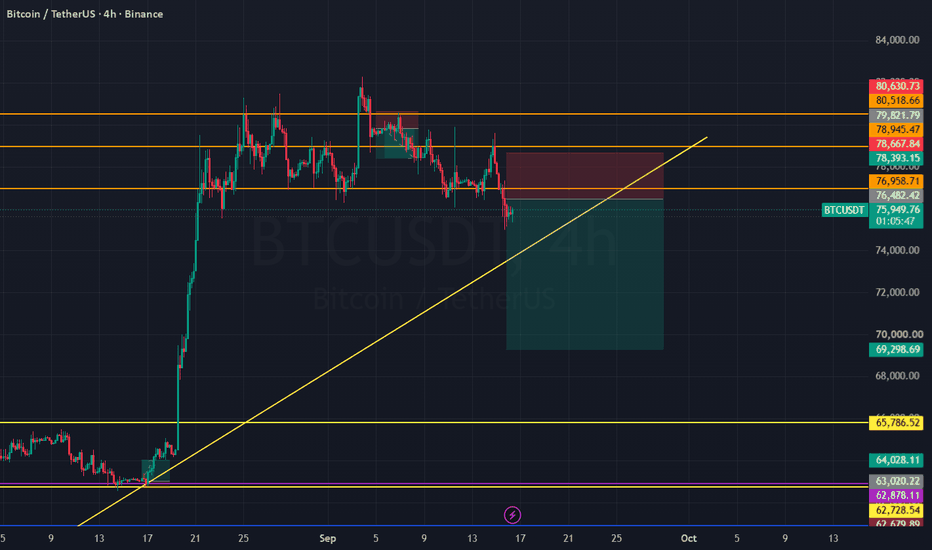
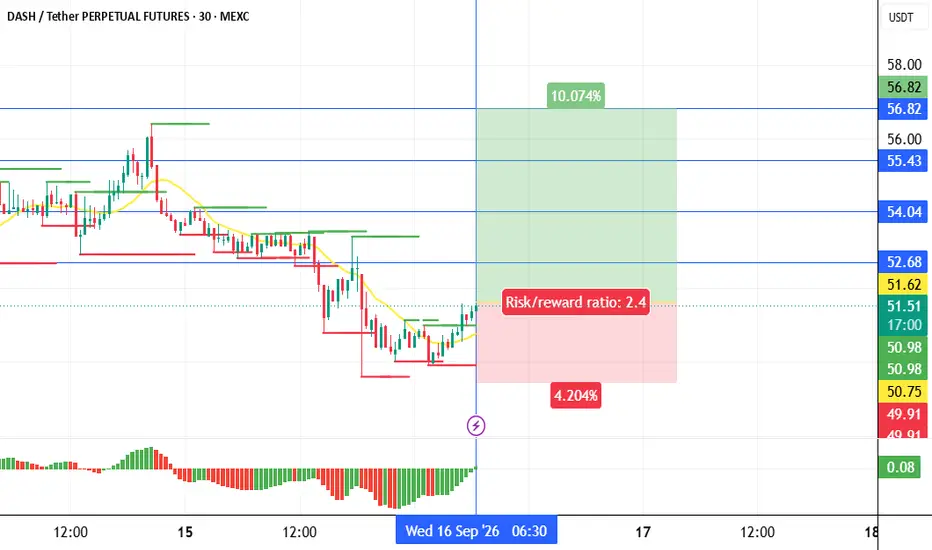
dashusdt longInstructions:
Entry point: yellow
Stop loss: red
Take profit: green or blue
👉Leverage x 5-10-20 for crypto
👉Leverage x 20-50-100 for commodities, stocks, indices, and forex
👉Margin 1-5% max.
Always practice risk and money management.
Invest a maximum of 5% on any trade or across all your trades.
Invest only what you can afford to lose, as no one is in control of the market.
👉Our analyses are primarily based on:
breakouts: two trend lines (ascending and descending) and a line indicating a horizontal breakout.
chart patterns: shoulders and head, triangle parttern, elliott impulse, etc etc.
We don't always have the time to track them at all times or to represent them visibly, given the numerous signals, the number of channels to manage, and especially because of the often rapid pace of market movements.
indicators: We associate at least two indicators with this technique.
👉Depending on the circumstances, we use specific indicators, often setting 3 or more take profit levels.
👉Indeed, there are good days in trading and also bad days. No one can promise to win every trade, and like all traders worldwide, we also experience stop-loss orders. However, we win more than we lose and remain positive.
👉You can close the position before or after the take profit orders indicated by the green lines if you are personally satisfied; the same applies to stop loss orders.
👉We must stay positive, clear-headed, and humble.
we cannot provide all instructions or all trades here on this channel.
Good luck to us all, and may God guide us. Amen.  Long
Long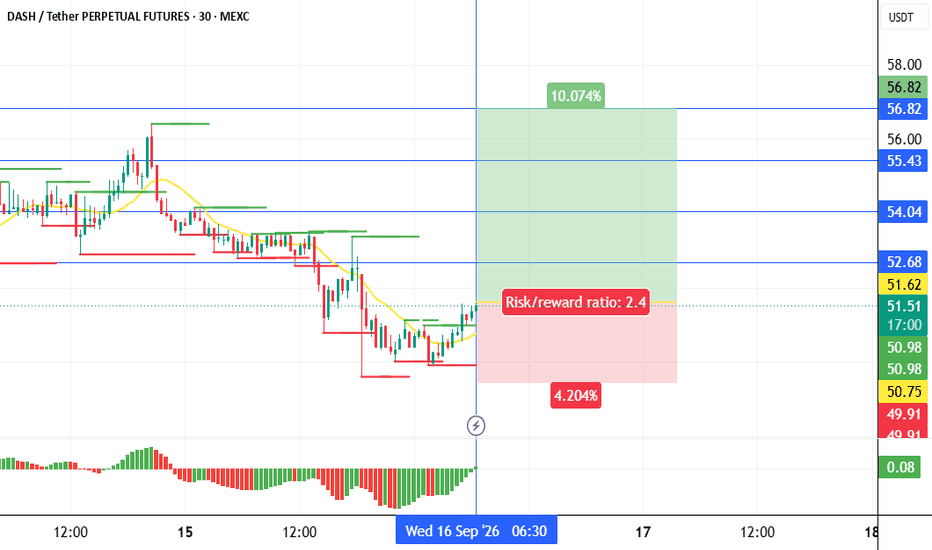
Leverage and Risk Management: A Practical GuideDisclaimer: This article was originally written in Spanish. Therefore, I cannot guarantee that the English translation is completely free of errors or inaccuracies.
Trading has existed for thousands of years, just like people with limited financial resources. That is precisely why credit was born. If you needed to finance an expedition, you borrowed money; if you wanted to expand a business, you borrowed money; if you believed an investment was going to work out perfectly, you borrowed money...
Loans fueled great periods of economic prosperity, but they also incubated some of the biggest financial crises in history, such as the Crash of 1929.
In the past, lenders' capital carried a certain degree of risk. A bad harvest, war, catastrophe, or an inbred monarch could ruin everything. But over time, financial mechanisms evolved, and since the 19th century, leverage has become a highly profitable business for "intermediaries." They rarely lose, while the average investor gets their capital burned.
What Is Leverage in Financial Markets?
Leverage is, essentially, a loan.
Saying that "the higher the leverage, the higher the profits and the higher the losses" would simply repeat the usual cliché preached by gurus before sending their apprentices to the slaughterhouse.
To understand what actually happens, we will rely on market logic and use my friend Juan as a laboratory rat.
Juan has watched The Wolf of Wall Street fifteen times and wants to make an honest living as an investor.
The problem is that he only has $100.
No matter how confident he is in his analysis, with such little capital, his absolute returns will be minimal. While a well-capitalized investor may see a 20% return as a golden opportunity, for Juan, 20% on $100 means just $20.
Imagine waiting weeks (or months) to make so little.
Trading platforms — especially in the crypto sector — offer a "solution" for profiles like Juan: leverage.
Thanks to this mechanism, retail investors can multiply their capital through borrowing and turn their $100 into $1,000, $10,000, or more.
The sky is the limit — especially when crypto and deregulation enter the picture.
What Juan doesn't realize is that the larger the loan, the higher the fees and, above all, the greater the probability of losing all his money.
For example, if Juan leverages his $100 at 10x, he enters the market controlling a $1,000 position ($100 × 10).
This is also known as trading with a 10% margin, since his own capital covers only one-tenth of the position ($900 is borrowed).
At 10x leverage, Juan backs a $1,000 position with just $100 of his own money.
If the market moves against him, a relatively small 10% move is enough to wipe out his entire capital.
Both the percentage gains and losses are calculated on the total position size ($1,000), but the losses are not absorbed by the intermediary simply because the money was borrowed. Juan absorbs them with his own $100.
To make matters worse, because Juan is an uninformed investor — like most people — he won't just use leverage "self-taught." He will also place a Stop Loss (SL), which may reduce his probability of success even further.
If he sets a 20% SL on his $100 margin (risking $20), what he is actually doing is giving the asset price barely 2% of breathing room relative to the $1,000 position.
Taking that level of exposure with such a narrow margin against the market's normal noise is less efficient than trying to achieve financial health in a casino.
As you can see, trying to double your capital in a single shot is usually a terrible business.
Markets move through impulses and retracements, and on lower timeframes, volatility and the impact of manipulation multiply.
Try the open-source systems I have given away to the community across different timeframes and you'll know exactly what I'm talking about.
Why do you think scalping courses sell so well, accompanied by aggressive advertising such as:
"Hurry up and get rich for just $20, $30, $100, or $200!"
If the industry promoted consistent long-term growth, the business of selling miracle courses, signal channels, trendy indicators, and subscriptions would collapse.
But let's not pretend we're going to change the world...
Instead, let's look at efficient ways to use leverage under different approaches.
Before that, however, we need to clarify two fundamental concepts: the risk-to-reward ratio and the Stop Loss.
Risk-to-Reward Ratio
This is a tool used to measure the relationship between what we are willing to risk and what we expect to gain from a trade.
• 1:1 ratio: For every unit of risk, we seek one unit of profit. If we risk $10, we aim to make $10; if we risk $100, we aim to make $100.
• 1:2 ratio: For every unit of risk, we seek two units of profit. If we risk $10, we aim to make $20; if we risk $100, we aim to make $200.
Stop Loss (SL)
A Stop Loss is an automatic order programmed into the platform to close a position when the price reaches a predetermined level.
Its purpose is to limit risk.
For example, if we open a $1,000 position but are only willing to lose $300, we place the SL at the exact price level where the loss will not exceed that amount.
This way, we protect the remaining 70% of our capital.
1. Leverage With a 1:1 Risk-to-Reward Ratio (Without Using a Stop Loss)
In this scenario, Juan exposes the entirety of his $100 to the possibility that his analysis is correct.
Since he is not using a Stop Loss (SL), he seeks to make exactly the same amount he is risking: $100.
To achieve this, he first measures the percentage move or volatility between his entry price and his target price using TradingView's Price Range tool . As you can see on the screen, determining this value is very simple.
Let's assume the projected move to the target is 20%.
Juan would apply the following formula:
Leverage = Capital at risk (100% of the account) / % move to target
Substituting the values:
Leverage = 100% / 20% = 5x
This means that if Juan invests his $100 with 5x leverage, he will control a total position of $500 ($100 × 5).
If the asset rises by the projected 20%, he will earn a 20% return on the $500 position — $100 in profit, effectively doubling his initial margin.
However, because he is not using a Stop Loss, his liquidation point is effectively set at the equivalent decline: if the price falls 20%, the $500 position will lose $100 and Juan will lose his entire capital.
2. Leverage Based on the Liquidation Price
In this second example, Juan again risks his entire $100 without placing an explicit Stop Loss.
He wants to increase his potential profits, but this time he prioritizes survival:
Instead of forcing a 1:1 risk-to-reward ratio, he will calculate the leverage necessary to keep his liquidation price far enough away to absorb normal market volatility.
Looking at the chart, Juan determines that it is extremely unlikely for the price to fall 30% from his entry point.
To calculate the maximum leverage he can use without being liquidated before reaching that level, he applies the same logic:
Maximum leverage = 100% / % decline at which we are willing to be liquidated
Maximum leverage = 100% / 30% = 3.33
Juan rounds down to 3x to trade more conservatively.
By reducing leverage to 3x, the liquidation price moves even farther away: the asset would have to fall 33.3% for the broker to close his position due to insufficient margin.
This is a much more sensible use of leverage.
Trading at 3x on a projected 20% upside move, Juan would make $60 (20% of $300).
In exchange, he gives the market room for a 33.3% decline before being wiped out — a scenario his previous analysis considered unlikely.
3. Using Leverage With a Stop Loss (SL)
Case A
In this scenario, Juan is not willing to risk all of his $100.
He only wants to expose 20% of his capital ($20 maximum loss if the trade goes wrong).
This necessarily requires the use of a Stop Loss.
What should he do first?
First, he must determine the technical location where the Stop Loss will be placed. Juan must identify the price level at which his market analysis becomes invalid.
After analyzing the chart, Juan determines that his trade will fail if BTCUSD falls to $53,250.
By marking that level as his invalidation point, he has just defined the exact price at which he is willing to accept his $20 loss.
How do we calculate the leverage allowed based on the risk being assumed?
To avoid risking more than 20% of his margin ($20), Juan must relate his target risk to the percentage distance between his entry price and the Stop Loss:
Allowed leverage = % of capital willing to be risked / % distance to Stop Loss
Let's assume that the distance between his entry price and $53,250 represents a 17% decline in the underlying asset.
Applying the formula:
Allowed leverage = 20% / 17% ≈ 1.18
Result:
Juan can only accept 1x leverage .
This means that, in order to respect his risk management rules and lose only $20 if the price reaches $53,250, Juan should not use leverage.
If Juan wants to maintain the safety of risking only 20% of his capital with a Stop Loss 17% below his entry, he should place his sell order at $53,250 while using 1x.
Case B
Now let's consider a second scenario in which the chart structure offers a closer invalidation level, located at $58,120.
In this case, the distance between the entry price and the Stop Loss is only 10%.
Applying the same risk-management formula:
Allowed leverage = % of capital willing to be risked / % distance to Stop Loss
Allowed leverage = 20% / 10% = 2
Result: The calculation allows Juan to use 2x leverage .
With 2x leverage, Juan enters the market with $200 ($100 of his own money and $100 borrowed).
If the price falls 10% to $58,120 and his Stop Loss is triggered, his $200 position will lose 10%, which equals exactly $20 in losses, respecting his risk limit.
However, if the price rises 20%, Juan will make $40 (20% of $200).
4. Trading Without Leverage
For this final scenario, a more experienced Juan tells us that trading without leverage is the safest and most consistent way to invest because it eliminates the risk of margin liquidation.
However, if Juan's goal is to make a living from the market, he knows that this approach necessarily requires a large amount of capital.
Without leverage, the market's percentage returns translate directly into actual dollar gains without multipliers.
If the capital is small, the absolute gains will be insignificant relative to the cost of living.
In this scenario, there are only two ways Juan could lose all of his money:
1. By his own decision: Closing the position manually at a loss.
2. Through the bankruptcy or collapse of the asset (if Juan does not diversify): If the company declares bankruptcy (stocks), if the project falls to $0 (crypto/tokens), or if the issuer/custodian backing the instrument goes bankrupt (commodities).
The Risk-Management Challenges Juan Faces
Despite having no liquidation risk, trading without leverage still requires managing time and liquidity risk.
A poor entry decision can leave his money tied up for months or even years in a losing position before he can exit at breakeven.
While his capital is trapped, Juan will be unable to take advantage of other major opportunities the market may offer.
To prevent a single frozen position from paralyzing — or destroying — his entire wealth, Juan must diversify his capital across different assets.
This form of capital management can also be implemented in various ways, but I'll talk about those investment tricks another time.
Education