XRP Falling Wedge Breakout? Next Move Target $1.75 and $2.01?CRYPTOCAP:XRP XRP has spent the recent period consolidating after its strong upside move, with price compressing between a descending resistance line and a rising/less-declining support structure.
The current structure can potentially be interpreted as a falling wedge, but the important point is that XRP has repeatedly pushed toward the upper boundary without yet producing a fully confirmed breakout on the chart.
After the previous impulsive move, this type of consolidation can represent a time-based correction or period of rest rather than an immediate bearish reversal. Price has continued to hold above the broader support structure while sellers have struggled to produce a sustained breakdown.
The latest price action is now pushing through the upper resistance area, making the next reaction particularly important.
Technical Structure
The main structure visible on the chart is a potential falling wedge / contracting consolidation.
Price has:
Established a major upside move before entering consolidation.
Repeatedly tested the descending resistance.
Continued to trade above the major support structure.
Recently pushed above the upper wedge boundary.
Marked a potential pullback/support area around $1.34–$1.40.
The breakout should not automatically be treated as confirmed continuation. A successful retest and hold of the breakout area would provide stronger evidence that resistance has shifted into support.
Setup
Timeframe: Not clearly visible on the provided chart
Current Price: Approximately $1.4577
Bias: Bullish while the marked structure remains valid
Entry / Pullback Zone: $1.34–$1.40
Invalidation: $1.20
Target 1: $1.75
Target 2: $2.01
The chart does not provide a precise entry price. The cleaner approach is:
Wait for a pullback and confirmation in the marked zone.
The $1.34–$1.40 area is important because it is the marked Support Zone (Pullback) and provides a better location to evaluate whether buyers are willing to defend the breakout structure.
Why $1.75?
The $1.75 level is explicitly marked on the chart as the Short-Term Target and corresponds to the 61.8% Fibonacci level shown.
If XRP successfully confirms the breakout and begins a sustained continuation, this is the first major upside objective shown in the setup.
Why $2.01?
The $2.01 level is explicitly marked as the Mid-Term Target and corresponds to the 100% Fibonacci level shown on the chart.
This is therefore the larger continuation objective of the setup, rather than an additional target created independently.
Invalidation The marked $1.20 level is the invalidation level.
A decisive move below this area would significantly weaken the bullish structure and invalidate the current setup. At that point, the falling-wedge breakout thesis would no longer have the same technical basis.
Confirmation
I would wait for one of the following before treating the setup as higher probability:
A strong candle close above the descending resistance.
A pullback toward the $1.34–$1.40 zone.
Rejection from that zone with buyers stepping back in.
A successful retest where former resistance acts as support.
Stronger volume on the breakout, if volume confirms the move.
The key is not simply whether XRP trades above resistance intraday. The quality of the breakout and subsequent retest matters more.
Bullish Scenario
If XRP holds the breakout structure and successfully defends the marked pullback zone, the continuation scenario remains active.
The path shown on the chart is:
Breakout → Pullback/Retest → Confirmation → $1.75 → potentially $2.01
A sustained move toward $1.75 would strengthen the case for the larger mid-term objective at $2.01.
Bearish Scenario
The bullish thesis becomes questionable if XRP fails to hold the breakout and falls back into the wedge.
A deeper breakdown, particularly below the marked $1.20 invalidation, would invalidate the current bullish setup.
This would suggest that the consolidation was not simply a pause before continuation and that sellers have regained control.
Risk Management
The main mistake here would be chasing the breakout after an extended move.
The setup offers a more attractive risk framework if price provides a controlled pullback toward the marked $1.34–$1.40 support zone and then confirms buyer participation.
The $1.20 invalidation should remain clearly defined before taking any position. Position size should be determined from the amount of capital one is willing to risk, not from the potential target.
No technical pattern guarantees continuation. The market still has to confirm the thesis.
Save this chart and follow the next update. The key development to watch is whether XRP can turn the breakout area into support and continue toward the marked targets.
Risk Warning : This is a technical setup, not a guaranteed outcome. Wait for confirmation, respect the invalidation level, and never risk more than you can afford to lose.  Long
Long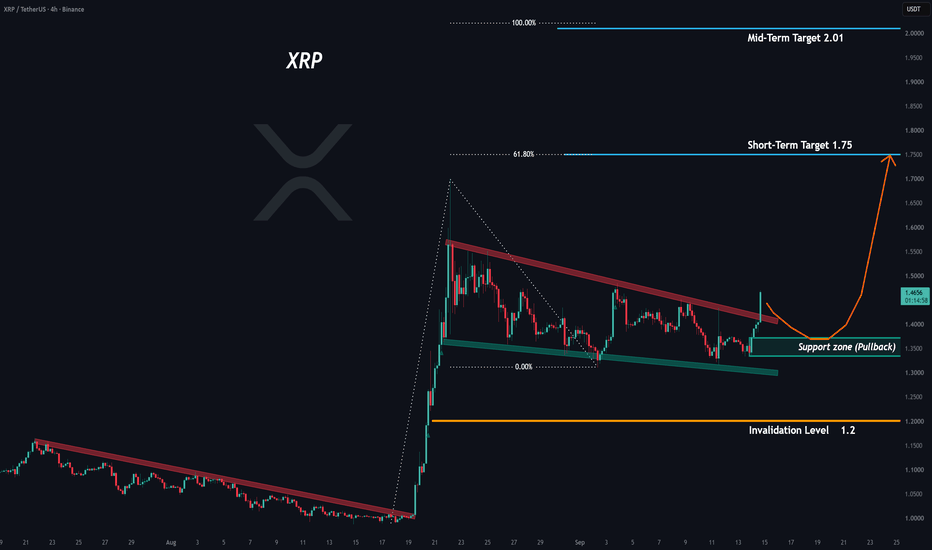
 Short
Short
BTCUSD Here is the complete technical analysis in English, structured around the RTM methodology and the key points you provided:
Technical Breakdown: Bitcoin Drop Analysis via RTM Methodology
The release of the interest rate news injected significant volatility into the financial markets, strongly impacting price action across various assets. Based on the 4-hour Bitcoin (BTC/USD) chart, the anticipated bearish scenario is structurally justified through the RTM (Read The Market) framework as follows:
1. Formation of the Higher Timeframe Cap Pattern
As outlined in the prior updates on September 6th and 12th, price has been constructing a high-timeframe Cap pattern. In RTM concepts, a Cap represents a key institutional supply zone and price ceiling where heavy sell orders absorb buying pressure, preventing further upward continuation.
2. Downside Confirmation (Cap Confirmed)
Following the initial test of the ceiling, price registered a sharp decline toward the lower boundary of the blue box, marked as Cap confirmed. This structural reaction at the bottom validates the Cap zone, confirming that institutional supply at the top remains active and intact.
3. Retest & Order Loading at Breakout Level
After securing the downside confirmation, price initiated a corrective push back up toward the Breakout lvl around $81,250 – $82,000. This upward move is a classic return-to-supply retest, designed to collect and load remaining unfilled sell orders (Order Loading) left behind in the supply zone. Market liquidity generated by the interest rate announcement provided the necessary counterpart for these institutional sell orders to get filled.
4. Execution of the Main Bearish Scenario
With the order loading process near completion at the Breakout level, the overhead liquidity is effectively drained. This sets the stage for the primary downward expansion (indicated by the large blue arrow), targeting key support levels below $76,000 and $74,000.
Conclusion:
While the interest rate news acted as the fundamental catalyst for market liquidity, the structural RTM setup indicates that the rally to $81,250 is merely a liquidity-engineered retest to load remaining sell orders within the Cap. Once fully loaded, the main impulse drop is expected to unfold. Short 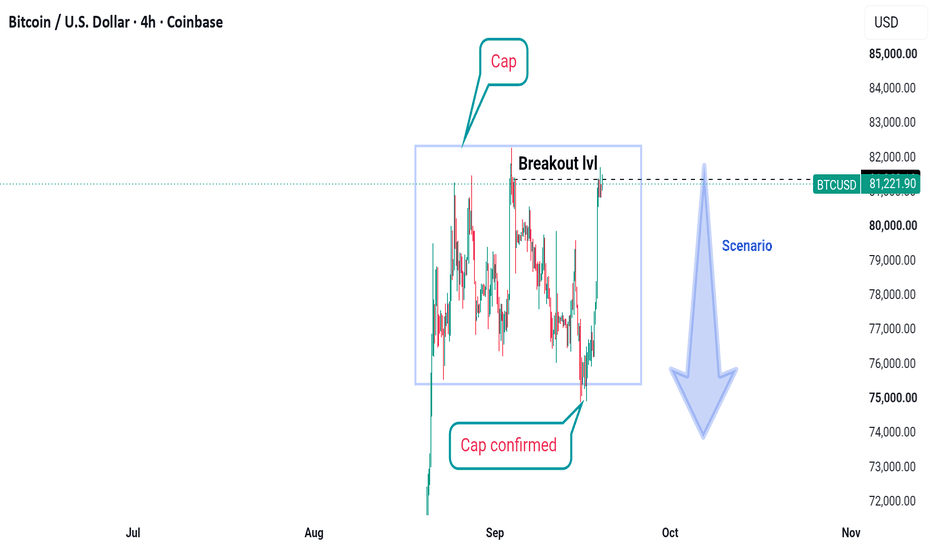
BTC/USD — 2H Technical Analysis | Demand Zone + Liquidity Setup₿ BTC/USD — 2H Technical Analysis | Demand Zone + Liquidity Setup
Exchange: Kraken
Timeframe: 2H
Chart price: ~$81,258
Key resistance: $82,773
Major support: $74,918
📊 Market Structure
BTC has undergone a clear market-structure transition on the 2H chart.
🔴 Previous structure:
Price traded inside a descending channel, producing lower highs and lower lows.
🟢 Current structure:
The market broke above the descending structure and subsequently printed a strong impulsive move from approximately $76K → $81K+.
The marked CHoCH around $79.5K–$79.7K provides an important structural confirmation that short-term control shifted toward buyers.
🟢 Current bias
Bullish while price remains above the $78K–$80K structural area, but BTC is now approaching a significant higher-timeframe supply/demand region.
🔥 1. HIGH-DEMAND ZONE — $80.9K–$82.2K
This is the most important area on the current chart.
BTC is currently consolidating inside this zone after a strong expansion.
📌 What to watch:
Acceptance above $82.2K → could open the way toward the $82.77K resistance.
Repeated rejection inside the zone → increases the possibility of a retracement.
A strong 2H close outside the zone would provide more information than an intrabar wick.
⚠️ The chart specifically marks the possibility of bearish reaction after tapping the higher-timeframe resistance.
🎯 2. MAJOR RESISTANCE — $82,773
$82,773 is the clearly marked horizontal resistance.
This is the key level where the current bullish impulse could encounter significant selling.
Possible reaction structure
BTC → $82.2K → $82.77K → reaction/acceptance
A wick above resistance followed by a close back below it would represent a potential rejection.
Conversely:
🟢 Sustained acceptance above $82.77K would invalidate the immediate rejection thesis and indicate that price is establishing itself above the marked resistance.
🧲 3. FVG — ~$78.4K–$79.9K
The chart contains a large Fair Value Gap (FVG) beneath current price.
This is particularly important because the market moved upward aggressively through this region.
If BTC experiences a deeper retracement, this area becomes a logical zone to monitor for a reaction.
📌 FVG: approximately $78.4K–$79.9K
A return into the FVG does not automatically mean bullish continuation. The reaction inside the zone is what matters.
🏦 4. ORDER BLOCK — ~$78.0K–$78.4K
Immediately beneath the FVG is the marked Order Block.
This creates an interesting confluence:
FVG $78.4K–$79.9K
⬇️
Order Block $78.0K–$78.4K
Therefore, the $78K–$80K region is arguably the most important short-term structural area beneath current price.
If price retraces:
🟢 Hold + bullish reaction → structure remains constructive.
🔴 Breakdown + acceptance below → bullish structure becomes considerably weaker.
🧱 5. MAJOR SUPPORT — $74,918
The chart identifies approximately $74.9K as the major support area.
This is considerably below the current market and represents the larger structural invalidation/reference area shown on the chart.
A move toward this level would mean that BTC has given back a substantial portion of the recent bullish impulse.
🧭 TWO KEY SCENARIOS
🟢 Scenario A — Bullish Continuation
$80.9K–$82.2K demand holds
⬇️
BTC breaks/accepts above $82.2K
⬇️
Test of $82.77K
⬇️
If price establishes acceptance above $82.77K, the current resistance-rejection thesis would weaken.
Confirmation > prediction.
🔴 Scenario B — Resistance Rejection
BTC reaches the $82.2K–$82.77K area and fails to establish acceptance above resistance.
⬇️
Retracement develops.
⬇️
First major area to monitor:
$79.9K–$78.4K FVG
⬇️
Deeper reaction zone:
$78.4K–$78.0K Order Block
⬇️
If those areas fail, attention shifts toward the broader structure around $74.9K.
🧠 PROFESSIONAL READ
The chart currently shows a strong bullish impulse followed by consolidation near a higher-timeframe resistance/demand region.
The important point is that price is at a decision area, not an area where direction should simply be assumed.
🔑 Levels to keep on the chart
Level Role
$82.77K 🔴 Major resistance
$80.9K–$82.2K 🟠 High-demand / decision zone
$79.9K–$78.4K 🟡 FVG
$78.4K–$78.0K 🟢 Order Block
$74.92K 🧱 Major support
👀 WHAT I WOULD MONITOR
1️⃣ $82.77K reaction
Does BTC reject or establish acceptance?
2️⃣ $80.9K–$82.2K consolidation
Is the market accumulating/accepting, or distributing/rejecting?
3️⃣ $79.9K–$78.4K FVG
If price retraces, does the imbalance produce a reaction?
4️⃣ $78K Order Block
Does the bullish structure remain defended?
5️⃣ Volume + candle closes
A wick alone is less informative than a confirmed 2H close and subsequent follow-through. Short 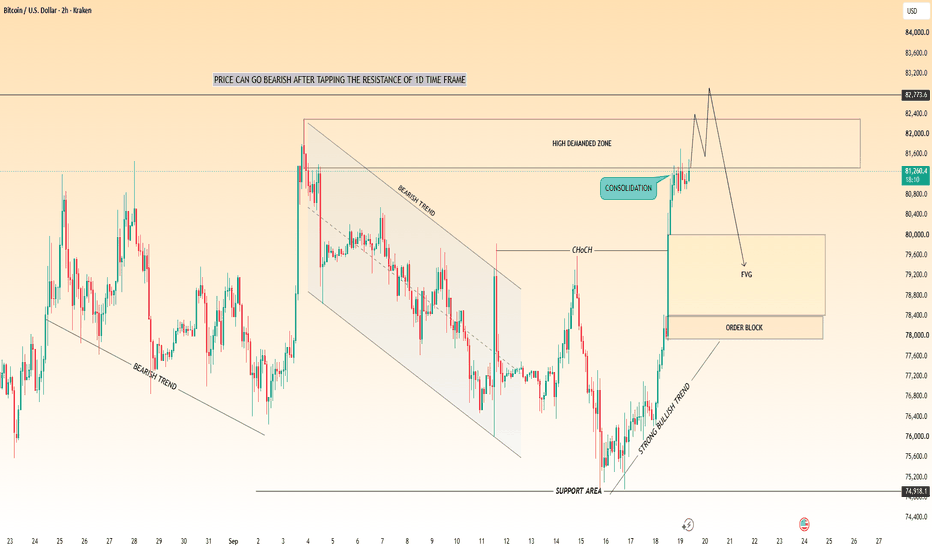
EGLD— Short-Term Setup After the BreakoutEGLD— Short-Term Setup After the Breakout
CRYPTOCAP:EGLD EGLD has finally started to change its short-term structure.
After reacting strongly from an important support zone, price managed to break the key downtrend that had been controlling the previous move lower.
This is the first part of the setup I was waiting for.
The important thing now is not simply that the trendline was broken. I want to see whether buyers can defend the breakout and turn this into a proper higher-low structure.
Trading Setup
Direction: Long
Entry:
Wait for a pullback toward the broken downtrend / support area and look for bullish confirmation.
I would prefer a rejection, liquidity sweep, or clear bullish price action rather than entering simply because the breakout candle is strong.
Invalidation:
Below the recent support / swing low that created the breakout.
If price loses that area and moves back into the previous bearish structure, the setup should be reconsidered.
Target 1: 4.80
Target 2: 5.40
The first target is the initial resistance area. If price reaches it with strong momentum, I would then watch the reaction before expecting continuation toward the second target.
Why I like the structure
The interesting part of this setup is the sequence:
Important support → rejection → downtrend break → potential higher low → continuation
That is much healthier than trying to buy while the downtrend is still intact.
At the same time, this is still a short-term setup.
Breaking a short-term downtrend does not automatically mean that the entire larger trend has reversed. If the market fails to hold the breakout, I would rather step aside and wait for a new structure than force the trade.
Fundamental context
There is also a fundamental development worth keeping in mind.
MultiversX recently activated its Supernova upgrade, with major changes aimed at improving network performance, including much faster block times and improvements to transaction processing and finality.
This doesn't guarantee a higher EGLD price, but it is relevant to the broader network story and shows that development is continuing.
For this trade, however, I would keep the focus on the chart.
The market has already given us the first signal by breaking the downtrend.
Now we need to see if buyers can defend the new structure.
Plan:
Wait for the pullback.
Wait for confirmation.
Define the risk.
Then let the market decide whether the move can reach the targets.
Risk Warning: This is educational market analysis, not financial advice. EGLD and the broader crypto market can be highly volatile. Do not enter without defining your invalidation and position size. Leveraged trading can result in significant losses.  Long
Long
 Short
Short
A drop for EthereumHi!
Structure: ETH is showing a bearish rejection from the 2,550–2,600 area after spending several weeks inside a broad 2,350–2,570 range.
Bearish divergence: The chart marks a divergence around the recent highs, suggesting weakening upside momentum.
Trend: Price is now below the 100 SMA (2,473), which shifts the short-term structure bearish unless ETH reclaims it.
Momentum: RSI is around 36, showing bearish momentum but not yet deeply oversold.
Key support: The highlighted 2,068–2,115 zone is the major downside support/target area shown on the chart. 2,350 is the nearer structural support.
Overall: The chart favors a continued downside move while ETH remains below 2,470–2,500. A break below 2,350 would strengthen the case for a move toward 2,115–2,068. Conversely, reclaiming and holding above the 100 SMA would weaken the bearish setup.  Short
Short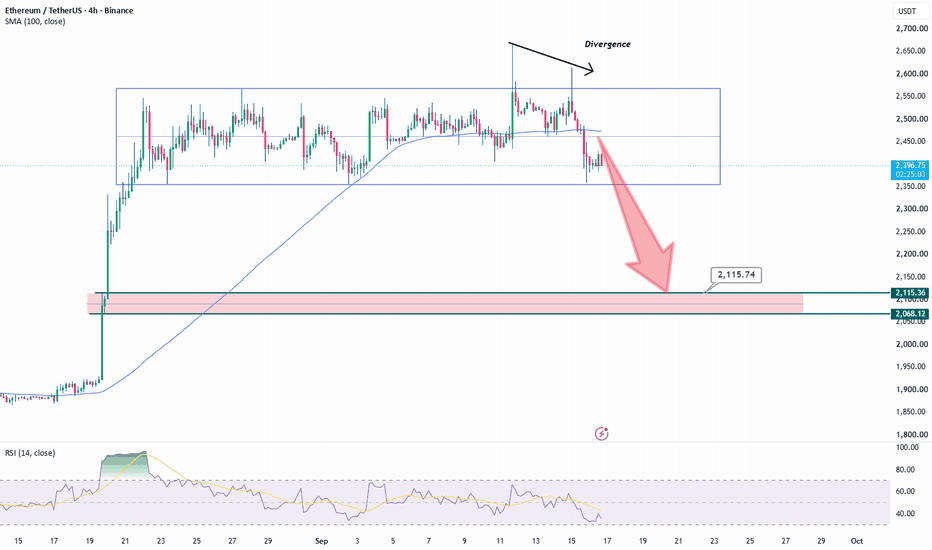
 Short
Short
Ichimoku Cloud: Reading Market Structure Through One IndicatorThe Ichimoku Cloud looks like chart spaghetti at first. Fair enough. Once you know what to watch, though, the Ichimoku indicator puts trend, momentum, support, resistance, and crypto market structure on one chart.
☁️ Start With the Cloud
Ichimoku Cloud explained in plain English: crypto trading above the cloud has a bullish bias. Below it, bears have the upper hand. Inside? Usually chop. Best not to get cute there.
Two Ichimoku components, Senkou Span A and B, build the cloud and plot potential support and resistance ahead of price. A fat cloud can be tough to punch through. A twist can hint at a change in structure. Both are worth watching in Ichimoku Cloud crypto setups.
⚡ Tenkan Sen + Kijun Sen
The Tenkan Sen reacts faster to price, while the Kijun Sen is the slower baseline. Keep an eye on a flat Kijun, too. Price has a habit of drifting back toward it.
Tenkan above Kijun leans bullish; below leans bearish. Still, don’t ape into every crossover. A bullish cross above the cloud carries more weight than one buried in sideways garbage.
A decent Ichimoku strategy needs context. One crossover alone doesn’t cut it.
👀 Chikou Span: Quick Reality Check
The Chikou Span helps weed out sketchy setups. Say Bitcoin is above the cloud, Tenkan holds above Kijun, and Chikou has clear space behind it. Bulls have a much cleaner setup.
Everything tangled together? Pass. No trade is a trade.
₿ Reading Crypto Structure
With Ichimoku Bitcoin, you want the pieces backing each other up. Price, cloud, Tenkan, Kijun, and Chikou moving in sync make trend analysis cleaner and keep bitcoin technical analysis from turning into crossover roulette.
Same idea works outside crypto. On gold, a cloud breakout followed by a Kijun retest can help filter a legit move from a cheap fakeout.
For Ichimoku TradingView setups, the default settings are fine to start with. Read the Senkou Span, Tenkan Sen, Kijun Sen, Chikou Span, cloud, and price as one picture. Chart looks messy? Leave it alone. Crypto will cough up another setup soon enough.
This content is for informational purposes only and does not constitute financial or investment advice.  Education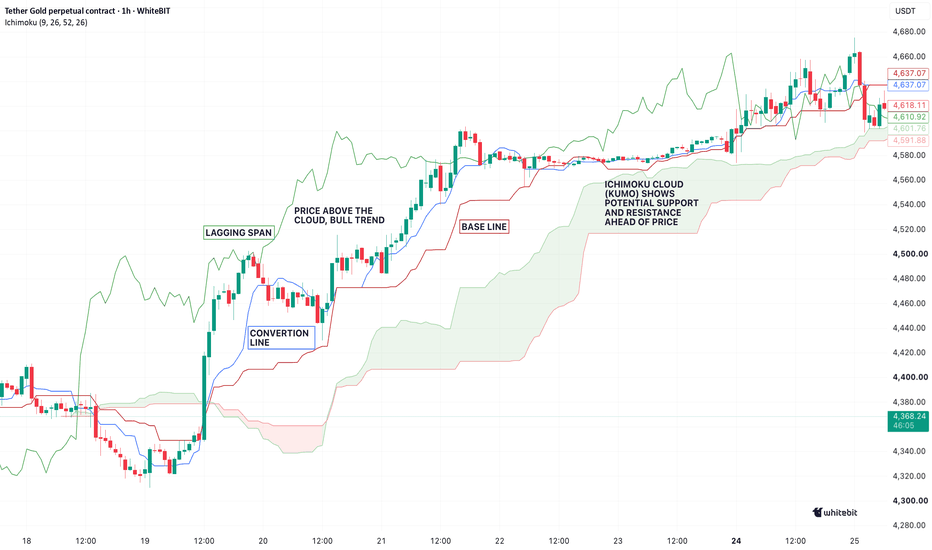
 Long
Long
SUPER — Critical Descending Trendline, Breakout or Rejection?💵 Coin: BSE:SUPER
⌛ Time Frame: 4D
📈 Pattern: Descending Trendline / Downtrend Resistance
💰 Price on Chart: around $0.138
🔻 Trendline Resistance: around $0.14–$0.15 and continuing to decline
🎯 Target Areas: $0.202 → $0.280 → $0.405 → $0.675 → $0.850
---
🔻 Descending Trendline Structure
The chart shows that BSE:SUPER has been moving in a long-term downtrend, with price forming a series of lower highs that can be connected by a descending trendline.
📉 This Descending Trendline is acting as dynamic resistance. Price has experienced several rejections when approaching this trendline, making it an important area for determining whether the bearish structure remains intact or momentum begins to shift.
🔎 At the moment, price appears to be approaching the Descending Trendline again, making this a critical zone to watch.
If price manages to break above and sustain a position above the trendline, the market structure could begin showing a potential change in momentum.
---
🟢 Bullish Scenario
🚀 Bullish Scenario — Descending Trendline Breakout
If BSE:SUPER successfully breaks out above the Descending Trendline, particularly if the 4D candle closes above the trendline, the bearish pressure from the trendline could begin to lose its validity.
📈 After the breakout, attention can shift toward the following horizontal resistance levels:
🎯 Target 1: $0.202
🎯 Target 2: $0.280
🎯 Target 3: $0.405
🎯 Target 4: $0.675
🎯 Target 5: $0.850
💡 The $0.202–$0.280 area represents the first important resistance zone because it is clearly visible as a horizontal resistance area on the chart.
🔥 If momentum continues and these resistance levels are broken one by one, the move toward $0.405, followed by $0.675–$0.850, becomes a technical scenario worth monitoring.
⚠️ The breakout should ideally be confirmed by a 4D candle close, rather than relying solely on a wick breaking above the trendline.
---
🔴 Bearish Scenario
📉 If BSE:SUPER gets rejected again at the Descending Trendline and fails to break out, the bearish structure may remain valid.
🔻 Price could potentially move back toward lower support areas.
⚠️ If price fails to maintain its momentum after the rejection, attention can return to the $0.12–$0.14 area, while losing local support could create room for a retest of the previous low area.
📉 Low on Chart: around $0.0796
If the lower-high and lower-low structure continues, the bullish breakout remains unconfirmed and the Descending Trendline continues to act as the key resistance.
---
🧩 Descending Trendline Pattern Explanation
📐 A Descending Trendline forms when resistance progressively moves lower over time.
Its main characteristics include:
🔻 Lower highs forming progressively
🔻 Sellers maintaining pressure around resistance
🔻 The trendline acting as dynamic resistance
🔻 An upside breakout potentially indicating a shift in momentum
🔻 Repeated rejections potentially maintaining the bearish structure
📌 On the BSE:SUPER chart, price is currently very close to this trendline. Therefore, the price reaction around the Descending Trendline is one of the most important areas to monitor.
---
⚡ Conclusion
📊 BSE:SUPER is currently approaching an important decision zone.
🔴 Rejection: The bearish structure could continue.
🟢 Breakout + 4D close: Could open the possibility of a momentum shift toward $0.202 → $0.280 → $0.405 → $0.675 → $0.850.
🎯 The main focus should not simply be on a wick breaking above the trendline, but on 4D candle confirmation and the ability of price to maintain levels above the Descending Trendline.
⚠️ DYOR — Not Financial Advice. Technical scenarios can change depending on price action and overall market conditions.
#SUPER #SUPERUSDT #SuperVerse #Crypto  Long
Long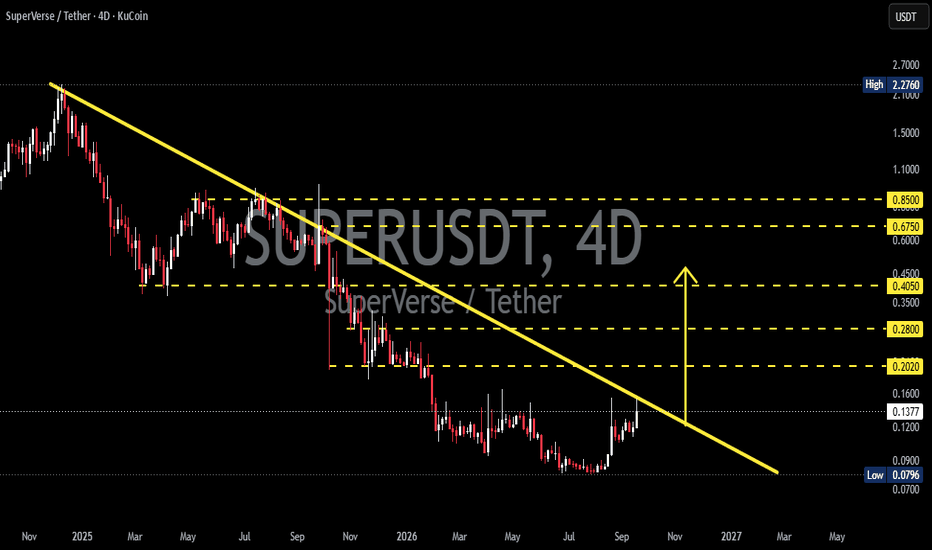
ETH/USD 45M — Bullish Breakout Setup | Key Levels & TargetsETH/USD 45M — Deep Analysis
Current price shown: ~2,626.8. The chart is showing a strong recovery from the 2,375–2,400 area, followed by higher lows and a higher high around 2,640–2,650.
1. Market structure
The structure is currently bullish, but price is sitting directly under a major resistance zone.
2,375–2,400: major swing-low/base
2,450–2,500: structure shifted upward
2,500–2,575: strong impulsive move
2,640–2,650: current major resistance / recent HH
Current consolidation around 2,620–2,630
The important point is that the bullish structure has not yet been invalidated, but the market needs to clear 2,650 to continue higher.
2. Resistance: 2,646–2,650
This is the most important level on the chart.
If a 45-minute candle closes clearly above 2,650, followed by a successful retest, that would provide stronger bullish confirmation.
Potential upside levels from the chart:
TP1: 2,675
TP2: 2,700
If price repeatedly rejects 2,646–2,650, don't chase a BUY at the current price.
3. Support zones
Support 1: 2,600–2,610
This is the nearest area where buyers could defend the current move.
Support 2: 2,575–2,590
More important. A break below this area would weaken the recent bullish structure.
Major support: 2,540–2,560
If ETH reaches this zone, the current short-term bullish structure is under considerably more pressure.
4. BUY setup
The cleaner setup is confirmation rather than immediate entry:
BUY trigger: 45M close above 2,650
Retest: approximately 2,640–2,650
Targets: 2,675 → 2,700
The chart's existing green trade box also points toward 2,675.
5. Bearish scenario
A rejection from 2,646–2,650 followed by a break of 2,600 would change the short-term picture.
Then the next areas to watch are:
2,590 → 2,575 → 2,560
A break below 2,575 would be a stronger warning that the recent bullish impulse is losing structure.
Bottom line
Current structure: bullish, but NOT a confirmed breakout yet.
The two levels that matter most are:
Above 2,650 = bullish continuation confirmation
Below 2,600 = short-term bullish structure weakened
So at 2,626–2,627, I would wait for the 45M confirmation rather than call the current price a guaranteed BUY or SELL. No chart can provide a guaranteed target. Long 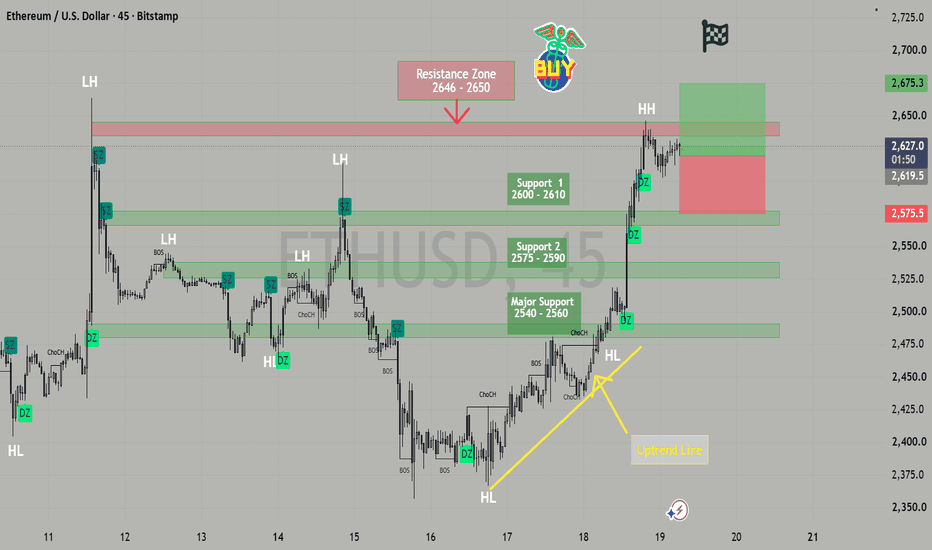
Long 
 Short
Short
BTC/USDT: THE $77,000 SUPPORT RETEST & $78,600 CHANNEL EXPANSION🚀
Testing local retracement near 77,477.49! Are you panic-selling this pullback to rising trendline support, or locked in for the multi-wave bullish rally to the upper channel ceiling? 🤔 Bitcoin is executing a localized pullback within an ascending channel on this 1-hour Binance chart. BTC/USDT is trading around 77,477.49, drifting down toward its lower Support line floor near $77,000.00. Institutional buyers are preparing to sweep sell-side liquidity at this key junction before launching a high-velocity expansion campaign back up toward upper Resistance line supply. Look closely at the black blueprint trajectory mapping out the coming sessions:
• A localized flush pulling price down toward the lower Support line near $76,900 – $77,000 to sweep retail stops and capture buy liquidity. 🧹
• An immediate impulse rebound off support surging back up toward the $77,800 region. ⚡
• A healthy higher-low pullback dipping toward $77,400 – $77,500 to solidify a structural base. 🌊
• A secondary expansion wave breaching intermediate structure to reach $78,100. 🧱
• A minor higher-low consolidation retest dipping back to $77,800 to lock in secondary launchpad support. ⚡
• Final acceleration surge driving straight up to target the upper channel Resistance line ceiling near $78,600.00. 🎯🏹 Maintaining technical discipline and patience remains your ultimate advantage in this setup. Shorting directly above a verified ascending channel support line after a localized dip is a fast track to getting caught in an aggressive short squeeze. Smart money is waiting for this retest at $77,000 to complete before scaling into long position blocks alongside the primary uptrend. 🧘♂️⚡🛠 Trade Parameters:🛒 Long Zone: 76,900 – 77,100 🛍️🛑 Stop-Loss: 1h close below 76,400 ❌💰 Take-Profit: 78,600 🎯The retail bears attempting to short into rising channel support are about to get caught offside as institutional buy volume regains full control. Stay focused, strictly manage your risk, and let the algorithm carry the trade up to our target.Maintain your composure through the waves, and we will see you up at the $78,600 resistance target ceiling! 🚀💎 Long 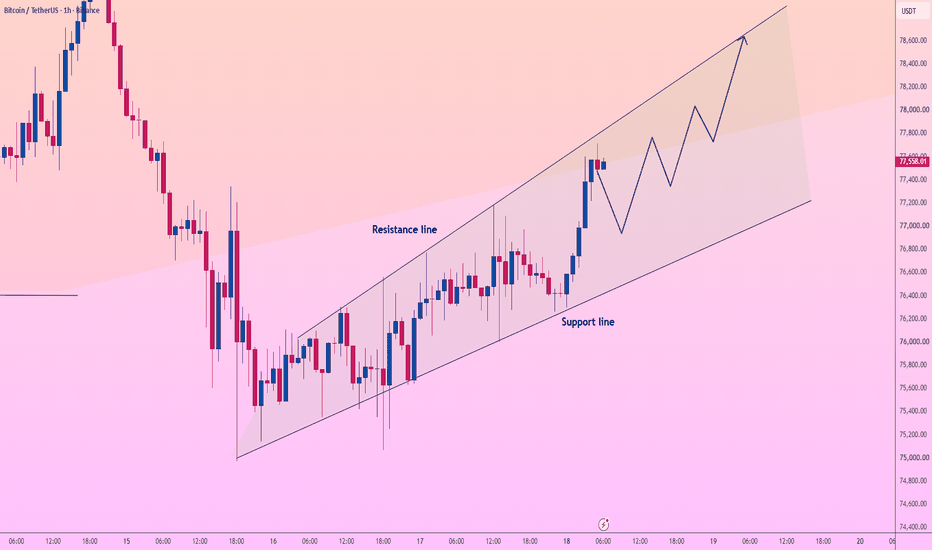
Long 
ONE at a Critical Resistance — Breakout or Rejection?💵 Coin: GETTEX:ONE / USDT
⏳ Time Frame: 3D
📉 Pattern: Descending Trendline
🎯 Key Resistance: 0.00270 – 0.00330 USDT
🎯 Next Resistance: 0.00400 – 0.00450 USDT
🚀 Target Area: 0.00590 – 0.00925 USDT
---
📉 Descending Trendline Structure
🔻 The chart shows a long-term bearish trend that has been developing since the peak around 0.0485 USDT.
📉 The yellow line represents the Descending Trendline, connecting a series of lower highs. As long as price remains below this trendline, the bearish structure remains dominant.
⚠️ However, price is currently approaching an important area around 0.00205–0.00270 USDT, while the price structure is beginning to show potential signs of a momentum shift.
💡 A Descending Trendline often represents an important decision area: rejection can continue the downtrend, while a breakout and confirmation above the trendline can open the possibility for a stronger recovery.
---
🟢 Bullish Scenario
🚀 Key confirmation: GETTEX:ONE successfully breaks and closes strongly above the Descending Trendline.
📈 If the breakout is confirmed, the following resistance levels should be monitored progressively:
🎯 0.00270 USDT
🎯 0.00330 USDT
🎯 0.00400 USDT
🎯 0.00450 USDT
🎯 0.00590 USDT
🎯 0.00925 USDT
🔥 If momentum continues to strengthen and price manages to hold above the breakout area, the long-term bearish structure could begin transitioning into a recovery phase.
🚀 The 0.00590–0.00925 USDT area becomes an important zone because it represents historical resistance levels highlighted on the chart.
---
🔴 Bearish Scenario
⚠️ If GETTEX:ONE is rejected at the Descending Trendline, the breakout cannot yet be considered valid.
📉 If price fails to hold the 0.00205 USDT area, selling pressure could increase again.
🔻 In this scenario, the lower-high + lower-low structure remains valid, and the bearish trend could continue.
🚨 A breakdown of key support could expose the price to another test of the previous low area around 0.00056–0.00070 USDT.
---
🧠 Conclusion
📊 GETTEX:ONE is approaching an interesting technical area as price confronts a long-term Descending Trendline.
🔴 Bearish: Rejection from the trendline → bearish pressure remains dominant → support areas could be tested again.
🟢 Bullish: Breakout + candle close above the trendline → momentum confirmation → resistance levels from 0.00270 to 0.00925 USDT become the areas to watch.
⚠️ Key factor: Do not rely solely on a wick breakout. A confirmed candle close and the ability to hold above the trendline will be important for validating the breakout.
#ONE #Harmony #ONEUSDT #Crypto  Long
Long
 Long
Long
Long 
$KAS | 4H | BUY SETUP |While retail abandons this BlockDAG giant because it is down 84% from its ATH, the 4-hour chart is setting up a textbook order block retest with an asymmetric 1:3.10 risk-to-reward ratio. 🚨
Current Structure:
Price: $0.032799
Reaction: Retraced -17.01% from its local high of $0.039523 on Sep 10, following a massive +43.72% rally from its early September bottom ($0.027500).
Pattern: Bullish Order Block Retest.
Bias: Strongly bullish as long as the $0.030451 key level holds.
"The Level That Decides Everything":
The $0.032242 - $0.030451 Buying Order Block. Bids are queued at the $0.032322 entry price. If this demand zone holds on a retest, it clears the way for a macro-reversal back to local peaks. A 4h close below $0.029822 invalidates the setup.
Targets: Target 1 at $0.035307, Target 2 at $0.040072 (sweeping local highs).
The Move So Far:
Down 17.01% from its local high of $0.039523. On the macro scale, CSE:KAS is down 84.38% from its $0.210000 All-Time High (Aug 2024) and up +19,069.49% from its $0.0001711 All-Time Low (May 2022)
Fundraising Breakdown:
.Total Raised: $0 (Genuine fair launch with no ICO, no presale, and no insider pre-allocation)
.VC Funding: $0. No venture capital backing, no private rounds, and no seed investors
ICO/IEO Entry Prices:
No public or private token sale ever conducted
. Coins are only issued via open Proof-of-Work mining, meaning there are zero early pre-sale buyers waiting to take profit on retail
Unlock Pressure Ahead:
Locked Supply: 0% locked. No team vesting cliffs, no founder allocations, and no advisor unlocks
Emission Schedule: Capped supply at 28.7 Billion KAS
. Over 96% of the supply has already been mined
. Emissions decline smoothly each month by a factor of (1/2)^(1/12) (implementing a monthly-reducing geometric halving curve)
Key Levels:
Resistance 1 / Resistance 2: $0.035307 / $0.040072
Entry: $0.032322 (inside Order Block)
Support (range): $0.032242 - $0.030451
Invalidation / Stop Loss: $0.029822
Closing Thesis:
CSE:KAS remains the absolute gold standard for decentralized, fair-launch Layer-1s. It is completely free from VC dumping pressure, with 96% of its supply already fully circulating. Technically, the 4-hour retest of the green order block offers a highly favorable 1:3.10 risk-to-reward ratio. If $0.030451 holds, the path to $0.040072 is wide open. Below it, the story flips. 🎯
Bullish above $0.030451. Below it, the story flips.
Not Financial Advice. ALWAYS DYOR.  Long
Long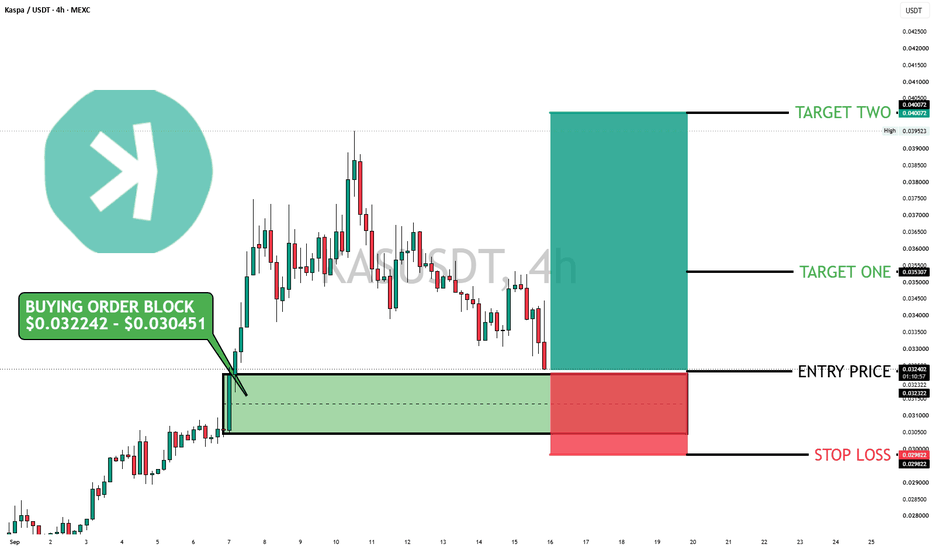
 Long
Long