ETHUSDT Analyses-38, September 16, 2026Welcome to my page! I share daily technical analyses of crypto and other charts here.
BINANCE:ETHUSDT
💡Market Analysis:
ETH remains under short-term bearish pressure, but price is now reacting from the 2373 support zone and trying to stabilize above the 2400 area. The current setup is a potential long scenario only if price confirms the reclaim of the trigger zone around 2406 with a strong bullish candle body above 80%, or breaks out and then holds the level on a clean pullback.
If that confirmation appears, the first upside objective is the 2501 resistance. After that, the next important levels are 2570 and 2630. On the other hand, if price loses the 2380-2373 support area, the long setup becomes weak and invalidation is triggered.
As with my previous signals, I treat the marked solid and dashed levels as trigger zones, not automatic entries. Confirmation always comes first, then execution with controlled risk.
Key Support & Resistance:
Key Resistance: 2501 / 2570 / 2630
Key Support Area: 2400 / 2380-2373
🎯 Trade Entry & Exit Plan:
Entry : Breakout/Pullback of trendline or key zones with >80% candle body confirmation around 2406.
Stop Loss : Below the last support wave and the marked invalidation area, around 2380.
Take Profit : First target 2501. Further targets 2570 and 2630. Secure profits from R:R 2 and above.
⚠️Risk Management:
Maximum 1% risk per trade.
❤️Follow me for more: @EhsanZeydabadi  Long
Long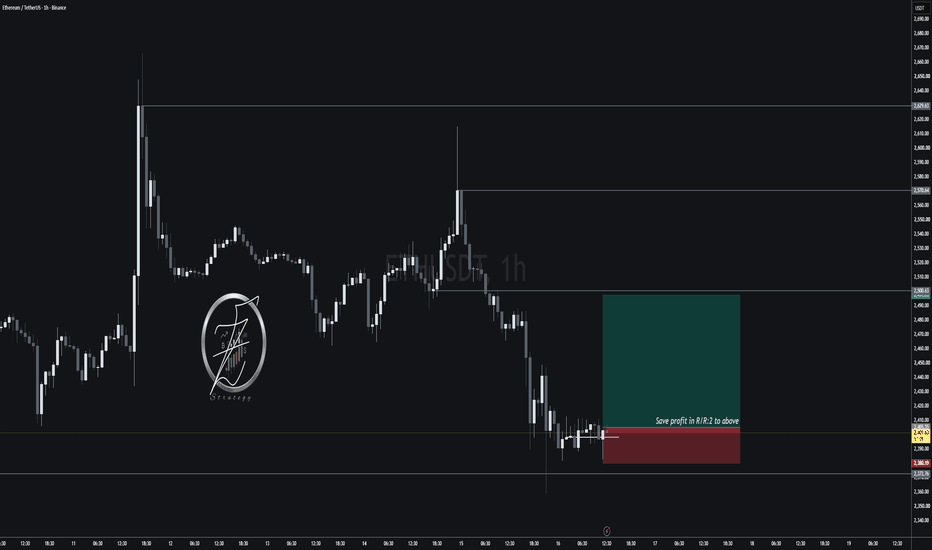
BTCUSD | Strong High, Supply Zone & Downside TargetsThis analysis focuses on candle behaviour, market structure, liquidity, MSS, BOS, supply/demand and key levels. Each major candle sequence is interpreted according to its location and reaction, rather than treating every candle as an isolated signal.
1 Initial Bullish Expansion — 2026 Start
The early candles show bullish momentum, with buyers progressively pushing price into higher levels. Consecutive bullish candles and higher highs indicate that demand was controlling the short-term structure.
The candles that leave lower wicks show that sellers attempted to push price down but were absorbed by buyers.
2️⃣ 96K–98K — Liquidity & Supply Reaction
As price reached the upper supply zone, candles started showing rejection. The long upper wicks indicate that buying pressure was being met by significant selling interest.
The following bearish candles confirmed that price was unable to sustain the highs.
Reason: price reached a major HTF supply/liquidity area and sellers became active.
3️⃣ Bearish Displacement
The large bearish candles following the high represent strong bearish displacement. Instead of a normal pullback, price broke several previous swing lows.
This created the first important MSS, followed by bearish continuation.
Reason: previous bullish structure was invalidated and sellers gained control.
4️⃣ Consolidation Around 60K–65K
After the sharp decline, candles became smaller and more balanced. Several upper and lower wicks appeared around the 60K–64K region.
This behaviour suggests consolidation and liquidity accumulation rather than a clean directional trend.
The repeated reactions from the lower area established the HTF Demand Zone.
5️⃣ MSS & BOS — Recovery Phase
Once price began producing higher lows, a bullish MSS appeared. Subsequent bullish candles broke previous swing highs, confirming BOS.
The larger bullish candles show displacement, while the smaller bearish candles represent pullbacks into areas where buyers were able to defend price.
6️⃣ 64,323 Demand Zone
The 64,323 area is an important structural support/demand level.
When price returned toward this area, candles showed rejection and buyers stepped in. The resulting bullish displacement helped establish the upward move toward the current 77K–82K region.
7️⃣ Rally Toward 82,167
The strong bullish candle sequence from the demand area shows aggressive buying pressure.
As price approached 82,167, momentum started slowing and upper wicks appeared. This is important because 82,167 is marked as the Strong High / Buy-Side Liquidity area.
8️⃣ Liquidity Sweep Near the High
The candles around the recent high show price moving into the upper liquidity area before rejecting.
A sweep alone is not confirmation of reversal. Confirmation comes from subsequent bearish displacement and a structural break.
9️⃣ Current 77K–78K Area
Price is currently consolidating around the 77,700–77,800 region. The smaller candles and repeated wicks indicate indecision after the previous bullish expansion.
The grey OTE/decision area should therefore be treated as an area of interest rather than an automatic entry.
🔻 Bearish Scenario
If bearish candles produce a confirmed break below 75,810, the next areas of interest become:
75,810 → 69,042 → 64,323
A strong daily close below a level is more meaningful than a temporary wick.
🔼 Bullish Scenario
If buyers regain momentum and price produces a confirmed breakout above 82,167, the next major liquidity/resistance area is around:
82,167 → 90,269
A breakout followed by a successful retest would provide stronger structural confirmation than simply touching the level.
🧠 Candle Reading Summary
Large bullish candles: bullish displacement / aggressive buying.
Large bearish candles: bearish displacement / aggressive selling.
Long upper wick: rejection or buy-side liquidity sweep.
Long lower wick: rejection or sell-side liquidity sweep.
Small-body candles: consolidation/indecision.
Bullish candle after demand: potential buyer response.
Bearish candle after supply: potential seller response.
BOS: continuation of the established structure.
MSS: potential change in market direction.
Sweep + displacement: stronger confirmation than a sweep alone.
📌 Key Levels
98K–96K: HTF Supply
90,269: Major Resistance / Liquidity
82,167: Strong High / Buy-Side Liquidity
77,737: Key Decision Area
75,810: Key Support
69,042: Downside Liquidity Target
64,323: HTF Demand
Important: This is a technical market-structure analysis, not a guaranteed prediction or financial advice. Trade decisions should be based on confirmation, defined invalidation and appropriate risk management.  Short
Short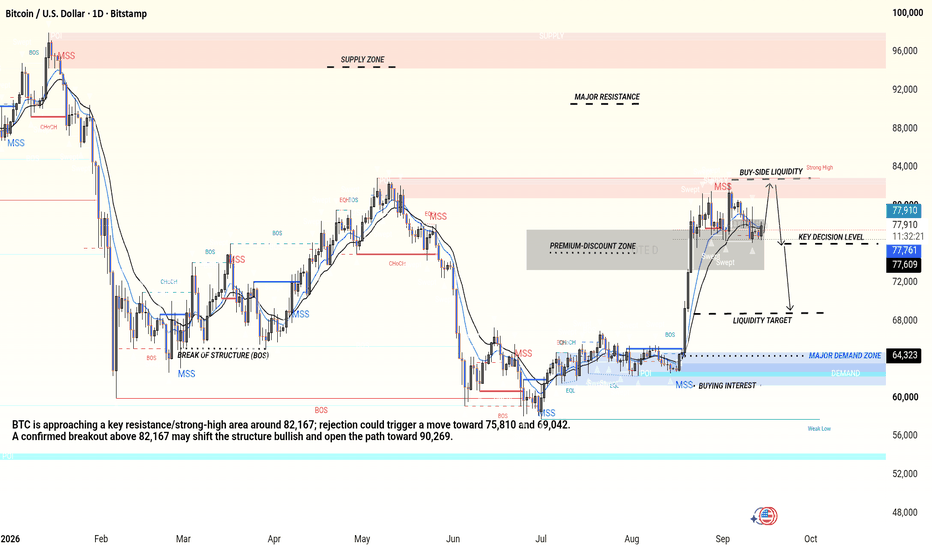
Long 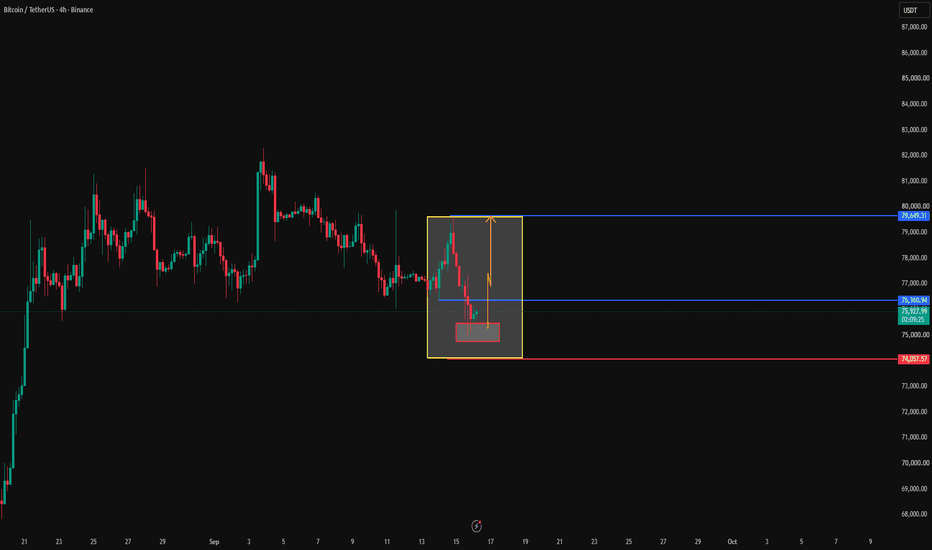
BTC Broke 76,030 And Swept To 74,887.BTC Broke 76,030 And Swept To 74,887.
Bitcoin lost the range it had held all week, taking out 76,030 and running down to 74,887 - within about 700 of the 74,182 structural floor - before recovering to 76,027 this morning. That is the range break the last four sessions were building toward, and it resolved down. Price is now back at the level it broke, testing it from beneath. The 4H carries volatility at the 98th percentile of its range with a swept low and an active compression flag on the same bar, which is what the end of a fast move usually looks like rather than the middle of one. Neutral.
Resistance: 76,237 - the recent low, now overhead
Key resistance: 78,028 - the line that capped the range
Current price: 76,027
Support: 74,887 - this week's low
Key support: 74,182 - the structural floor
Structural floor: 73,571 - deeper support
Two paths from here:
It fails at 76,030 and works back toward the low. Rejection here confirms the broken range low as resistance and puts 74,887 back in play, and a close beneath that finally opens 74,182 - the level this structure has been pointing at since the highs failed.
It reclaims 76,237 and the break becomes a sweep. Getting back above the recent low would make the flush a liquidity grab rather than a trend leg, though the range does not actually repair until 78,028 is back overhead.
Both ends of this range have now been swept and the low end broke first. 76,030 decides whether that break holds.
Built with SYNTHESIS v3.3 | SOM / ACE / IMP / SYNTHESIS
Study, not financial advice. The Timeline Broke, Not the Crypto Thesis
Ahead of the Fed Decision
Bitcoin has just absorbed one major shock and is about to face another: **the CLARITY vote failed, and the Fed decides in hours.**
On September 15, the U.S. Senate failed to invoke cloture on the motion to proceed to the Digital Asset Market Clarity Act. The official vote was **49–50**, below the 60 votes needed to advance the legislation. This was a procedural failure to move the bill forward, not a final vote rejecting the bill itself.
That distinction matters.
Near-term regulatory certainty has been pushed further out. But one failed procedural vote does not, by itself, invalidate the longer-term case for digital assets.
The market reaction helps show what was actually repriced.
## The Relative Damage Tells the Story
Bitcoin fell about 4% after the Senate setback.
Coinbase and Circle fell roughly 9% — about twice as much.
That relative performance is important.
If this were primarily a crisis of confidence in Bitcoin itself, Bitcoin should be at the center of the damage.
Instead, assets with much greater exposure to U.S. regulatory outcomes were hit harder.
That suggests at least part of the selloff was a **regulatory-premium adjustment**.
For months, markets had increasingly priced in the possibility that comprehensive U.S. crypto rules were getting closer. When that timeline suddenly became less certain, companies whose business models depend heavily on U.S. regulatory clarity absorbed the larger shock.
Bitcoin was pulled lower with them.
But the Bitcoin network itself did not change because of the Senate vote.
So the real question is not whether CLARITY was bad news. It clearly was for the near-term policy timeline.
The question is whether the market is simply repricing that expectation — or beginning a broader structural breakdown.
## Regulation Has Slowed, Not Stopped
Near-term congressional passage is now significantly more difficult.
But the regulatory process has not returned to zero.
The SEC proposed **Regulation Crypto Assets** in August, creating a tailored framework for certain investment contracts involving crypto assets. SEC Chair Paul Atkins has also said congressional legislation remains important for establishing more durable rules.
So there are still two separate tracks:
**Congressional legislation has slowed.
Administrative rulemaking continues.**
That does not guarantee CLARITY — in its current form or another form — will pass on any particular timetable.
It simply means the Senate setback should be understood mainly as a delay in regulatory certainty, not evidence that the entire U.S. regulatory direction has reversed.
For markets, timing matters.
But timing and direction are not the same thing.
## The Fed Is the Second Test
**The FOMC decision lands in hours. Markets are pricing a 25bp hike. What matters is what comes next.**
The Fed releases its decision at **2:00 p.m. ET**, followed by Chair Kevin Warsh's press conference at **2:30 p.m. ET**.
Markets currently assign roughly a **93% probability** to a 25-basis-point increase, taking the target range to **3.75%–4.00%**.
Because the hike itself is heavily priced, the bigger variables are:
* whether policymakers signal further tightening this year;
* how concerned they remain about inflation;
* how the Fed treats elevated energy prices;
* and whether Warsh keeps future policy data-dependent or signals a more persistent hiking cycle.
This matters because Bitcoin is not dealing with the CLARITY setback in isolation.
The market is simultaneously removing regulatory optimism, reducing leverage and preparing for tighter monetary policy.
That combination can produce a much larger short-term move than any single headline.
## Is This a Constructive Reset?
It is too early to call the current decline a bottom.
A constructive reset has to produce evidence.
Over the next **48–72 hours**, four things matter.
### 1. Bitcoin Stops Making Impulsive New Lows
Bitcoin does not need an immediate V-shaped recovery.
But once the FOMC reaction has been fully absorbed, continued aggressive new lows would weaken the reset interpretation.
Stabilization matters more than the first rebound.
### 2. Regulatory-Sensitive Assets Stop Underperforming
Coinbase and Circle were hit roughly twice as hard as Bitcoin in the initial reaction.
If that gap begins to narrow, it would suggest much of the regulatory premium has already been removed.
If the gap keeps widening, the repricing is probably not finished.
### 3. Leverage Cools Without Another Disorderly Flush
A healthy reset removes crowded positioning and allows the market to rebuild from a cleaner base.
Cooling leverage followed by stable prices would be constructive.
Weak prices combined with rapidly rebuilding leverage would not.
### 4. Bitcoin Absorbs the Fed
The first move after an FOMC announcement is often noisy.
The better signal comes after the statement, projections and press conference have all been digested.
If Bitcoin can absorb both the regulatory disappointment and the Fed without starting another impulsive leg lower, the constructive-reset argument becomes much stronger.
If it cannot, the correction probably has further to run.
## What Matters From Here
The CLARITY vote changed something real:
**the path toward near-term U.S. regulatory clarity became harder.**
But the market now has to determine how much of that disappointment was already priced during the selloff — and whether the Fed adds a second layer of pressure.
For short-term traders, the next 48–72 hours matter more than the last 48.
Watch price stabilization, relative performance, leverage and the post-FOMC reaction.
For longer-term investors, the more important question is different:
Are institutional participation, regulatory development and the integration of digital assets into the financial system actually reversing?
One failed procedural vote is not enough evidence to answer yes.
The current move therefore deserves respect, but not an automatic conclusion that the broader crypto thesis has failed.
**By tomorrow we'll know whether this is a one-punch or two-punch correction.**
**Today, the evidence says the timeline broke, not the thesis.**
Long 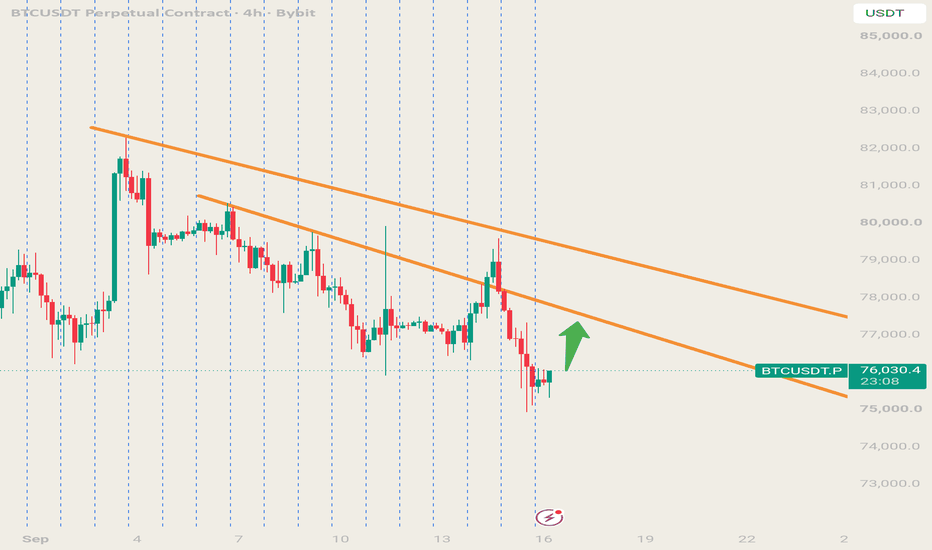
 Long
Long
 Long
Long
Short 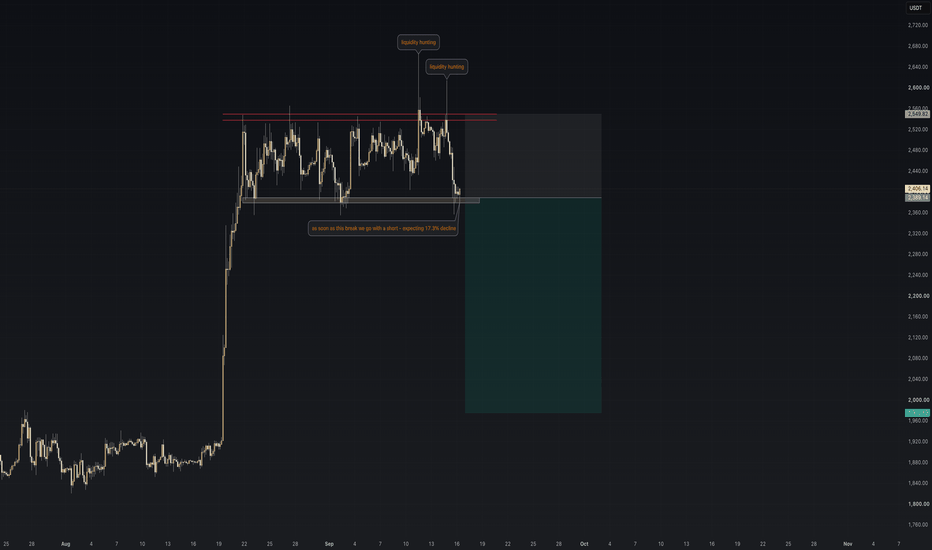
ETH/USD 2H — Professional Technical Analysis📊 ETH/USD 2H — Professional Technical Analysis
🟢 Current Price: $2,480.87 | Coinbase | 2H
Market structure: Neutral-to-bearish in the short term, with price currently testing an important demand/liquidity area.
🧭 1. Overall Market Structure
ETH has transitioned from the previous bearish descending channel/trendline into a broader sideways consolidation.
The bearish trendline was broken around Sept. 4, giving buyers temporary control. 📈
Price subsequently established a range roughly between $2,420–$2,550.
A strong upside liquidity sweep pushed ETH toward $2,660, but that move was aggressively rejected. ⚠️
Since that rejection, price has been making a short-term sequence of lower highs, indicating weakening bullish momentum.
Current bias: 🟠 Neutral → Bearish
The key question now is whether the $2,420–$2,460 demand zone holds.
🟩 2. Demand Zone
$2,420 – $2,460
This is the most important area immediately below current price.
Price has repeatedly reacted around this region, making it a significant decision zone.
Bullish reaction:
If ETH holds this zone and produces a strong 2H bullish rejection:
$2,480 → $2,520 → $2,550 → $2,610 → $2,667
🚀 A reclaim of $2,550 would significantly improve the bullish structure.
Bearish reaction:
If ETH loses $2,420 with a convincing 2H close:
$2,400 → $2,355
This would confirm that the demand zone has failed.
💧 3. Liquidity Zone
The chart identifies liquidity around:
$2,405 – $2,430
This is particularly important because price could first dip into this area to collect sell-side liquidity before deciding on direction.
A wick below $2,420 followed by a rapid reclaim would be a potentially bullish liquidity sweep. 🧲📈
Conversely, sustained trading below the zone would favor continuation lower.
🔴 4. Major Resistance
$2,667.59 — Major Resistance
This is the dominant resistance marked on the chart.
ETH previously made a sharp move toward this area and was rejected.
Therefore:
$2,550 → $2,610 → $2,667
are the major upside obstacles.
A clean 2H breakout and acceptance above $2,667 would invalidate the current bearish scenario and potentially signal a new bullish expansion.
🚀 Above $2,667 = bullish breakout territory
🟢 5. Major Support
$2,355.67 — Major Support
This is the major structural support shown on the chart.
If the $2,420–$2,460 demand zone fails, this becomes the next major downside objective.
📉 Potential bearish path:
$2,480
↓
$2,430
↓
$2,400
↓
$2,355
🎯 6. Key Scenarios
🐂 BULLISH SCENARIO
Condition: ETH holds $2,420–$2,460 and reclaims $2,500–$2,520.
Targets:
🎯 $2,520
🎯 $2,550
🎯 $2,610
🎯 $2,667
The strongest confirmation would be a 2H close above $2,550, followed by successful retest.
🐻 BEARISH SCENARIO
Condition: ETH fails to hold $2,420 and closes decisively below the demand zone.
Targets:
🎯 $2,400
🎯 $2,355
Potentially lower if $2,355 breaks.
The chart's projected bearish move toward support therefore makes technical sense as a scenario, but it is not confirmed until the demand zone breaks.
⚠️ 7. What I Would Watch Now
Level Importance Interpretation
$2,667 🔴 Extreme Major resistance
$2,610 🔴 High Upside rejection/breakout level
$2,550 🟠 High Short-term bullish confirmation
$2,500 🟡 Medium Psychological/structure level
$2,460 🟢 High Demand-zone upper boundary
$2,420 🔴 Very High Demand-zone breakdown trigger
$2,400 🔴 High Liquidity/support
$2,355 🟢 Major Structural support
🧠 Professional Verdict
ETH/USD 2H: 🟠 NEUTRAL-BEARISH
ETH is currently sitting above an important demand/liquidity area, so chasing shorts directly at ~$2,480 carries less favorable positioning than waiting for confirmation.
The cleanest read is:
🟢 Hold $2,420–$2,460 → bullish reaction possible toward $2,550+
🔴 Break $2,420 → bearish continuation toward $2,400/$2,355
🚀 Break & hold $2,667 → major bullish structure shift
The $2,420–$2,460 zone is the battlefield. Until ETH either decisively rejects from it or breaks beneath it, the chart remains in a consolidation/decision phase rather than a confirmed directional trend.
TradingView-style idea: 📌 “Wait for confirmation at liquidity; don't predict the move—trade the reaction.”
Educational technical analysis only, not financial advice. Short 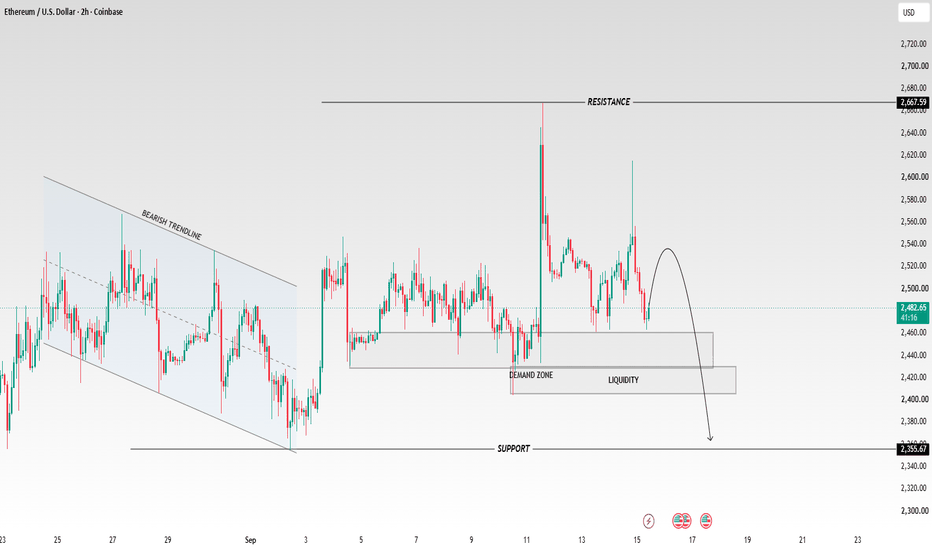
BTC: Why the 50W SMA Rejection May Lead to One Final Cycle LowBitcoin has reached one of the most important technical decision points of the current cycle.
The recent recovery brought price directly back into the 50 week simple moving average, but so far BTC has failed to establish a convincing reclaim. Instead, the reaction is beginning to look like a rejection.
This matters because the 50W SMA has one of the strongest historical track records as a simple Bitcoin bull and bear market filter.
At the same time, several momentum indicators are already showing conditions normally associated with major bottoms. That may sound contradictory, but it is not. Momentum capitulation and time based capitulation measure two different parts of the bottoming process.
Momentum says Bitcoin may be close.
Time still says the market may not be finished.
This analysis is a continuation of my two previous cycle studies:
BTC: The October–November Bottom Window
Bottom in October? Time, Trend, Valuation & Momentum Say Not Yet
In both analyses, my conclusion was not that Bitcoin was far away from a bottom. It was almost the opposite. BTC appeared to be entering the later part of the bear market, but time, trend, valuation and momentum had not fully aligned.
The latest test of the 50W SMA gives us another important piece of that puzzle.
1. The 50W SMA as a Bitcoin Market Regime Indicator
Chart:
The 50W SMA is not designed to identify the exact top or bottom. It is a lagging indicator, and that is precisely why it is useful.
Its purpose is to filter out short term noise and show which side of the broader market structure Bitcoin is trading on.
Historically, the framework has been relatively simple:
• BTC holding above the 50W SMA has generally been associated with bull market conditions.
• BTC trading below it has generally been associated with bear markets or major corrective phases.
• Failed attempts to reclaim it have often been followed by renewed downside.
• A decisive reclaim, followed by acceptance above the average, has often marked the transition back toward a stronger bullish regime.
The chart shows how important these transitions have been across several Bitcoin cycles. The 50W SMA has repeatedly separated periods of sustained expansion from periods where rallies were eventually sold.
It is not perfect, and no moving average is. There have been temporary breaks, wicks and false signals. This is why I do not treat a brief move above the line as confirmation.
The important signal is acceptance.
A proper bullish reclaim should ideally include a weekly close above the 50W SMA, continued strength during the following weeks and a successful retest where the average begins acting as support.
We have not seen that yet.
2. The Current Test Looks More Like Rejection Than Reclaim
BTC rallied back toward the 50W SMA, but the move did not produce enough momentum to establish price above it.
Instead, buyers lost strength around the exact area where the broader trend needed to change. Price is now trading back below the moving average, leaving it as overhead resistance.
That does not prove that Bitcoin must move lower.
BTC can consolidate below the average and make another breakout attempt in the coming days or weeks. A failed first attempt does not make a future reclaim impossible.
However, if historical behaviour is given meaningful weight, the current setup clearly favours caution.
In previous bear markets, rallies into the 50W SMA often looked convincing on lower timeframes. Sentiment improved, momentum indicators recovered and traders began positioning for a new bull run.
But when price failed to reclaim the average on a weekly basis, the rally frequently turned out to be another bear market rally rather than the beginning of a new cycle.
The distinction is therefore not whether BTC can briefly trade above the line.
The real question is whether the market can close above it, remain above it and turn it into support.
Until that happens, I still consider the broader market structure bearish.
3. The Current Price Structure Resembles October 2025
Comparison chart:
The lower timeframe structure adds another reason for caution.
The current formation has several similarities to the structure seen in October 2025:
• A strong initial impulse into a major resistance area.
• Consolidation inside a relatively tight range.
• Several attempts to break the upper boundary.
• Failure to hold above resistance.
• A lower high forming as momentum begins to weaken.
• Price gradually returning toward the lower part of the range.
In October 2025, the market initially appeared to be consolidating after a strong advance. Buyers repeatedly challenged resistance, but each attempt produced less follow through.
Once the lower boundary of the range failed, the structure resolved sharply to the downside.
The September 2026 structure is not identical, but the sequence is remarkably similar.
This does not mean the same outcome is guaranteed.
Similar price structures can produce different results, especially when liquidity and macroeconomic conditions are different.
The comparison only becomes actionable if the current range breaks down.
If BTC loses the lower boundary, fails to reclaim it and forms another lower high, the October 2025 comparison becomes much more relevant. It would suggest that the current consolidation was distribution beneath the 50W SMA rather than accumulation before a breakout.
If the lower boundary holds and BTC subsequently reclaims both the range high and the 50W SMA, the comparison loses its value.
Confirmation matters more than resemblance.
4. Momentum May Be Bottoming Before Price
This is where the analysis becomes more nuanced.
As explained in my previous October–November bottom window analysis, several momentum indicators have already reached, or moved close to, levels historically associated with major Bitcoin bottoms.
• Normalized RSI has entered a historical bottom region.
• Normalized Williams %R has shown a similar degree of momentum exhaustion.
• Normalized MACD has moved closer to its bottoming range, although it has not shown the same level of confirmation.
• MVRV Z-Score has cooled significantly, but valuation has not fully reached the deepest historical accumulation zone.
• Puell Multiple has also suggested that miner capitulation may not be complete.
These indicators tell us that BTC is much closer to the end of the bear market than the beginning.
They do not necessarily tell us that the final price low has already been printed.
An oversold condition is not the same as a confirmed reversal.
Momentum can reach extreme levels before price forms its final low. It can also remain depressed while the market moves sideways, prints a failed rally or produces one final liquidation event.
This is why momentum should be considered together with time and trend.
5. Time Based Capitulation Still Points Toward October or November
In my previous analyses, I examined the amount of time between Bitcoin’s cycle top and its final bear market low.
Previous major cycle bottoms were formed approximately 53 to 58 weeks after the cycle high.
This does not create a fixed law, but the consistency is difficult to ignore.
Bitcoin is now considerably closer to that historical window, but the time based structure still leaves room for the market to continue its bottoming process into October or November.
This is what I mean by time based capitulation.
A bear market does not end simply because price has fallen far enough or because momentum has become oversold. The market also needs enough time to remove leverage, break confidence, reset expectations and exhaust both buyers and sellers.
Time capitulation often appears through boredom, failed rallies and repeated disappointments. It does not always require a dramatic crash.
This explains the apparent disagreement between the indicators:
• Momentum says the market is deeply exhausted.
• Valuation says BTC is becoming increasingly attractive.
• Trend says the 50W SMA has not been reclaimed.
• Time says the historical bottoming window may still be ahead of us.
The indicators are not necessarily contradicting each other. They may be describing different stages of the same bottoming process.
6. My Current Base Case
My base case is that the 50W SMA rejection remains intact and BTC eventually loses the current local range.
That would open the door to one final move below the existing cycle low, potentially during the October–November window identified in my previous analyses.
A move like this would bring time, trend, valuation and momentum closer to full alignment. It could also create the conditions needed for a much stronger and more sustainable accumulation phase before the next bull run.
I still view prices below $50,000 as increasingly attractive from a long term perspective. The low $40,000 area would remain a serious accumulation zone, while a move into the $30,000 to $40,000 region would likely require a deeper macroeconomic or liquidity shock.
These are potential zones, not exact targets.
The market may form a new cycle low at a higher level if demand remains strong. It may also spend more time moving sideways instead of producing a large final decline.
The important point is the sequence.
As long as BTC remains below the 50W SMA, the bear market has not technically proven that it is over. If the current range breaks while the moving average continues to act as resistance, the probability of another cycle low increases substantially.
That final move lower would not make me structurally bearish on Bitcoin.
It could be the move that completes the bear market.
7. What Would Confirm the Bearish Scenario?
The bearish continuation scenario becomes stronger if:
• BTC remains below the 50W SMA on a weekly closing basis.
• The lower boundary of the current range breaks.
• A retest of that broken support fails.
• Price continues to form lower highs.
• Momentum rolls over before producing a confirmed macro reversal.
Together, these developments would support the idea that the recent rally was a failed macro reclaim and that the market still needs one final capitulation phase.
8. What Would Invalidate This Analysis?
I do not believe in holding a bearish thesis after the market invalidates it.
The delayed bottom scenario becomes significantly weaker if:
• BTC closes decisively above the 50W SMA.
• Price holds above the average for more than a brief wick.
• A retest confirms the 50W SMA as support.
• BTC breaks the current range high and begins forming higher highs and higher lows.
• Monthly momentum confirms the improvement already visible in shorter term indicators.
If these conditions appear, I would accept that the cycle low may already be in and that Bitcoin is transitioning into a new bullish regime earlier than the time model suggests.
Price confirmation must take priority over any historical model.
Final Thoughts
The 50W SMA has been one of Bitcoin’s most reliable long term regime filters. At the moment, BTC has tested that filter and failed to produce a convincing reclaim.
When that rejection is combined with the similarity to October 2025 and the fact that the historical 53 to 58 week bottoming window has not fully arrived, the probability of another move lower remains high.
This is not a guarantee, and I am not claiming that BTC cannot break above the 50W SMA in the coming days or weeks.
I am simply weighing the evidence.
Momentum suggests that Bitcoin is close to a major bottom.
Time suggests that the final low may still be ahead.
Trend has not confirmed a new bull market.
Price structure is beginning to resemble a previous distribution pattern.
My conclusion remains consistent with my earlier analyses:
BTC is closer to the bottom than the top, but the final cycle low may not be in yet.
One final move lower into the October–November window could complete the capitulation process and create the foundation for the next major bull run.
Until Bitcoin reclaims and holds the 50W SMA, I continue to treat downside continuation as the dominant scenario.
The data remains the compass, not emotions.
This analysis represents my personal interpretation of the available data and is not financial advice. Short 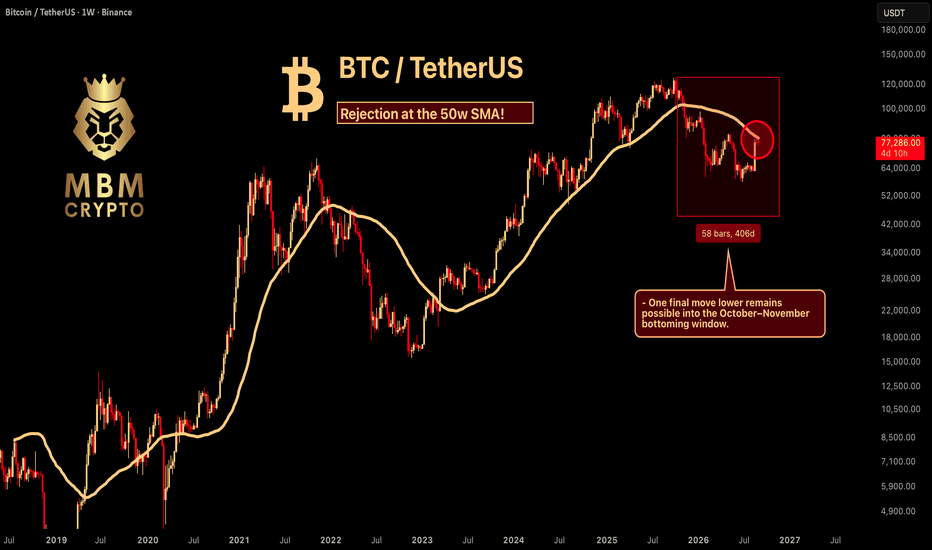
XRPUSDT Breakout from accumulation and bulls interest zoneFollowing the rejection at the 1.4817-1.4965 daily resistance level, bears have been actively offloading large volumes and continue to exert downward pressure on the price. This pressure has already triggered a breakout from the accumulation zone formed at the 1.3907-1.4339 weekly level. Consequently, the market structure is gradually shifting to favor further decline.
If bears continue to ramp up volume and the price fails to re-enter the accumulation zone, the breakout can be considered confirmed. In that scenario, attention shifts to the next weekly support level at 1.1999-1.2216, which becomes the primary target for the current move.
For bulls, this specific range could serve as the next zone of interest. If the decline persists without a swift recovery above the 1.3907–1.4339 level, it would be more logical to consider new long positions at this support level.
Thus, bears currently retain the initiative. The key now is to observe whether the current breakout from the accumulation zone evolves into a full-fledged distribution phase to the downside, or if the market quickly rebounds above the weekly level, turning the move into yet another false breakout. BTC: CLARITY Act Stalls — FOMC Is the Next CatalystIn my Idea last week, I warned about the downside risk for BTC during the New Moon cycle , when Bitcoin was trading around $79K .
That risk quickly materialized after the CLARITY Act failed to advance in the U.S. Senate, with the procedural vote falling short of the 60 votes required. BTC then entered a sharp decline.
So, what’s next?
The FOMC is now the next major catalyst.
🔘 Back to the chart:
BTC has broken below the $75.5K Trading Range low and is currently hovering around the previous weekly low near $76K.
For now, the structure remains unclear.
📈 Key Levels I'm Watching
$81K–82.8K — Daily Bearish OB
$79.5K — Fib Golden Pocket + H4 Bearish OB + VAH
$77K — Trading Range POC
(A daily reclaim above this level would make me bullish again.)
$76K — Previous Week Low
$72K–71K — Buy Zone
All of these key levels and liquidity areas are marked on the chart.
🔴 Short Setups
Since BTC has not confirmed a daily breakdown from the Trading Range, I remain cautious about chasing shorts.
1. Liquidity Sweep + SFP
If price sweeps one of the key levels mentioned above and forms an SFP, I’ll consider a short entry.
2. Confirmed Daily Breakdown
If BTC breaks below the $75K area on the daily timeframe with expanding volume, I’ll consider short exposure.
Without that confirmation, I’m not interested in chasing the downside.
🟢 Long Setups
I’ll look for longs after BTC reclaims the $76K Previous Week Low.
If price can reclaim and hold above $77K, we could see another test of the $80K area.
For me, $77 is the key short-term pivot.
🔘 FOMC Trading Plan
I’m also currently participating in the KCGI Trading Competition.
FOMC can produce violent two-way price action, so I’ll avoid chasing the first news candle.
Instead, I’ll wait for price to react around these key levels and look for confirmation from the subsequent price action.
Let’s see whether this FOMC gives us another clean opportunity.
Structure first. Reaction second. Execution last.  Short
Short
 Short
Short
BTCUSDT 15M: Supply Zone Mitigation & Short ContinuationOn the 15-minute timeframe, Bitcoin (BTCUSDT) has experienced a breakdown from earlier highs and is consolidating beneath an overhead supply zone. Price has retraced into the $75,976 – $76,334 resistance block following a lower-high structure, setting up a potential bearish rejection scenario.
Technical Reference Levels
Overhead Supply / Entry Zone: ~$75,976.30 – $76,334.07 (Supply Zone / Resistance Block)
Invalidation / Structural Level: ~$76,334.07 (Above the local supply zone high)
Downside Target Level: ~$74,494.20 (Major lower support / liquidity target)
Technical Setup Logic
Price is currently testing the lower boundary of the supply zone near $75,976 after making a corrective pullback. The technical mapping anticipates a potential rejection from this resistance area to resume the broader lower-timeframe downtrend toward the lower target at $74,494.20, with structural invalidation defined above $76,334.07.
Disclaimer & Purpose
This post is strictly for educational, analytical, and charting practice purposes only. It is not a financial idea, trading signal, or investment advice. Always manage your own risk and perform independent research. Short 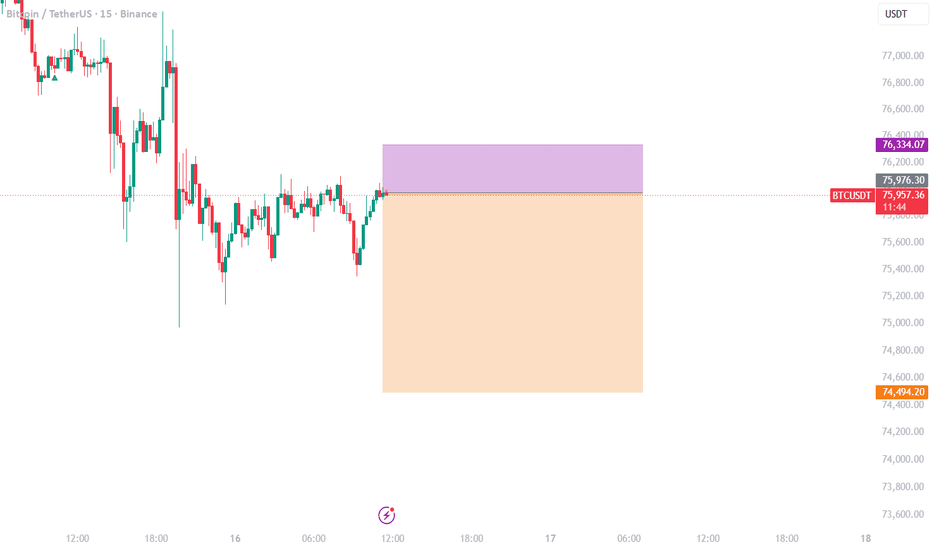
BTCUSD 1H: Fed Hike Day - Falling Channel Eyes $74KBTCUSD is bleeding inside a statistically selected descending channel on the 1-hour chart, and tonight's FOMC decision could be the trigger that breaks its last support.
MACRO TRIGGER
The Fed announces its decision today at 2:00 PM ET. Markets price a ~93% chance of a 25 bps hike to 3.75%-4.00%, the first hike since July 2023. Treasury yields sit at 52-week highs and energy prices keep inflation sticky. The hike itself is priced in: the real danger is a hawkish dot plot signaling more hikes. Higher yields drain liquidity from risk assets, and Bitcoin usually feels it first.
INDICATOR CONFLUENCE
- Adaptive Market Profile automatically selects the most linear trend window using Pearson correlation. With auto-selection enabled, a 2.0 deviation multiplier, logarithmic calculation and a distributed-volume profile, it now locks onto a short and steep window (L=50, R=0.894). The active channel points sharply lower, and volume is concentrated at the top of the move, where sellers took control.
- S/R Ultimate is using pivot-based levels with 25 left bars, 10 right bars, 3 quick right bars and Close as its source. Its map shows a stacked resistance cluster at $76.50K-$76.65K and major supply at $79.20K. Below price, only one level is left: $75.40K.
BEARISH SCENARIO
As long as 1H closes remain below $76.50K, the base case is continued pressure on $75.40K. A clean loss of that level after the Fed would expose the lower adaptive channel near $74.00K, and post-FOMC volatility could make the move fast.
BULLISH INVALIDATION
A sustained 1H close above $76.65K would neutralize the immediate breakdown risk. A real structural reversal would require reclaiming the major supply at $79.20K.
BOTTOM LINE
One support left, one major catalyst tonight. If the Fed sounds hawkish and $75.40K gives way, $74K is the next stop. Short 
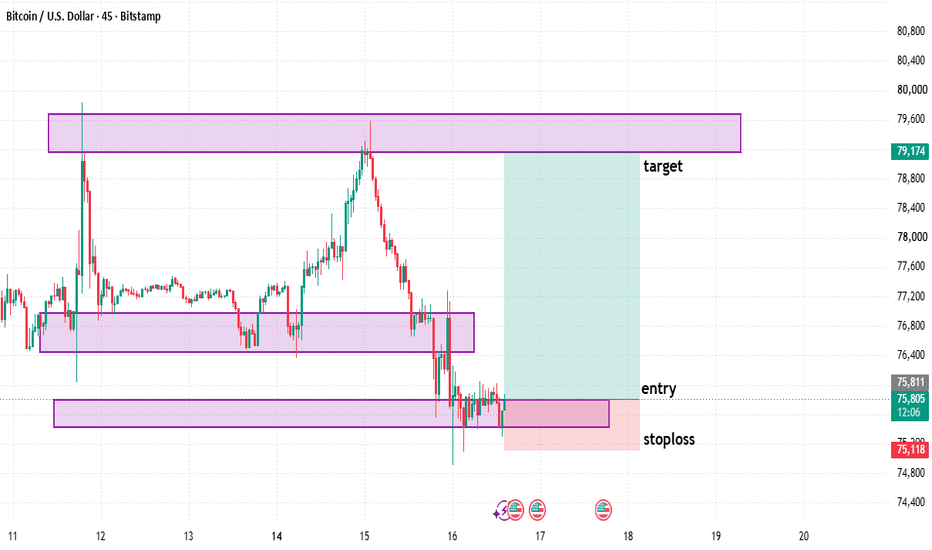
BTC/USD — 45-Minute Chart🟠 BTC/USD — 45-Minute Chart
BTC/USD is currently reacting around a marked support and demand zone near 75,300–75,800. Price has moved down sharply from the higher resistance area and is now consolidating close to this lower zone.
The chart shows a potential bullish scenario if the demand area continues to hold:
Current area: 75,300–75,800
Entry area: around 75,774
Invalidation / stop area: below 75,118
Target area: around 79,174
Major resistance / supply: approximately 79,200–79,600
The idea is based on price respecting the lower demand zone after the recent decline. A sustained reaction from this area could allow price to move back toward the higher resistance zone.
If price breaks and holds below the marked demand area, the setup would lose strength and the downside structure could remain active. Long