Crypto market
CELO: local squeeze with $0.0897 destinationThe Macro Picture 🗺️
CELO unwound from the $0.10441 highs down to the $0.05548 floor in June, then reversed and reclaimed ground to $0.07115. RSI has climbed back above 50 as the recovery builds higher lows — the balance has shifted toward the buyers.
The Setup ⚙️
The Range Floor 🟢
$0.05548 (Macro Support) is the demand base. The June low was defended and price has built well above it — that's the floor this range pivots on.
The Decision Point 🔴
$0.08163 (Local High) is the gate. A daily close above it flips the local structure bullish and opens the path to the $0.08965 measured-move target.
The Roadmap 🛣️
Hold the $0.05548 floor → break $0.08163 → run toward $0.08965. Invalidation is a clean daily close below $0.05548 — that breaks the base.
This is a GRID Range Play: a defined band to rotate, buying the lower half and scaling out into strength.
More setups in profile.
#CELO #Celo #crypto #trading #TA #3Commas #GRID
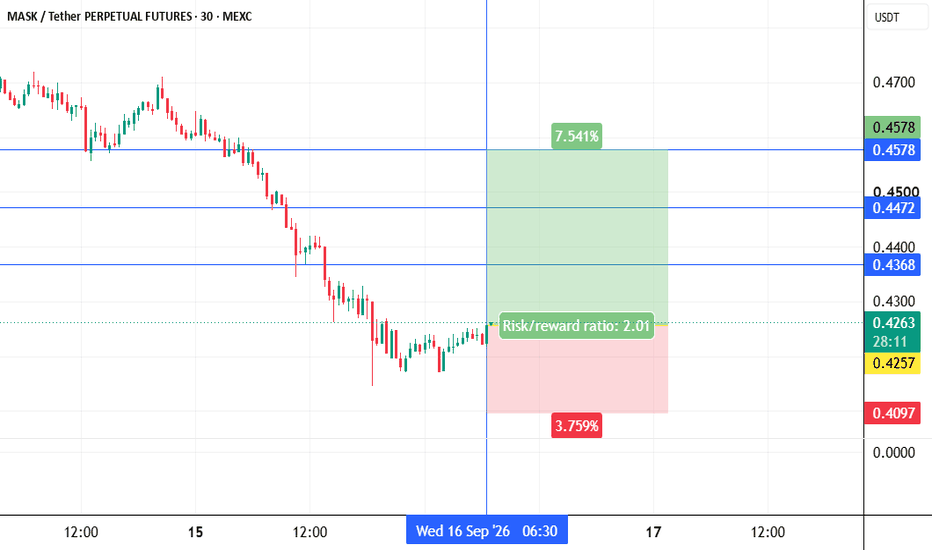
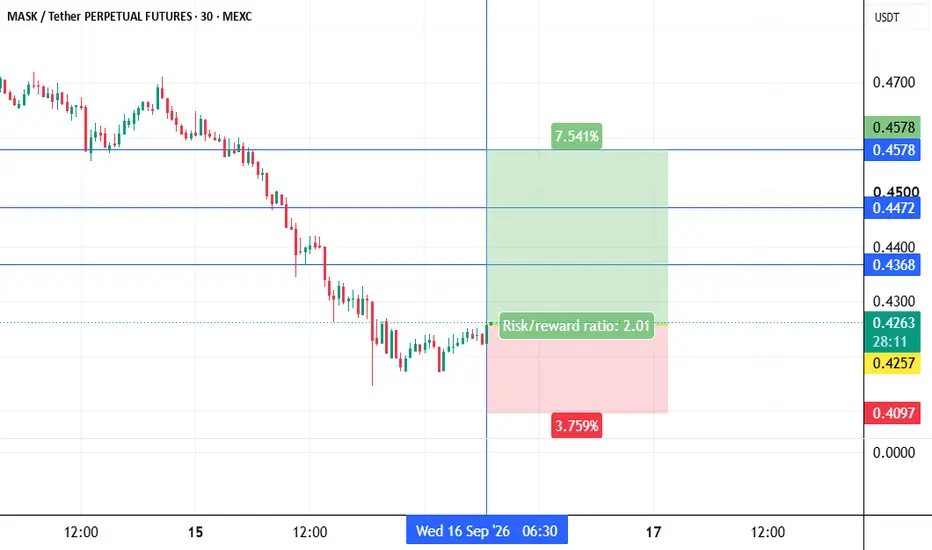
MASK: local squeeze with $0.4587 destinationThe Macro Picture 🗺️
MASK unwound from the $0.6938 macro ceiling into a range and is now balancing at $0.3865, in the middle of the band above the $0.33 floor. The tape has flattened into rotation as it works off the downtrend.
The Setup ⚙️
The Range Floor 🟢
$0.3300 (Macro Support) is the demand base. The June low was defended and price has built above it — that's the floor this range pivots on.
The Decision Point 🔴
$0.4386 (Local High) is the gate. A daily close above it flips the local structure bullish and opens the path to the $0.4587 measured-move target.
The Roadmap 🛣️
Hold the $0.33 floor → break $0.4386 → run toward $0.4587. Invalidation is a clean daily close below $0.33 — that breaks the range.
This is a GRID Range Play: a defined band to rotate, buying the lower half and scaling out into the breakout.
More setups in profile.
#MASK #MaskNetwork #crypto #trading #TA #3Commas #GRID
The Market Has Regimes📊 The Market Is Not One Thing: Why Your Strategy Must Adapt to Market Regimes
⚠️ The same strategy can be profitable, unprofitable, or completely useless — simply because market conditions have changed.
And this is one of the most painful lessons traders usually learn not during their first backtest, but after a series of real trades.
On historical data, everything looked great.
The signals were clean.
Price respected levels.
The trend carried the market exactly where it was supposed to go.
Then the market changed its character.
And the strategy that looked like a solid trading system yesterday started slowly cutting the account with a series of small, frustrating, highly disciplined losses.
At that moment, many traders reach the wrong conclusion:
The strategy is broken.
But sometimes the strategy is not broken at all.
It has simply entered the wrong market regime .
🚨 The Biggest Mistake: Assuming the Market Is Always the Same
Many traders test strategies as if the market were a single environment.
There is a chart.
There are candles.
There are indicators.
There is an entry signal.
So if a strategy works, shouldn't it work all the time?
Not exactly.
The market is not a straight road.
It's more like a highway where the surface changes every few miles:
dry asphalt;
wet pavement;
ice;
mountain roads;
gravel;
and occasionally a construction zone that appears right after you've already driven into it.
If you use the same speed and driving style everywhere, the problem is not the car.
The problem is that you failed to recognize the changing conditions.
Trading works the same way.
A strategy is not a universal key for every market.
It is a tool that performs best in a specific environment.
📉 Why Good Strategies Suddenly Start Producing Bad Trades
Imagine a trend-following strategy.
It looks for momentum.
Waits for a breakout.
Enters in the direction of movement.
Allows room for price to develop.
Makes money when the trend continues.
In a trending market, this logic works beautifully.
Price breaks a level and keeps going.
Pullbacks get bought.
New highs are continuation signals rather than traps.
Trailing stops work.
Scaling out makes sense.
But what happens when the market shifts into a range?
The exact same breakout suddenly becomes false.
The same momentum entry becomes a purchase near the top of the range.
The same trailing stop never has time to develop because price immediately rotates back.
The same signal that represented strength in a trend becomes a trap in a range.
And the trader asks:
Why did my strategy stop working?
Because the market is no longer providing the conditions the strategy was designed for.
🔄 Four Basic Market Regimes Every Trader Should Understand
Markets can be simplified into several major regimes.
Not perfectly.
Not mathematically clean.
But practical enough to stop trading blindly.
📈 A) Trending Market
A trend is a market that moves directionally.
Typical characteristics:
Higher highs and higher lows (uptrend)
Pullbacks are bought aggressively
Price remains above key moving averages
Breakouts often continue
Trends can last much longer than expected
Strategies that often perform well:
Trend following
Breakout trading
Position holding
Trailing stops
Trading with the higher timeframe trend
The biggest mistake traders make during trends:
💰 Taking profits too early.
The brain sees profit and wants to lock it in immediately.
But trend-following systems often earn their biggest gains by allowing exceptional trades to run.
↔️ B) Range-Bound Market
A ranging market repeatedly returns toward its average rather than moving directionally.
Characteristics:
Price oscillates between support and resistance
Breakouts frequently fail
Momentum fades quickly
Levels work better than continuation patterns
Late entries often get punished
Strategies that may perform better:
Mean reversion
Range trading
VWAP-based approaches
Trading from range boundaries
Carefully controlled grid systems
The biggest mistake:
⚠️ Trading a range as if it were a trend.
Buying the breakout after the move is already exhausted.
Or shorting the range low because "this time it must break."
Spoiler:
It doesn't have to.
🌪️ C) High Volatility Environment
This is a market where candles expand, stop losses get hit more frequently, and normal distances stop working.
Characteristics:
Large candles
Fast reversals
Aggressive level sweeps
Rising ATR
Frequent stop hunts
Strong reactions to news and liquidations
In these conditions, direction alone is not enough.
Your risk model must be capable of surviving larger price swings.
A strategy can be logically correct while still losing because the stop loss is too tight.
The market stops you out first.
Then moves exactly where you expected.
A frustrating experience every trader knows well.😅
🤏 D) Low Volatility Compression
This is a market with very little movement.
Characteristics:
Narrow trading ranges
Small candles
Low ATR
Declining volume
Contracting Bollinger Bands
Attractive-looking signals that fail to expand
In this phase, excessive trading often becomes a donation program for exchange fees.
However, there is an important nuance.
Periods of compression are frequently followed by expansion.
Low volatility is not necessarily bad.
It can be preparation for a major move.
The question is:
Are you trading inside the compression, or are you waiting for the breakout from it?
Those are two completely different objectives.
🎯 The Same Signal Means Different Things in Different Regimes
This is why signals should never be evaluated without context.
A breakout buy signal during a trend and the same breakout buy signal during a range are not the same trade.
In a trend, it may represent continuation.
In a range, it may be a late entry near resistance.
In high volatility, it may occur just before a reversal sweep.
In low volatility, it may be an entry into a move that hasn't actually started.
Formally, the signal is identical.
Practically, the trades are completely different.
This is where the distinction between a beginner and a systematic trader begins.
The beginner asks:
Is there a signal?
The systematic trader asks:
What market regime produced this signal?
🧠 The Psychological Trap
When a strategy produces several winning trades, traders often develop confidence without verification.
They begin to think:
"This strategy works."
And that may be true.
But it is incomplete.
A more accurate statement is:
"This strategy worked in the conditions where I observed it."
That difference matters.
Markets are not obligated to remain favorable.
They never promised to provide clean breakouts, strong trends, and textbook retests forever.
Markets evolve.
Many traders do not.
🛠️ Useful Filters for Identifying Market Regimes
No filter is perfect.
The goal is not prediction.
The goal is reducing the number of trades taken in the wrong environment.
📊 ADX
Measures trend strength.
High and rising ADX often indicates trending conditions.
Low ADX may indicate a range or indecisive market.
Importantly, ADX does not show direction.
It measures strength.
📏 ATR and ATR%
ATR measures volatility.
Rising ATR suggests expanding volatility.
Falling ATR suggests compression.
ATR% is particularly useful for comparing volatility across different assets.
📐 EMA Slope
The moving average itself is not magic.
But its slope can reveal whether the market is moving directionally or simply oscillating.
A strongly rising EMA represents a different environment than a flat EMA repeatedly crossed by price.
🎈 Bollinger Band Width
Narrowing bands often indicate volatility compression.
Expanding bands suggest increasing volatility and movement.
Remember:
Compression is not an entry signal.
It is a warning that energy is building.
🏗️ Market Structure
Sometimes the simplest filter is the most effective.
Higher Highs + Higher Lows = Bullish Structure
Lower Highs + Lower Lows = Bearish Structure
When structure changes, the regime may be changing as well.
Price often communicates more clearly than indicators.
The challenge is listening to it.
🔊 Volume
Volume helps distinguish genuine participation from empty moves.
A breakout with volume and a breakout without volume are very different events.
Especially in crypto markets where liquidity varies significantly between assets.
⚡ What Happens When You Ignore Market Regimes?
The dangerous part is that performance usually deteriorates gradually.
Not with a single catastrophic loss.
But through a sequence of small losses:
one failed breakout;
another failed breakout;
a premature entry;
a stop hit by noise;
an attempt to recover losses;
strategy adjustments made emotionally in real time.
At that point, the trader is no longer testing a hypothesis.
The trader is arguing with the market.
And the market rarely loses those arguments.
✅ The Right Questions Before Deploying a Strategy
Instead of asking:
"What is the historical return?"
Ask:
In which market regime does this strategy perform best?
In which regime does it lose money?
How can I identify when current conditions are unfavorable?
Under what conditions should the strategy be paused?
What must happen before it is reactivated?
That is how systematic trading begins.
₿ Why This Matters Even More in Crypto
Crypto markets change character quickly.
Today Bitcoin trends smoothly.
Tomorrow a news event creates more movement in fifteen minutes than the previous two days combined.
Then the market enters a range.
Then liquidation cascades appear.
Then volatility disappears.
A strategy that cannot distinguish between these environments will respond to all of them the same way.
And responding identically to different conditions is not discipline.
It is blindness.
☑️ Practical Pre-Trade Checklist
Before trusting any signal, ask:
1. Is the market trending or ranging?
If trending, in which direction?
If ranging, where are the boundaries?
2. Is volatility normal, high, or low?
Does the stop loss reflect current market conditions?
3. Is there higher timeframe confirmation?
Trading against the higher timeframe is not forbidden.
It simply involves different risk.
4. Is volume supporting the move?
Or is this a thin-market spike?
5. Is this strategy appropriate for the current regime?
Not "Do I want a trade?"
But:
"Does this logic fit the environment?"
6. What happens if the regime changes after entry?
Do you have:
an exit plan?
a stop loss?
a risk limit?
🎓 Final Takeaway
There is no single market.
There is a trending market.
A ranging market.
A high-volatility market.
A compressed market.
A market worth trading.
And sometimes a market where the smartest decision is simply to close the terminal and preserve capital.
A strategy does not need to work everywhere.
In fact, if a strategy appears to work everywhere, it is worth examining whether it simply looks perfect on historical data.
A strong system is not the one that always trades.
A strong system understands:
When to trade.
What to trade.
How much risk to take.
And when to stay out.
💡 Final Thought
A trader matures not when they discover a new indicator.
A trader matures when they stop asking:
"Where is the entry?"
And start asking:
"In what market conditions does this entry make sense?"
Because performance is not created by a signal.
Performance is created by a system that understands context.
Don't trade opinions.
Trade market regimes.
⚠️ Disclaimer
This material is provided for educational purposes only and does not constitute financial or investment advice.
Trading financial markets involves risk. Always test any strategy through historical analysis, forward testing, and appropriate position sizing before deploying real capital.
Past performance does not guarantee future results.
ZRX: local squeeze with $0.1016 destinationThe Macro Picture 🗺️
ZRX unwound from the $0.12884 macro ceiling into a range and is now balancing at $0.08636, in the middle of the band above the $0.07315 floor. The tape has flattened into rotation as it works off the downtrend.
The Setup ⚙️
The Range Floor 🟢
$0.07315 (Macro Support) is the demand base, with $0.07751 (Local Low) as the nearer shelf. Both have held, and that's the floor this range pivots on.
The Decision Point 🔴
$0.09461 (Local High) is the gate. A daily close above it flips the local structure bullish and opens the path to the $0.10159 measured-move target.
The Roadmap 🛣️
Hold above $0.07751 → break $0.09461 → run toward $0.10159. Invalidation is a clean daily close below $0.07315 — that breaks the base.
This is a GRID Range Play: a defined band to rotate, buying the lower half and scaling out into strength.
More setups in profile.
#ZRX #0x #crypto #trading #TA #3Commas #GRID
#ZEN/USDT Long plan#ZEN
The price is moving within a descending channel on the 1-hour timeframe and has reached the lower boundary. It is now poised for a bounce and is expected to retest this boundary.
The Relative Strength Index (RSI) indicates a downward trend, which is likely to continue given the overbought conditions.
There is a key support zone in green at 3.95, and the price has bounced off this zone several times, making it a strong support level.
The price is trending towards the 100-period moving average, which we are approaching. This trend supports an upward move.
Entry Price: 4.20
Target 1: 4.25
Target 2: 4.30
Target 3: 4.36
Stop Loss: At the resistance zone in green
Remember this simple rule: Money management.
Any questions, please leave a comment.
Thank you.
The Elephant Jungle 7/21/26 Page 3The Bulls are currently trying to break out of Inside Range 2, but the Bears have a 2H Order Block holding the line. Right now the Bears are trying to trigger a Range Deviation and send the Bulls right back down to the Range Low before they get too comfortable climbing higher.
The question is, do the Bears have enough strength to shut this breakout down, or will the Bulls punch right through and leave the Bears behind?
This is where patience pays. The next move could decide whether this breakout is the real deal or just another liquidity trap.
SUSHI: local squeeze with $0.2067 destinationThe Macro Picture 🗺️
SUSHI unwound from the $0.26 highs down to the $0.1384 floor, defended it, and has recovered to $0.1690. RSI is curling back above 50 as price builds off the base — the tape is rotating higher rather than breaking down.
The Setup ⚙️
The Range Floor 🟢
$0.1384 (Macro Support) is the demand base, with $0.1536 (Local Low) as the nearer shelf. Both have held, and that's the floor this range pivots on.
The Decision Point 🔴
$0.2262 (Local High) is the gate. Before it, the $0.2067 measured-move target is the first objective — clearing it flips the local structure bullish.
The Roadmap 🛣️
Hold above $0.1536 → rotate up toward $0.2067 → then challenge $0.2262. Invalidation is a clean daily close below $0.1384 — that breaks the base.
This is a GRID Range Play: a defined band to rotate, buying the lower half and scaling out into strength.
More setups in profile.
#SUSHI #SushiSwap #crypto #trading #TA #3Commas #GRID
1INCH: local squeeze with $0.0882 destinationThe Macro Picture 🗺️
1INCH unwound from the $0.105 highs down to the $0.06440 floor in June, then reversed and reclaimed ground to $0.07599. RSI is now pushing toward 60 as the recovery builds higher lows — the balance has shifted back toward the buyers.
The Setup ⚙️
The Range Floor 🟢
$0.06440 (Macro Support) is the demand base. The June low was defended and price has built well above it — that's the floor this range pivots on.
The Decision Point 🔴
$0.09960 (Local High) is the structural gate. Before it, the $0.08819 measured-move target is the first objective — clearing it keeps the recovery intact.
The Roadmap 🛣️
Hold above $0.06440 → rotate up toward $0.08819 → then challenge $0.09960. Invalidation is a clean daily close below $0.06440 — that breaks the base.
This is a GRID Range Play: a defined band to rotate, buying the lower half and scaling out into strength.
More setups in profile.
#1INCH #crypto #trading #TA #3Commas #GRID
#BLURUSDT#BLUR
The price is moving within a descending channel on the 1-hour timeframe and has reached the lower boundary. It is now poised for a bounce and is expected to retest this boundary.
The Relative Strength Index (RSI) indicates a downward trend, which is likely to continue given the overbought conditions.
There is a key support zone in green at 0.01488, and the price has bounced off this zone several times, making it a strong support level.
The price is trending towards the 100-period moving average, which we are approaching. This trend supports an upward move.
Entry Price: 0.01570
Target 1: 0.01590
Target 2: 0.01616
Target 3: 0.01647
Stop Loss: At the resistance zone in green
Remember this simple rule: Money management.
Any questions? Please leave a comment.
Thank you.
ROSE at macro floor: base recovery toward $0.0069The Macro Picture 🗺️
ROSE unwound a long downtrend from the $0.012190 highs down to the $0.005239 macro floor and has stopped falling right on it. RSI is pressed near 40 and the selling has flattened — the shape of exhaustion, not continuation.
The Setup ⚙️
The Accumulation Zone 🟢
$0.005239–0.005583 is where the selling has dried up. The macro floor has held on retest, and this is the demand shelf a recovery would build from.
The Decision Point 🔴
$0.012190 (Local High) is the far structural gate. Before it, the $0.006917 measured-move target is the first objective — reclaiming it proves buyers are stepping back in.
The Roadmap 🛣️
Hold the $0.005239 floor → recover toward $0.006917 → then work higher. Invalidation is a clean daily close below $0.005239 — that voids the accumulation thesis.
This is a textbook DCA Accumulation Zone setup: scale in across the $0.005239–0.005583 band and let the base do the work.
More setups in profile.
#ROSE #Oasis #crypto #trading #TA #3Commas #DCA
Open Air to 67,600)Good morning, traders ☀️🌴
Great news for the bulls 🦬💰 today — Bitcoin has finally broken above the 65,000 level, and it did so with confidence. In yesterday’s post, I warned that this was a very realistic scenario❗️
“Don’t let this beautiful 62,500–64,890 range, with its almost perfect reactions at both boundaries, lull you into a false sense of confidence. Despite the clean rejections from the upper boundary, price can easily bounce from the 4H EMA 200 and quickly continue toward 67,600.”
🦬🚀 The exact “bounce from the 4H EMA 200 and quickly continue toward 67,600” that I mentioned yesterday is now visible on the chart. At the time of writing, the price has already climbed to around 66,400.
🐻🧨 I’ll also make a small update to the bearish scenario.
- 65,000 — Major horizontal support formed during February–March 2026 and confirmed multiple times in June.
- 62,500 — Key support level where price has been consolidating since early June.
- 60,800 — Local horizontal support.
- 60,000 — Strong horizontal support.
As long as 65,000 holds, the bulls remain in control, with 67,600 being the next upside target.
Peace everyone 🌄
⚠️ Disclaimer:
All information shared on this channel is for educational and informational purposes only and is not investment advice. The author is not responsible for your trading decisions. Always manage your risks and make decisions independently.
MINA: local squeeze with $0.0574 destinationThe Macro Picture 🗺️
MINA unwound from the $0.096 highs into a base, defended the $0.0368 floor in June, and bounced to $0.055 before settling back to $0.0468. Price is balancing mid-range with RSI curling back above 50 — the tape is rotating rather than trending.
The Setup ⚙️
The Range Floor 🟢
$0.0368 (Macro Support) is the demand base. The June low was defended and price has built above it — that's the floor this range pivots on.
The Decision Point 🔴
$0.0532 (Local High) is the gate. A daily close above it flips the local structure bullish and opens the path to the $0.0574 measured-move target.
The Roadmap 🛣️
Hold the $0.0368 floor → break $0.0532 → run toward $0.0574. Invalidation is a clean daily close below $0.0368 — that breaks the range.
This is a GRID Range Play: a defined band to rotate, buying the lower half and scaling out into the breakout.
More setups in profile.
#MINA #Mina #crypto #trading #TA #3Commas #GRID
The Elephant Jungle 7/21/26 Page 2The Bulls are looking good. They have a nice uptrend going, and right now no High Time Frame Order Blocks are standing in their way.
The big question is, will the Bulls be able to take out the Weak 1D High and get a strong close outside of the Inside Range, showing they are ready to push even higher?
Or is this the perfect setup for the Bears?
If the Bulls sweep that liquidity but fail to hold above the range, the Bears could step in, trigger a Range Deviation, and send the Bulls right back down to the Range Low.
This is one of those moments where patience matters. The market is getting ready to reveal its hand, and whichever side wins this battle could control the next major move.