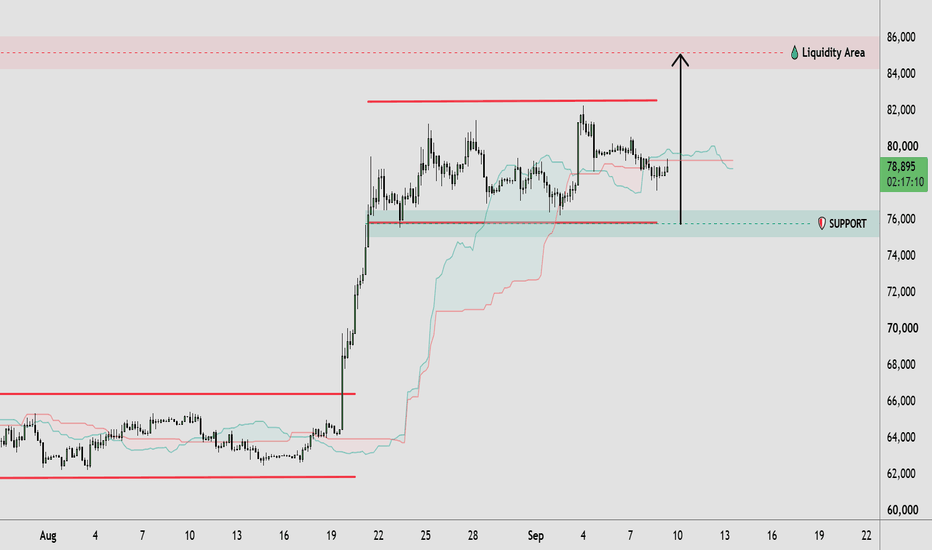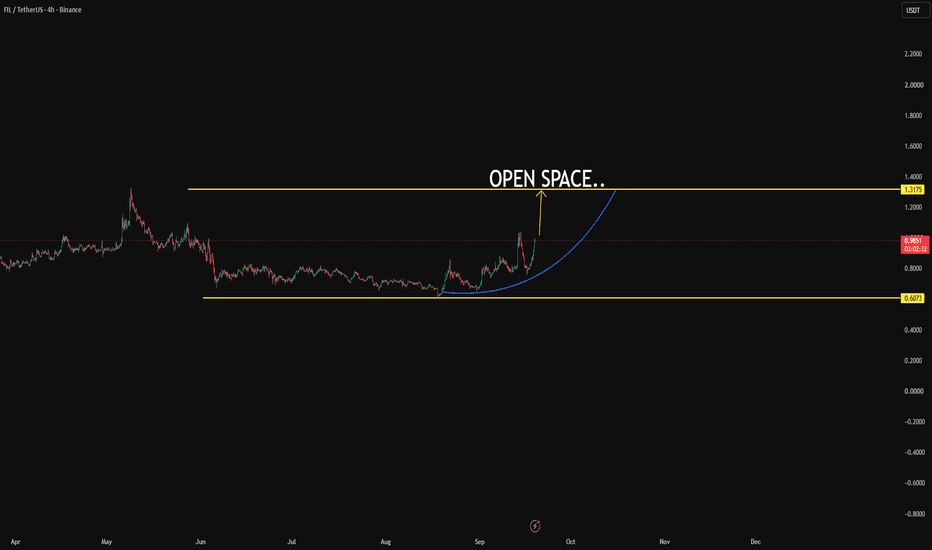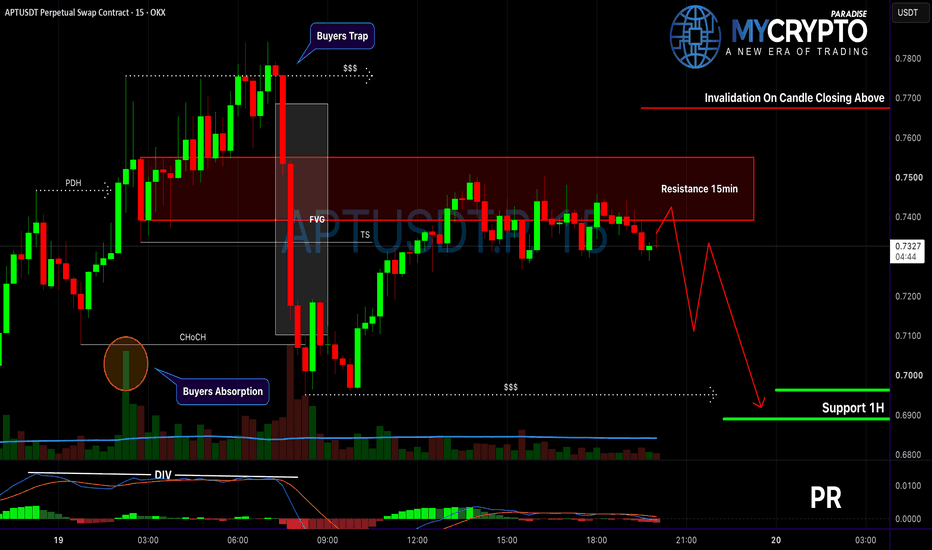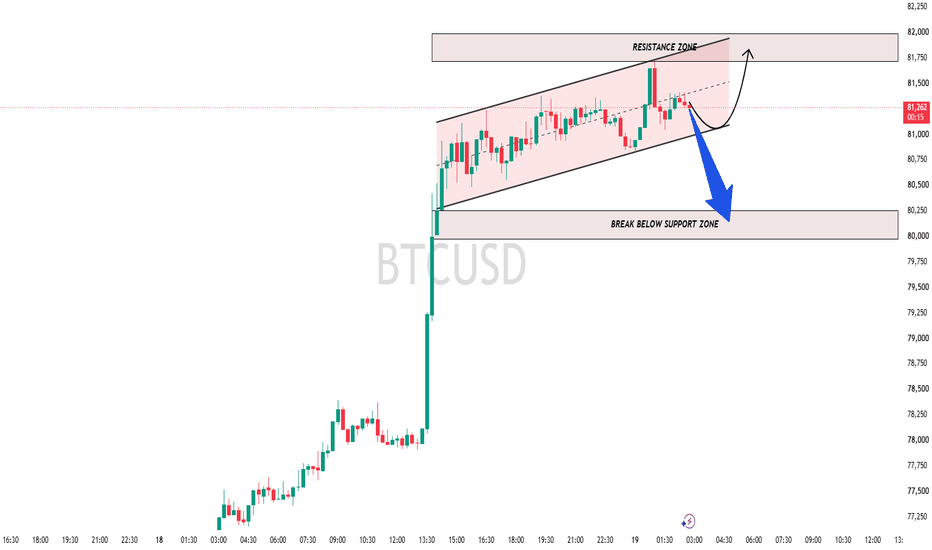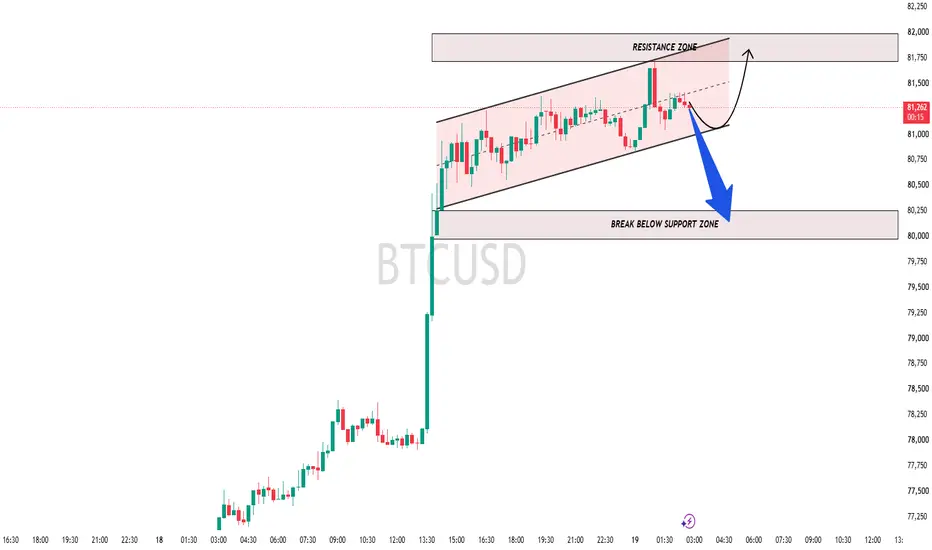
BTCUSD | Liquidity-Based OutlookBTCUSD has reacted strongly from the highlighted resistance zone after failing to sustain bullish momentum near the recent highs. The rejection from this area suggests that buyers may be losing control in the short term.
A bullish Break of Structure (BOS) remains visible, but the current price action indicates a possible retracement before any continuation higher. If price fails to reclaim the resistance zone, the market could seek liquidity lower and move toward the marked support area and sell-side liquidity zone
Resistance: 64,750 – 65,000
Support: 62,700 – 63,000
Buy-Side Liquidity: Above 65,500
Sell-Side Liquidity: Around 62,500
A confirmed bullish reaction from the current level may lead to another test of resistance. Otherwise, further downside toward the support zone remains probable.
This analysis is shared for educational purposes only and does not constitute financial advice. Always trade with proper risk management and discipline
Crypto market
Bitcoin's Next Direction Depends on This ZoneBitcoin has returned to a major decision zone after losing its recent bullish structure, making the current reaction one of the most important developments on the higher timeframe.
The recent breakdown from the rising channel shifted momentum in favor of the bears, but price is now testing a long-standing support area around 59k–62k. As long as this zone continues to attract demand, there is still room for a recovery toward the first resistance near 75k, where sellers are expected to challenge the move. A successful breakout above that level would significantly improve bullish momentum and open the path toward the 100k resistance.
On the other hand, a confirmed daily or 3-day close below the highlighted support would invalidate the recovery scenario and expose Bitcoin to a deeper decline toward the projected 45k target. This makes the current region a high-probability inflection point rather than an ideal place to chase price.
Patience is key. Let the market confirm direction before committing, as the next breakout from this critical zone is likely to define Bitcoin's medium-term trend.
BTC/USDT 15m — Clean Breakout, Waiting for the Retest | Jul 20BTC broke out. After two days rotating around 64,750, price cleared that level, drove through the 1H imbalance at 65,200–65,280, and is now pressing the highs near 65,500.
Conditions are as clean as they get here — both timeframes expanding, both pointed up, and the trend is well-established rather than fresh. This is a continuation environment. The play is buying dips, full stop. No fading, no shorting into strength.
But I'm not buying 65,500.
Price is extended at the top of a vertical breakout. Buying here is paying up for a move that already happened, right where it feels most obvious and the risk is actually highest. The level I want is well below.
The trade:
Long: A pullback into 64,750–65,000. That zone is stacked — the structure that just broke (support now, resistance before), the 1H imbalance, and the rising VWAP, all converging in the same area. That's a high-quality retest. If price comes back there and holds — buyers stepping in, sellers failing to follow through — that's the entry, targeting a push back to the 65,730 highs and above. Stop below the zone with real room, because this tape moves fast.
Because the trend is this clean, if it gives me that pullback and holds, I'm willing to hold the runner rather than bank early — both timeframes are participating, which is the environment that supports extension.
Short: No interest. Fading a clean breakout with both timeframes aligned up is fighting the whole market.
If it never pulls back and just runs, I miss it. That's fine — a missed trade costs nothing, chasing the top of a vertical move costs real money.
Wait for 64,750–65,000. Let it hold. Then get involved.
Not financial advice. Trade your own plan.
ENA 4H – Rising Channel Pullback Into Lower Trendline SupportENA on the 4H timeframe is currently trading around 0.0833 after reaching the upper boundary of a rising parallel channel near 0.0858–0.0860 on July 14 and pulling back, with price now holding above the 0.0830–0.0835 horizontal pivot as the rising lower trendline climbs into the 0.0756–0.0760 area beneath.
The chart shows a rising parallel channel originating from the late June low near 0.0704, with the lower trendline connecting the June 29 bottom through the July 9 low near 0.0726 and continuing to climb steeply through the structure, while the upper trendline capped the July 10 high near 0.0838 and the July 14 high near 0.0858–0.0860. Price has made two clean oscillations inside the channel, bouncing from the lower boundary each time before pushing into the upper trendline. Two horizontal reference levels define the internal pivots — one near 0.0830–0.0835 which has acted as a recurring ceiling through the mid-to-upper portion of the channel, and a second near 0.0798–0.0802 just below the midline. The most recent pullback from the July 14 upper boundary high has held above 0.0800–0.0802 so far, and price is currently pressing back toward 0.0830–0.0835 from below following a bounce off that level.
The 0.0830–0.0835 horizontal has been tested multiple times from both sides and is now the immediate level determining whether price pushes back toward the upper channel boundary or pulls back toward the lower trendline.
Key Levels To Watch
→ 0.0858–0.0860 – Upper channel boundary, resistance (dynamic)
→ 0.0838–0.0842 – Prior resistance, minor ceiling below upper boundary
→ 0.0830–0.0835 – Horizontal pivot, current test
→ 0.0798–0.0802 – Horizontal support, mid-channel reference
→ 0.0756–0.0760 – Rising lower trendline, dynamic support (climbing)
→ 0.0726–0.0730 – Prior trendline touch, secondary support
→ Below 0.0704 – Channel breakdown, bullish structure invalidated
A hold above 0.0830–0.0835 and a push back toward the upper channel boundary near 0.0858–0.0860 would continue the established oscillation pattern and keep the bullish channel structure fully intact, with a clean upper boundary break opening further upside above 0.0860.
A loss of 0.0798–0.0802 on a confirmed 4H close would pull price toward the rising lower trendline near 0.0756–0.0760, and a confirmed break below that level would invalidate the channel structure entirely and open downside toward 0.0726–0.0730 and below.
Channel structure intact after upper boundary rejection, price holding above horizontal pivot. Hold 0.0830–0.0835 → upper boundary near 0.0858–0.0860 back in play. Lose 0.0798–0.0802 → lower trendline near 0.0756–0.0760 next, break below invalidates channel. Bias bullish inside rising channel. Shift only on confirmed close below rising lower trendline.
NEARUSDT NEARUSDT | 1H Timeframe
NEARUSDT is currently ranging between 1.897 and 1.941.
As long as the price remains within this range, it's better to wait patiently. A trading opportunity may arise after a confirmed breakout and confirmation (such as a retest or a strong candle close) of either boundary.
- Breakout and confirmation above 1.941: Bullish (Long) scenario.
- Breakout and confirmation below 1.897: Bearish (Short) scenario.
As always, apply proper risk management and money management before entering any trade. This is not financial advice—always do your own analysis.
HYPE / USDT Showing Weak Momentum — Bearish Target at $61.68HYPE / USDT is showing weak momentum, and as long as price remains below our key resistance level, there is a high probability of a bearish continuation toward the $61.68 target. The current structure favors the downside unless price reclaims the key level with strong confirmation. Manage risk wisely and always do your own research. 📊
ZAMA price analysis. Pump coming sooon ... ?👀 Take a closer look at CRYPTOCAP:ZAMA Could its pump be just around the corner?
#ZAMA is still a very young project. Like many newly listed tokens, it went through a brutal 90%+ correction after launch.
Today, only about 20% of the total supply is in circulation, while the project's market cap is roughly $75M.
As for fundamentals... It's probably still too early to draw serious conclusions.
But the chart is becoming increasingly interesting.
Looking at OKX:ZAMAUSDT , it feels like the long consolidation phase is approaching its natural end.
And after long periods of accumulation, strong impulsive moves often follow.
What's even more interesting is that over the past few days, sellers haven't been able to push the price lower despite the overall weakness in the crypto market.
That makes us think the next big move could be to the upside.
📈 Our first targets are:
🟢 $0.0444
🟡 $0.051
🔴 And if momentum really builds, we wouldn't rule out a move toward $0.069.
Of course, it's just one possible scenario. The market will have the final say.
💬 What do you think? Is CRYPTOCAP:ZAMA quietly being accumulated before a breakout, or does it need more time to consolidate?
______________
◆ Follow us ❤️ for daily crypto insights & updates!
🚀 Don’t miss out on important market moves
🧠 DYOR | This is not financial advice, just thinking out loud
$AAVE Technical AnalysisAAVE is consolidating around a major volume area after breaking its broader descending trendline. The current pullback looks more like a retracement from the recent impulsive move than a complete loss of structure.
The larger rounded base remains constructive and continues to suggest a possible accumulation phase. However, price is still trading beneath a major resistance and high-volume region, so stronger confirmation is needed before the structure can fully shift bullish.
The Synergy Signal oscillator has reset into oversold territory while price remains well above the previous swing low. Momentum has cooled significantly without an equal breakdown in market structure, creating conditions for a possible reversal if buyers return.
For now, AAVE remains in a key consolidation phase. A breakout above resistance with rising volume would strengthen the rounded-bottom thesis, while a loss of the current support structure would weaken it.
OPUSDT: Breakout Retest Could Fuel the Next RallyOPUSDT has reclaimed a key resistance zone and is now holding above the breakout level, signaling improving bullish momentum. The recent higher lows suggest buyers remain in control.
As long as 0.09597 holds as support, the bullish setup remains valid. A continuation above the current range could drive the price toward 0.09993, while a break below support would invalidate the setup.
Trade Setup
Entry: 0.09685
Target: 0.09993
Stop Loss: 0.09597
I'll wait for sustained buying volume and a confirmed hold above the breakout zone before expecting the next move higher.
ETHUSDT: CVD Bull Div Method B Long, TP1 Approaching POCGate one, BOS confirmed bullish structure had already shifted near 1,840 before the pullback into the fib zone began.
Gate two, price swept the OTE zone marked here as TCW OTE ETH LONG, tagging just under 1,800 before reversing. CVD Bull Div confirmed at the same moment, price pressing toward a lower low while cumulative volume delta printed a higher low instead, order flow disagreeing with the wick and signaling the sellers behind it had less behind them than the price action alone suggested.
Gate three, CHoCH confirmed once price reclaimed back through the zone and closed above it, the control bar turning the sweep and the divergence into a live trigger.
Method B Entry landed at the CVD Bull Div itself, ahead of the full structural reclaim, this is Continuation Acceleration Protocol's earlier-entry technique: order flow confirming direction before price structure fully closes the loop, trading earlier timing for tighter risk on the position.
Since entry, price has run cleanly from the OTE zone near 1,800 through 1,900 and is now approaching TP1, positioned directly under POC. That's not a coincidence of two separate levels, the same POC that's been the standing target since the BTC projection earlier this week is now the reference this ETH long is running into as well.
TP1 remains open, price pressing toward it but not yet confirmed. This stays a live setup until that target actually prints.
Structure first, sweep second, order flow third, confirmation trailing right behind it, the full CAP sequence running exactly as labeled on the chart itself this time.
Epictetus said circumstances don't make the person, they reveal them. The CVD divergence revealed what the wick alone couldn't. The move since has been the market agreeing with what order flow already showed.
1INCH USDT LONG SIGNAL#100 1 INCH/USDT – Trade Setup (LONG)
📈 Position Type: LONG
🕒 Timeframe: 1H
📊 Market: Futures
💰 Entry Zone:
Market..0.07570
🛑 Stop-Loss:
0.073
🎯 Take-Profit Targets:
• TP1: 0.077
• TP2: 0.07875
• TP3: 0.08079
• TP4: 0.08340
⚙️ Leverage:
5 *10
▫️ After TP1, move SL to Entry + 0.2%.
▪️ Exit Plan:
• 40% at TP1
• 20% at TP2
• 20% at TP3
20% at. TP4
📌 Risk Management:
Risk only 1–2% of your capital per trade.
⚠️ Always check and confirm the setup on your chart before entering the trade.
STRK: Tight Bearish Compression at Triangle ApexSTRK: Tight Bearish Compression at Triangle Apex – Optimal Trend-Following Short Setup
STRK is drawing exceptionally close to a decisive breakdown moment as the price action converges into the final apex of a consolidation triangle. The current market structure leans heavily toward a bearish continuation scenario, with selling pressure clearly asserting its dominance. Following a period of narrowing volatility, the price is currently hugging the upper boundary of the triangle, which directly overlaps with the dynamic resistance of the MA100 trend moving average.
Based on the visual data from the 4-hour chart , two consecutive H4 candles have printed long upper wicks, highlighting a strong price rejection from the market. The probability of a downside continuation far outweighs any recovery scenario due to two key supporting factors: the macro trend remains firmly bearish, and the broader market lacks any clear signs of liquidity recovery.
The complete exhaustion of buying demand at this technical barrier creates a highly favorable edge for the bears. Triggering a Short position at current levels substantially optimizes the risk-to-reward (RR) profile. Traders can proactively place an exceptionally tight stop-loss order just above the $0.03 psychological round number zone to protect capital effectively, while extending the take-profit target down toward the $0.02 support floor.
Disclaimer: This is not financial advice, DYOR.
Bitcoin Accumulation Phase Played Out — The Pump Has Startedpart 1:
Bitcoin Accumulation Phase Played Out — The Pump Has Started 🚀🐋
Several months ago, I shared the idea that Bitcoin was quietly entering an accumulation phase . While fear dominated the market, the chart was telling a completely different story.
Fast forward to today...
The structure has unfolded almost exactly as projected.
The descending accumulation pattern completed, buyers stepped in at the projected demand zone, and Bitcoin has now begun its impulsive move higher. This is exactly why patience is one of the most valuable skills a trader can develop.
The next objective is becoming much clearer.
Key Technical Levels
🎯 71,300 is the first major resistance area.
This is where I expect Bitcoin to meet its first meaningful test after the recent breakout.
Should buyers maintain momentum, price is likely to rotate inside the blue distribution zone between:
71,300
78,000
Don't be surprised if Bitcoin spends some time consolidating within this range. Healthy trends rarely move in a straight line. Consolidation after an impulsive breakout often builds the fuel needed for the next expansion.
A successful break above 78,000 would confirm that the accumulation phase has fully transitioned into the next bullish leg, opening the door for considerably higher prices in the months ahead.
The whales didn't chase the breakout...
They accumulated while everyone else was waiting for lower prices.
Now the chart is beginning to tell the same story.
Perspective Shift 🔄
Most traders buy confirmation after the move has already started. Professionals accumulate during uncertainty because that's where the best risk-to-reward opportunities exist. The market rewards patience far more often than prediction.
Nothing I post is financial advice. It's perspective. I've mastered the art of prognosis, but you are the one behind the trigger. Always know your levels, and respect your risk.
One Love,
The FXPROFESSOR 💙
BTCUSD H1: Uptrend Still IntactBitcoin is maintaining a stable bullish structure above a long-term trendline, with the key support zone at 61.500–62.000 below still untested throughout the entire rally.
I'm favouring buys if price pulls back to retest the trendline around 65.000–65.300, stop loss below the key support zone at 61.300, first target at 66.500 and a further target at 67.000 if the upside momentum continues strongly.
If price loses the key support zone and closes below 61.300, the entire bullish structure would need to be reassessed, and I'll stay on the sidelines waiting for a new signal.
This is just my personal take based on technical analysis. Wishing you successful trading.
Midnight NIGHT price analysis⚠️ $NIGHT — caution advised
If you’re holding or trading #Midnight, this is the moment to stay extra careful.
📉 OKX:NIGHTUSDT.P situation:
As long as price remains below $0.065,
there is a strong probability that the current pattern resolves to the downside.
🎯 Potential targets:
🔹 Mid target: $0.028
🔹 Final target: around $0.015
At this stage, the structure is quite clear:
🔻 below key level → sellers in control
🔻 any bounce may just be part of a larger move down
❓Do you think #NIGHT can hold here, or is the downside already in motion?
______________
◆ Follow us ❤️ for daily crypto insights & updates!
🚀 Don’t miss out on important market moves
🧠 DYOR | This is not financial advice, just thinking out loud
Bitcoin: Bulls Face a Bigger Test But Must Be RespectedHigher highs respected
Bitcoin has now printed another medium-term higher high, reinforcing the current uptrend. As long as price continues producing higher highs and higher lows, the bulls deserve the benefit of the doubt.
Major resistance ahead
Price is now approaching a significant confluence of resistance between $66,000 and the 0.382 Fibonacci retracement at $66,322, with the previous swing high at $67,292 sitting just above. This area is likely to attract increased selling pressure.
Long-term trend still bearish
Despite the recent recovery, the 21/8-weekly EMAs remain bearishly crossed, highlighting that the broader trend has yet to turn bullish. Bulls will need to reclaim higher resistance levels before that longer-term picture begins to improve.
Momentum slowly improving
RSI continues to recover from recent lows but remains below the 50 level, highlighting that longer-term momentum is still bearish. Meanwhile, StochRSI is climbing from oversold territory, supporting the recent recovery.
Limited resistance beyond
Should bulls successfully clear the $66,000-$67,292 resistance zone, there is relatively little resistance until the 0.618 Fibonacci retracement at $72,204, opening the door to a stronger recovery.
In Summary
Bitcoin has earned the benefit of the doubt after printing another medium-term higher high, but the recovery is now approaching a critical test. Although the 21/8-weekly EMAs remain bearishly crossed, price is challenging the major $66,000-$67,292 resistance zone. A decisive break above this area would strengthen the bullish case and expose $72,204, while another rejection would reinforce the importance of the broader weekly downtrend.
$DOGE Is Testing a Key Level... Breakout or Another Rejection?DOGE Is Testing a Key Level... Breakout or Another Rejection? 👀
DOGE has been respecting this descending trendline for quite some time, and now price is getting very close to a decision point. Personally, I'm not interested in chasing the move before confirmation. If buyers can push above the trendline, close a strong 4H candle above it, and hold that level on a retest, that would be the first sign that the trend might finally be changing. RSI is also trying to stay above the 50 level, which adds a bit more confidence, but on its own that's not enough for me.
If the breakout is confirmed, I'll be watching the next resistance levels as potential targets because momentum can build quickly once this trendline is broken. On the other hand, if price gets rejected here again and loses the 0.0709 support, this bullish setup is no longer valid and we could see another move lower before any real recovery starts. For now, patience is the best strategy. I'd rather wait for the market to confirm the direction than enter too early and get caught in a fake breakout.
BTCUSD H4: Can the Ascending Channel Continue to Drive the UptreBTCUSD continues to trade within a well-defined ascending channel, maintaining a strong bullish structure with consistently higher highs and higher lows. After a brief pullback, the price quickly regained momentum and is once again trading near the upper boundary of the channel, indicating that buyers remain firmly in control.
However, the 65,300–66,000 USD area is a key decision zone. If BTCUSD holds its current structure and breaks decisively above the upper boundary of the ascending channel, the bullish trend could extend toward the 68,000 USD resistance level.
As long as buyers continue to defend the ascending channel, BTCUSD has the potential to establish another bullish leg in the short term.
Trading Plan:
Entry: Look for Buy opportunities after a bullish confirmation signal near the lower boundary of the ascending channel, or following a confirmed breakout above the upper boundary.
Target: 68,000 USD
Invalidation:
The bullish outlook will be invalidated if BTCUSD closes below the lower boundary of the ascending channel on the H4 timeframe, signaling that the short-term bullish structure has been broken and increasing the risk of a deeper correction.
SEI / SEIUSDT Long Setup | Breaker Block ReclaimMARKET ANALYSIS
SEI is currently reacting from a key technical area highlighted on the chart.
As long as the protected support zone remains intact, the bullish market structure remains valid and higher liquidity targets may continue to attract price action.
A breakdown below the invalidation level would weaken the current bullish scenario and require a reassessment of market conditions.
📍 Entry, Stop Loss and Take Profit levels are marked directly on the chart.
━━━━━━━━━━━━━━
⚠️ DISCLAIMER
This publication is provided solely for educational and market observation purposes.
Nothing contained in this analysis should be considered financial advice, investment advice, or a recommendation to buy or sell any financial instrument.
All trading and investment decisions remain solely the responsibility of the individual trader.
Always conduct your own research and apply proper risk management before entering any position.
━━━━━━━━━━━━━━
🎯 PARALOG
▪️Crypto Market Analysis
▪️BTC Futures Signals
▪️Bitcoin & Altcoin Market Analysis
Precision • Momentum • Timing
━━━━━━━━━━━━━━
Exchange: #MEXC Futures
#bitcoin #btc #crypto #futures #technicalanalysis
BTC Failed Breakdowns Set Up a Tactical Trade to 70KBTC has failed to break down under 60k multiple times. While I see little reason for the BTC bear market to be over, with things like STRC trading at 87 and froth still across the yield farming sector, BTC itself has a decent technical setup. The 20ema is crossing the 50sma, near-term relative strength is okay, and we have seen multiple failed breakdowns.
Many are chasing a rally into the 200sma in the low 70k region. While I do not see BTC as a good investment at these levels, the RR is not bad for a quick trade to 70k. If general risk sentiment does not crash due to elevated oil prices and Iran escalation, the long window is open.