 Short
Short
BTCUSDTBitcoin (BTCUSD) 4H Analysis: Testing Key Range Support
Bitcoin is currently trading around $76,950, sitting right on the lower boundary of a 24-day consolidation range between $76,000 and $79,000.
Bearish Breakout Scenario: A decisive candle close below the $76,000 support zone (specifically clearing $75,400) will confirm a breakout from this multi-week range, opening the door for a deeper correction toward the primary target at $72,300.
Trade Trigger: Patience is key. Wait for a full candle close below $76,000 to confirm the move and avoid getting caught in a liquidity sweep or fakeout.
Risk Management: Invalidations / Stop-Loss can be placed above the breakdown level (around $77,500) targeting $72,300 for an optimal Risk-to-Reward ratio.
AMIRHASSAN SALEK
امیرحسن سالک  Short
Short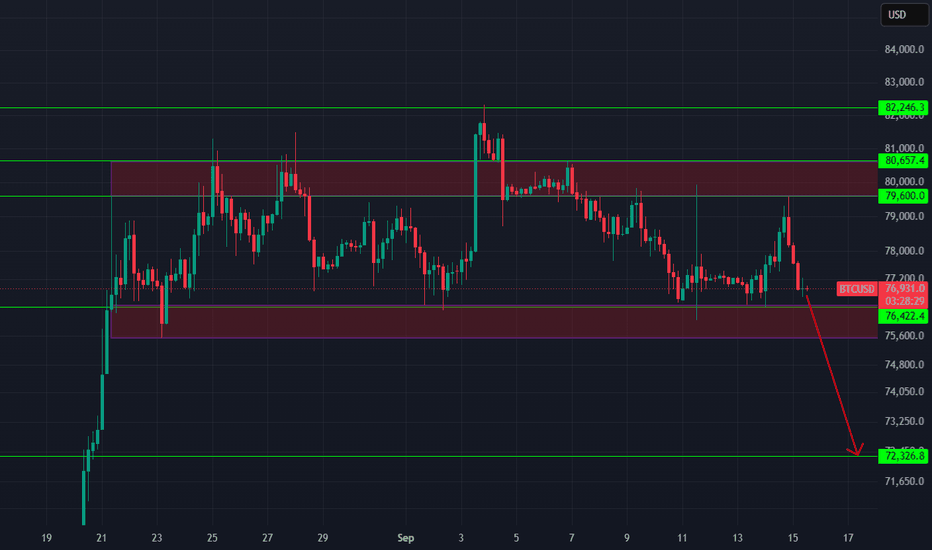
BTCUSD: $80K Rejection — Key Levels Before the Fed DecisionBTCUSD is currently facing short-term pressure. The market is in a tug-of-war between a weakening short-term trend and the possibility of another rebound.
The Federal Reserve's decisions and the vote on the U.S. Clarity Act are key macroeconomic catalysts. Rising US Treasury yields and a stronger dollar are currently limiting upward momentum, while the $76,000 to $77,000 range remains a key area of buying support.
As long as BTC remains below $80,000, any rebound is likely to encounter selling pressure. If the market can clearly recover the $80,200 level, the bullish momentum will return, and it may once again challenge the $81,500–$82,200 range.
On the downside, a drop below $76,000 would increase the likelihood of a deeper pullback to $73,000.
BITSTAMP:BTCUSD BINANCE:BTCUSD OANDA:BTCUSD BITFINEX:BTCUSD The Elephant Jungle 9/15/26 Page 4SO RED, WHAT’S THE PLAY?
As of right now, I am watching for confirmations to take a long from this 15m Order Block. If the confirmations are not there, I am not forcing anything. I will simply wait and see if the Bears can sweep the Range Low and give me another opportunity.
As for shorts, I am watching the 15m Order Block above, but if I do not get the confirmations I want from there, I am looking at the 1H Order Block higher up.
Either way, I am not chasing price.
Today looks like it could get interesting, but it also looks like the type of day where a lot of traders could get chopped up trying to predict every little move.
That is why today, confirmation is a MAJOR KEY.
DJ Khaled voice.
The market does not owe me a trade just because I opened TradingView. If price reaches my level and gives me my confirmation, I will take my shot. If it does not, I will sit back and let the Bulls and Bears beat the hell out of each other without me.
Sometimes the best trade is the one you had the discipline not to take.
That is my battle plan for today, but I want to hear yours. What are you seeing in the market? Are you riding with the Bulls, running with the Bears, or sitting on the sidelines waiting for one of them to show their hand?
Drop your thoughts in the comments.
And like always, trade safe, use good risk management, wait for your levels, and most importantly, wait for your confirmations.
The Jungle will always give you another opportunity.
Your job is to make sure you are still around when it does.
Until next time... BTC has spent four hours basing on its volume point of controlBITSTAMP:BTCUSD , New York session read from my KenKem Master Volume Profile (MVP) indicator & strategy.
CONTEXT
The New York session opens at 12:30 UTC. After the 79,579 high, price sold off and has been rotating in a tight 76,650 to 77,170 range on the master Point of Control for about four hours. It sits below VWAP (77,258) and below the 25/100/200 EMAs, which are stacked lower, and the net-volume read still leans to sellers on thin volume.
KEY ZONES
• Resistance / supply: 77,080 (range top, EMA 25), then 77,260 (VWAP and the M5 value area high)
• Support / demand: 76,730 (value area low), then 76,530 (master value area low)
• Point of Control (volume magnet): about 76,900
SCENARIOS (to watch, NOT signals)
📉 Bearish: a close below 76,730 opens 76,530, the master value area low (the base gives way).
📈 Bullish: a close back above 77,080 opens 77,260, where VWAP and the value area high meet; rejection there is likely on first test.
↔️ Range/unclear: stuck between 76,730 and 77,080 → stand aside until a decisive close.
⛔ Invalidation: a close above 77,260 voids the bearish lean in this map.
WHAT THE MVP TOOL IS SHOWING
The Master Volume Profile plots rolling value areas (VAH/VAL), the Point of Control, and a net-volume pressure read to locate where volume is building or drying up. This idea is the qualitative output of that tool; the strategy's internal thresholds, gating and entry/exit logic are not disclosed.
Built with the KenKem Master Volume Profile indicator & strategy.
Technical analysis only, by KenKem's algorithm. NOT financial advice. Trade your own plan and manage your risk.
XMR ForecastKUCOIN:XMRUSDT The logic behind this trade is based on the higher-timeframe bearish trend. The bearish impulses remain strong, while the bullish corrective moves are relatively slow and weak.
On the lower timeframe, we can also see a strong bearish move followed by a slow bullish correction, which increases the probability of another bearish leg.
⚠️ Risk Disclaimer
All analyses, market views, and scenarios presented on this page are provided for informational and educational purposes only and should not be considered financial advice or a recommendation to buy or sell any financial instrument.
Financial markets involve substantial risk, and none of the scenarios presented here are guaranteed to occur. Each trader is solely responsible for their own trading decisions, risk management, and any profits or losses resulting from their trades.
Please consider your own financial situation, risk tolerance, and trading strategy before making any trading decision. Do not rely solely on the information provided on this page when making investment or trading decisions.ll risk. Controlled trade. 🎯  Short
Short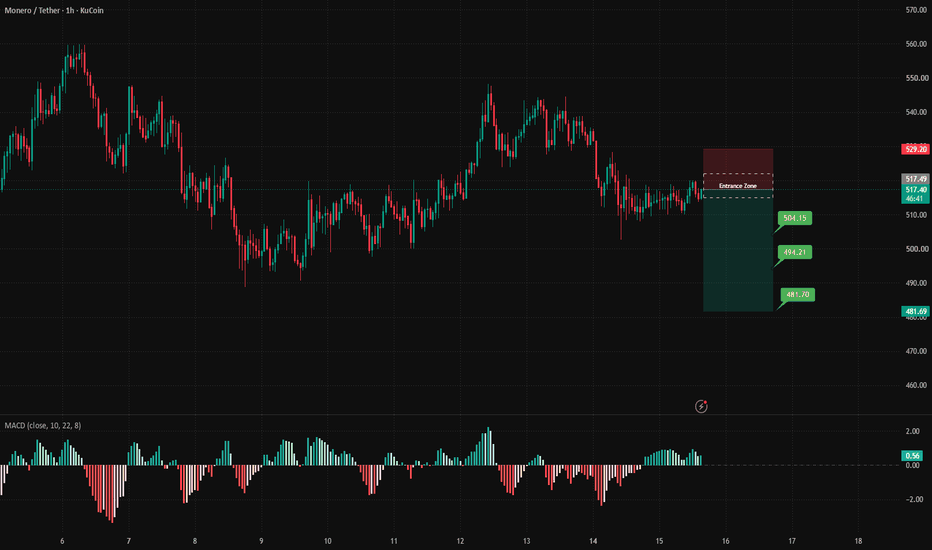
Where Volume Traded Can Matter More Than WhenMost traders read volume vertically. They see a large volume bar and know that significant activity occurred during that candle, but that still leaves an important question unanswered: where did that trading actually take place?
Volume at price gives a different view of market structure because it separates areas where participants repeatedly accepted price from areas the market moved through quickly.
Imagine CRYPTOCAP:BTC trades between $78,000 and $82,000 for several days, but most of the volume occurs between $79,500 and $80,500. Price occasionally reaches the edges of the range, yet relatively little business is completed there.
That tells you the entire $4,000 range should not necessarily be treated equally.
The area around $80,000 has become an accepted region. Buyers and sellers repeatedly found enough opposing interest to transact there, positions accumulated, and the market spent considerable time around that price. If CRYPTOCAP:BTC leaves the range and later returns, this area can become important because many previous participants have a reference point there.
Low-volume areas tell a different story.
Suppose CRYPTOCAP:BTC breaks above $80,500 and moves rapidly toward $82,000 while relatively little volume trades between the two prices. The market has travelled through that area, but it has not necessarily established much acceptance there.
If price later re-enters that low-volume region, there may be less historical participation to slow the move. Instead of expecting every previous candle or minor level to create support or resistance, traders can watch whether price moves quickly through the area again until reaching a region where substantial trading previously occurred.
This creates a useful distinction.
High-volume areas are locations where the market previously found balance. When price returns, watch whether it begins rotating and spending time there again. If it does, the market may be rebuilding acceptance around that price.
Low-volume areas are locations where the market previously found less agreement. When price enters them, watch whether it again moves efficiently toward the next area of heavier participation. If price instead begins spending time and building volume inside the area, something has changed: a previously rejected price region is now gaining acceptance.
This is also why volume at price should not be used as an automatic support-and-resistance tool. A high-volume area does not guarantee a reversal, and a low-volume area does not guarantee fast movement.
The useful information comes from comparing historical participation with current behavior.
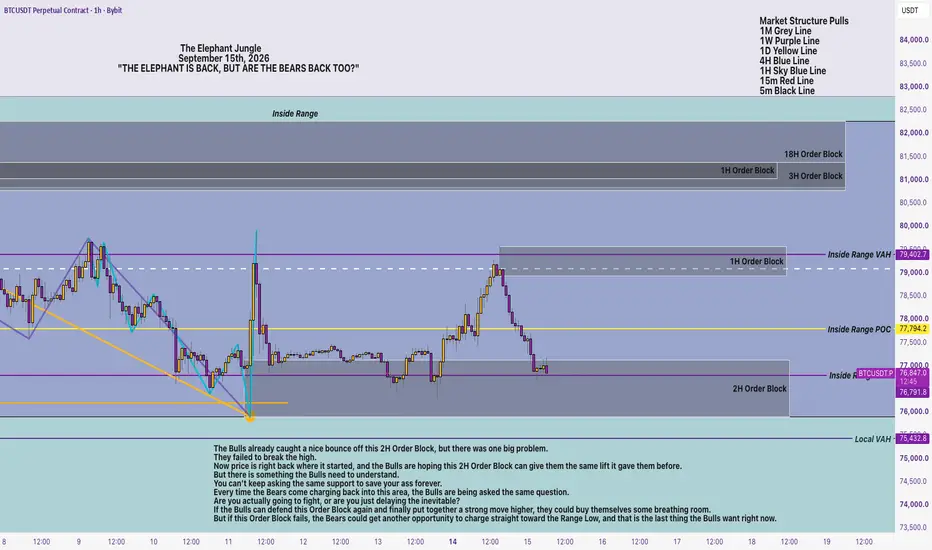
Price tells you where the market has travelled. Volume at price helps show where participants previously wanted to stay — and whether they still want to stay there when price returns. The Elephant Jungle 9/15/26 Page 2As of right now, the Bulls are relying heavily on the Inside Range VAL for support, and this level might be more important than it looks.
The Bulls are basically standing on the edge of the ring right now. If they lose this support, they are going to give the Bears another opportunity to attack the Range Low.
And that is where things could get ugly.
If the Bears swipe the Range Low, the Bulls could still have one more line of defense around the Local VAH. That area could give the Bulls another opportunity to step in, defend themselves, and possibly turn the breakdown into another trap.
But if the Bulls lose that too?
Oh boy.
Now the Bears might have an open lane to start dragging price back toward 67K.
And the Bulls better hope these Bears do not build too much speed and momentum on the way down, because if they do, we might have to call Doc Brown and fire up the DeLorean.
These Bears might hit 88 miles per hour and send Bitcoin traveling all the way back in time to 55 like Marty McFly.
But before we start screaming “Great Scott!” and preparing for 55K, remember what we talked about on the Daily.
The Bears still have work to do.
They need to break support, take out the Range Low, and prove they can actually hold price below these levels. Until that happens, the Bulls are still alive, and another Bear trap could be waiting right around the corner.
The Bears might have the DeLorean fueled up, but somebody still has to hit 88 miles per hour. Long 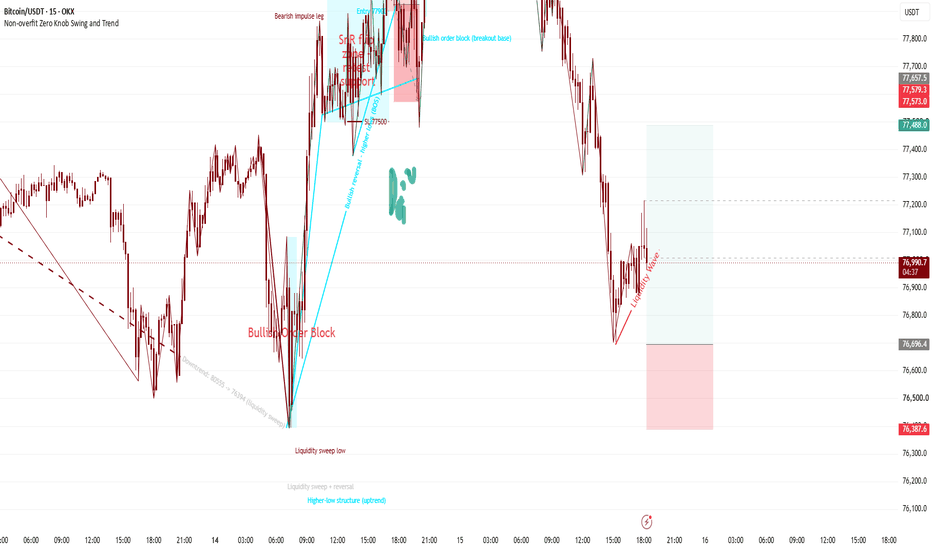
BTC Failed Under 78,028 And Is Working Toward 76,237.BTC Failed Under 78,028 And Is Working Toward 76,237.
Bitcoin never reclaimed 78,028 after the weekend sweep of 79,852 and has spent two sessions drifting lower, down 1.50% to 77,004 with 76,237 the next level beneath it and 76,030 - Friday's sweep low - under that. The line that capped it all last week is now firmly overhead, and the failure to reclaim it is what turned the weekend high into a sweep rather than a break. The two timeframes disagree sharply: the hourly carries a long-reversal state on elevated volume while the 4H sits at a short read with conviction near the bottom of its scale. Neutral.
Resistance: 78,028 - the line overhead
Key resistance: 79,318 - the level rejected four times
Current price: 77,004
Support: 76,237 - the next level down
Key support: 76,030 - the sweep low
Structural floor: 74,182 - deeper floor
Two paths from here:
It works down to 76,237 and retests 76,030. Continuing under 78,028 puts the recent low in play, and a close beneath 76,030 would finally break the range that has held since last week, opening the space toward 74,182 with nothing named in between.
It reclaims 78,028 and the drift ends. Getting back above the line would make these two sessions a pullback inside the range rather than the start of the next leg, though 79,318 still caps everything above it.
Both ends of this range have been swept in the last four sessions and price is grinding back toward the low end. 78,028 above, 76,030 below - and the low is the one being approached.
Built with SYNTHESIS v3.3 | SOM / ACE / IMP / SYNTHESIS
Study, not financial advice. Bitcoin Near a Major PRZ: Can BTC Hold Above $80,000?Bitcoin ( BINANCE:BTCUSDT ) moved higher over the past few hours following Trump’s tweet, while the announcement also supported a recovery in U.S. equities and triggered a temporary rise in Bitcoin and gold.
BTC is now trading near the Potential Reversal Zone(PRZ) , the Cumulative Short Liquidation Leverage($80,620-$79,800), and the key trading level of $79,800.
Can Bitcoin establish itself above $80,000, or is another correction about to begin?
Macro Outlook
The recent recovery in U.S. stock indices helped improve short-term risk sentiment and supported Bitcoin’s move higher.
However, the current rally has not been accompanied by particularly strong trading volume, which keeps the risk of another correction alive.
Technical Analysis
From an Elliott Wave perspective, Bitcoin could still be developing a Triple Three Correction(W-X-Y-X-Z).
BTC is also trading inside an important technical confluence formed by the PRZ, Cumulative Short Liquidation Leverage, and the key $79,800 trading level.
Liquidation data shows approximately $909 million in short positions at risk above $80,600, making this area an important liquidity target.
At the same time, approximately $807 million in long positions are at risk below $74,860, creating another major liquidity area on the downside.
💡 Educational Note: Large liquidation clusters can attract price because forced position closures create additional market orders, but reaching a liquidity zone can also trigger a sharp reversal once that liquidity is absorbed.
I expect Bitcoin to start declining from the Potential Reversal Zone(PRZ) and the Cumulative Short Liquidation Leverage, with an initial target around $77,800.
If bearish momentum increases, the correction could extend toward $76,600.
Trade Setup
First Take Profit(TP): $77,800
Second Take Profit(TP): $76,600
Stop Loss(SL): $80,890
Key Trading Levels: $79,800 _ $77,500
Which level do you think Bitcoin will reach first?
🔴 $76,600
🟢 $80,890
📌 Bitcoin Analysis(BTCUSDT), 2-hour time frame.
🛑 Always use proper risk management and set a Stop Loss(SL) for every position.
🚀 If this analysis helps your trading plan, a BOOST would help more traders discover it. Short 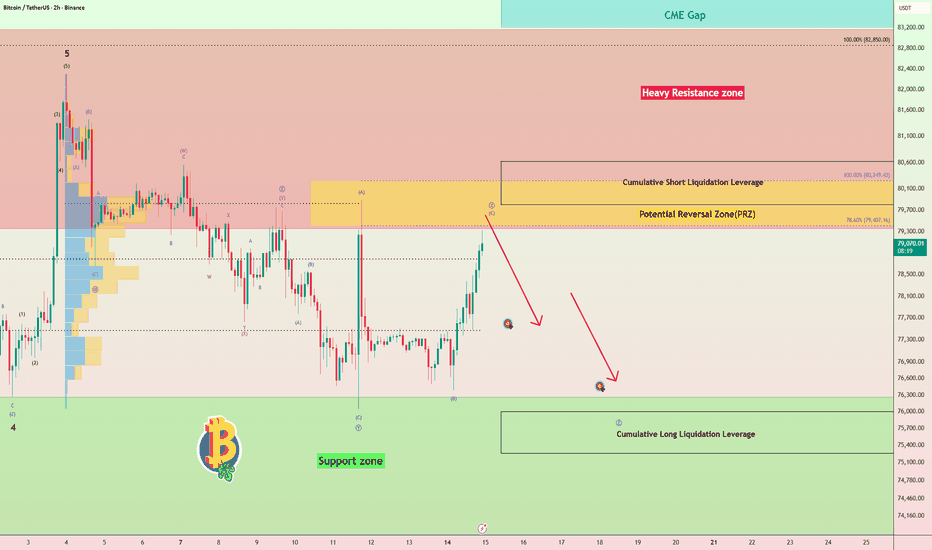
The Elephant Jungle 9/15/26 Page 1About 29 days ago, the Bulls made a dramatic pump in the market that sent price flying up to around 82.2K. It was a strong move, but the Bulls just could not push far enough to swipe that 1M High.
And that is where things started getting interesting.
Since the Bulls could not take out the high, the Bears stepped in and took control, driving price down and taking out the low. But the Bulls were not ready to wave the white flag just yet. They only allowed the Bears to create a Swing Failure Pattern, then came charging right back for another attempt at taking out the high.
For a moment, it looked like the Bulls might actually pull it off.
Nope.
The Bulls could only push so far before the Bears said, “Give me that ball back.” The Bears took control again that same day and sent price right back down.
Since then, the market has spent the last few days trying to figure out who actually wants control. Price has been moving sideways, the Bulls have been fighting, the Bears have been fighting, and neither side has been able to land the knockout punch.
But today, things are starting to get interesting again.
It looks like the Bears might finally be ready to make another statement and attack that low one more time. If the Bears can take it out and get a solid body close below it, we might be able to kiss the Bulls goodbye for a while as price starts working its way back down toward 67.2K, or possibly even lower.
But hold up.
That is only one view of the market.
The Bulls still have a chance to defend this area and take control from here. Even if the Bears do take out the low, the Bulls could pull the same trick again and turn the breakdown into another SFP, trapping Bears who thought the breakdown was finally here.
So right now, this is not the place to marry a direction.
This is the place to watch the fight.
The Bears are standing at the Bulls’ front door, but they have not kicked it down yet. Until we get confirmation, both sides still have a path to victory.
And this Daily chart is only showing us the battlefield from the sky.
Now let’s drop down to the 4H Time Frame, because that is where we can get a much better look at what these Bulls and Bears are really up to.