Long
Long
PONKE AT MAKE-OR-BREAK SUPPORTYello, Paradisers! Is PONKE about to trap impatient bears at one of the most important support zones on the chart before attempting a much stronger upside expansion?
💎PONKEUSDT is currently trading around $0.0207 after another rejection from the upper boundary of the 4H falling wedge. While the lower timeframes remain bearish, the bigger picture is becoming increasingly interesting because price has once again reached a major Daily support area around $0.0198–$0.0186.
💎What makes this zone especially important is the market structure developing around it. PONKE has now tested approximately the same support area three times, creating a potential triple-bottom structure. At the same time, this support also aligns with the lower boundary of the falling wedge and an important former Daily resistance zone that is now being tested as support.
💎This creates a clear conflict between the timeframes. The 1H and 4H structures remain bearish, meaning there is still no confirmed short-term reversal. However, the Daily and Weekly structures remain bullish, which is why aggressively chasing shorts directly into this support would carry significantly worse risk-to-reward.
💎For the bullish scenario to gain confirmation, PONKE first needs to hold the current support and reclaim the falling-wedge resistance. Above that, the $0.0230–$0.0235 region becomes the next important obstacle, where the 4H resistance and high-volume trading area are located.
💎A successful breakout and acceptance above this region could open the way toward the next major Daily resistance zone around $0.0270–$0.0280. That would represent a meaningful expansion from the current price and could quickly bring momentum back into the market.
💎However, confirmation matters. A temporary bounce from support is not enough to declare the correction finished. Until PONKE breaks the falling wedge and starts closing above the nearby resistance levels, the short-term bearish structure technically remains intact.
💎The bullish thesis becomes significantly weaker if price loses the $0.01801 support area on a confirmed candle closing basis. Such a breakdown would invalidate the current triple-bottom idea and indicate that sellers remain in control.
💎This is exactly the type of situation where patience becomes more valuable than prediction. The potential upside is attractive, but entering before confirmation means accepting unnecessary risk. Professional traders do not need to catch the exact bottom; they need to participate when the probabilities become favorable.
Strive for consistency, not quick profits. Treat the market as a businessman, not as a gambler. Discipline, patience, and waiting for confirmation are what keep traders inside the winner's circle.
MyCryptoParadise
iFeel the success🌴  Long
Long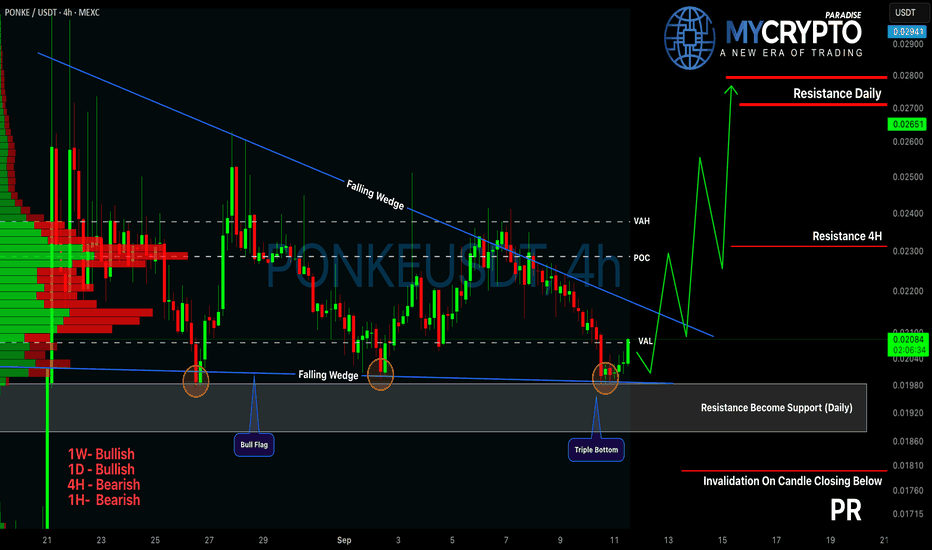
thetausdt long Roddy01-SIGNALSPROVIDERInstructions:
Entry point: yellow
Stop loss: red
Take profit: green or blue
👉Leverage x 5-10-20 for crypto
👉Leverage x 20-50-100 for commodities, stocks, indices, and forex
👉Margin 1-5% max.
Always practice risk and money management.
Invest a maximum of 5% on any trade or across all your trades.
Invest only what you can afford to lose, as no one is in control of the market.
👉Our analyses are primarily based on:
breakouts: two trend lines (ascending and descending) and a line indicating a horizontal breakout.
chart patterns: shoulders and head, triangle parttern, elliott impulse, etc etc.
We don't always have the time to track them at all times or to represent them visibly, given the numerous signals, the number of channels to manage, and especially because of the often rapid pace of market movements.
indicators: We associate at least two indicators with this technique.
👉Depending on the circumstances, we use specific indicators, often setting 3 or more take profit levels.
👉Indeed, there are good days in trading and also bad days. No one can promise to win every trade, and like all traders worldwide, we also experience stop-loss orders. However, we win more than we lose and remain positive.
👉You can close the position before or after the take profit orders indicated by the green lines if you are personally satisfied; the same applies to stop loss orders.
👉We must stay positive, clear-headed, and humble.
We must stay courageous and, above all, prudent regarding market reversals that no one can control
👉we cannot provide all instructions or all trades here on this channel.
such as:
⚡Move your stoploss
⚡Put B.E (break even)
⚡re-entering the trade at the same entry point or lower.
⚡revealing our high-performance indicators and teaching you how to configure and use them.
⚡recovery signals provided in the event of—or following—a stop-loss (SL) hit.
⚡personalized discussions, instructions, and answers.
Good luck to us all, and may God guide us. Amen.  Long
Long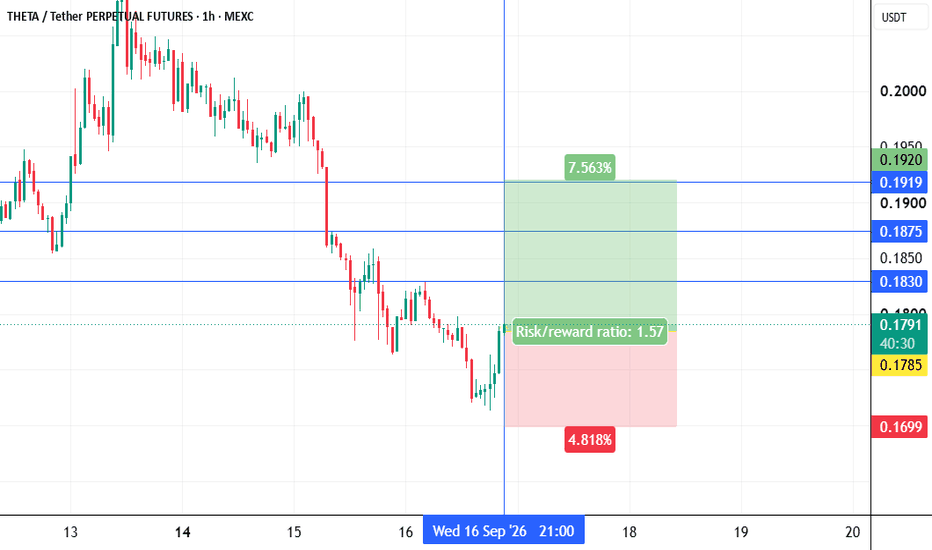
 Long
Long
 Short
Short
ENA 1D – Retesting Breakout Trendline After Explosive SpikeEthena is trading around 0.1548 on the daily timeframe after a massive spike from the 0.072 low in July, now consolidating right at the long term descending trendline that capped this pair since February and was decisively broken during the September rally.
The broader structure shows a steady downtrend from the February high near 0.098 through a series of lower highs into July, where price finally based and began building a shorter term ascending trendline off that 0.072 low. That trendline held through August, with higher lows forming near 0.079 and again closer to 0.089, setting up the coiled structure that eventually exploded higher in early September. The spike carried price straight through the long term trendline and all the way to a fresh high near 0.190 before sellers took over, and the pullback since then has been sharp, dragging price back down through the 0.14 to 0.16 range as the market digests that move.
Price is currently sitting right on the long term trendline near 0.1548, with this level acting as the first real test of whether the breakout holds after such an aggressive expansion move.
Key Levels To Watch:
→ 0.1900 September spike high, breakout extension top
→ 0.1700 Recent swing high, resistance on a bounce
→ 0.1548 Current price, testing long term trendline
→ 0.1400 Range low, recent consolidation support
→ 0.0890 Short term trendline, higher low support
→ 0.0720 Trendline origin, July low
Holding the trendline here keeps the breakout structure valid, and a reclaim of 0.1700 opens the path back toward the 0.1900 spike high with room to test fresh highs if momentum returns.
Losing the trendline sends price back down to test 0.1400, and a deeper breakdown would bring the shorter term ascending trendline near 0.0890 back into focus as the next major support.
Hold the trendline and ENA continues building on its breakout. Lose it and this pullback extends toward the range lows below.
Bias stays cautiously bullish given the strength of the move that preceded this retest, but the reaction at this trendline is the level that decides the next phase. $PUMP | 4H | BUY SETUP |BINANCE:PUMPUSDT : Why I'm Buying The Fear
While the retail crowd claims the Pump.fun engine has lost its steam and the token is dead, the 4h chart is printing a clean, technical retest of its primary buying block with an asymmetric 1:5 risk-to-reward setup. 🚨
Current Structure:
Price: $0.003932
Reaction: Consolidating in a minor -1.40% pullback from its local high of $0.003988 on Sep 17/18, following a breakout from its $0.003450 bottom.
Pattern: Bullish Order Block Retest.
Bias: Bullish above the $0.003572 support level.
"The Level That Decides Everything":
The $0.003672 - $0.003572 Buying Order Block. Bids are queued at the $0.003672 entry price. If this demand zone holds on a retest, it confirms a strong trend reversal to clear local range resistance. A 4h close below $0.003572 invalidates the setup.
Targets: Target 1 at $0.003887, Target 2 at $0.004172.
The Move So Far:
Down 1.40% from its local high of $0.003988. On the macro scale, NYSE:PUMP is down 67.61% from its $0.01214 All-Time High (July 2025) and up +247.04% from its $0.001133 All-Time Low (October 2025).
Fundraising Breakdown:
Total Raised: $1.72 Million in VC seed funding for the platform. Its spinoff "Pumpcade" prediction market raised an oversubscribed seed round of $5 Million in April 2026 led by Jump Crypto and Foundation Capital at a ~$44M valuation.
ICO/IEO Entry Prices:
The public token sale/ICO began on July 12, 2025, at an entry price of $0.004. Compared to the launch price, the current price represents a ~0.98x ROI, completely wiping out the early premium.
Unlock Pressure Ahead:
Locked Supply: ~31.2% remains locked, with 68.8% unlocked and 46.8% actively in circulation (the remainder is held in custodian wallets).
Vesting: Vesting runs from July 12, 2025, to June 12, 2029, with approximately 9.2 Billion PUMP unlocking monthly to the team (20%), investors (13%), and ecosystem.
Key Levels:
Resistance 1 / Resistance 2: $0.003887 / $0.004172
Entry: $0.003672 (inside Order Block)
Support (range): $0.003672 - $0.003572
Invalidation / Stop Loss: $0.003572
Closing Thesis:
Pump.fun’s utility token remains the cleanest proxy for on-chain meme transaction flow. Despite the monthly 9.2B PUMP unlocks, the token has fully consolidated at its historical demand floor. If the $0.003572 floor holds, the 1:5.00 setup toward $0.004172 is highly compelling. Below it, the story flips. 🎯
Bullish above $0.003572. Below it, the story flips.
Not Financial Advice. ALWAYS DYOR.  Long
Long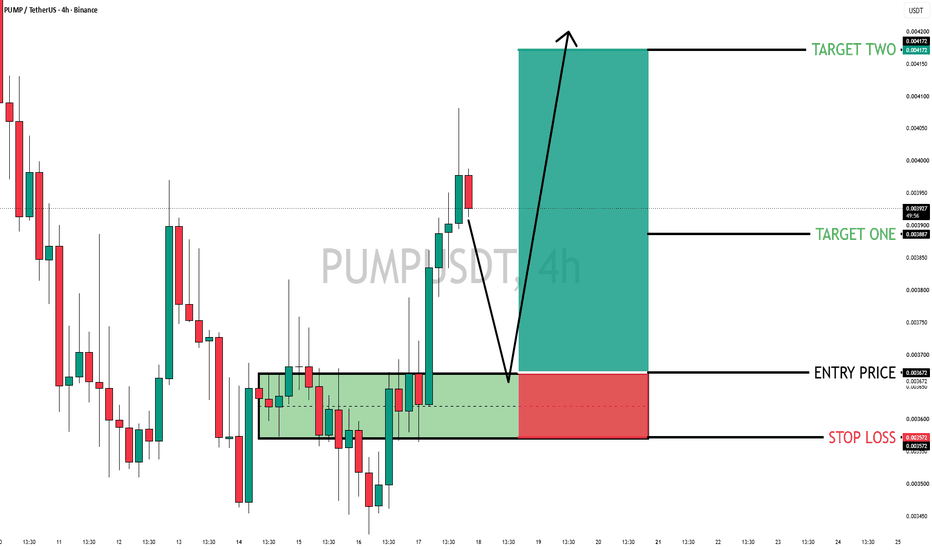
SOL: 102.50 Breakout & Retest | Sep 18, 2026Solana is bouncing from the 96–97 USDT area, but the recovery has not yet cleared nearby supply. This is a conditional long setup, not an immediate buy signal.
CHART STRUCTURE
On the Binance SOLUSDT 4-hour chart, price is around 101.10 USDT as of September 17, 2026, 20:53 CEST (18:53 UTC). The current candle is still open. The late-August rally peaked near 109–110, followed by lower swing highs around 106–107 and 103–104. The latest rebound is therefore still a countertrend recovery within that pullback.
The 102–103 area has acted as a repeated reaction zone. A completed 4h close above 102.50, followed by a successful retest, would support a recovery attempt toward the earlier supply zones. It would not, by itself, prove that the broader correction is over.
TRADE PLAN — SEPTEMBER 18, 2026
• Trigger: a completed 4h candle closes above 102.50 USDT.
• Confirmation: after that close, price retests 102.00–102.50 and a completed 15-minute candle closes back above 102.50.
• Illustrative entry: 102.50; maximum entry 102.75. If price runs away without the retest, skip the trade.
• Stop: 99.50 USDT. After entry, this is a price-based stop, not a wait-for-4h-close condition. Before entry, a break below 99.50 cancels this setup.
• Target 1: 106.00 USDT, near the earlier September supply zone.
• Target 2: 109.00 USDT, near the late-August swing-high area.
At an illustrative 102.50 entry, price risk is 3.00 USDT per SOL. Target 1 offers approximately 1.2R and target 2 approximately 2.2R before fees and slippage. A higher fill reduces both ratios. The 104 area is an intermediate obstacle: reaching either target is not guaranteed. Partial profit-taking at target 1 is one possible approach; moving the remaining stop to entry can lead to an early exit on a normal pullback.
INVALIDATION & TIMING
No confirmed breakout and retest, no trade. A brief wick above 102.50 is insufficient. All trigger and entry conditions must occur on September 18, 2026, between 00:00 and 23:59 UTC. If they do not, the entry plan expires. Targets may require more than one day; this is not a promise of a same-day move.
This is a spot-market price-structure scenario based on Binance data shown on TradingView. It is not a verified news or event forecast. Crypto can move sharply, and stops do not guarantee their execution price. Fees, slippage and venue-specific differences must be considered. No leverage is assumed. Educational analysis only, not personalized financial advice.
Status: Waiting for confirmation — no active entry signal.
BotTradeLab — Human judgment, AI-assisted analysis.  Long
Long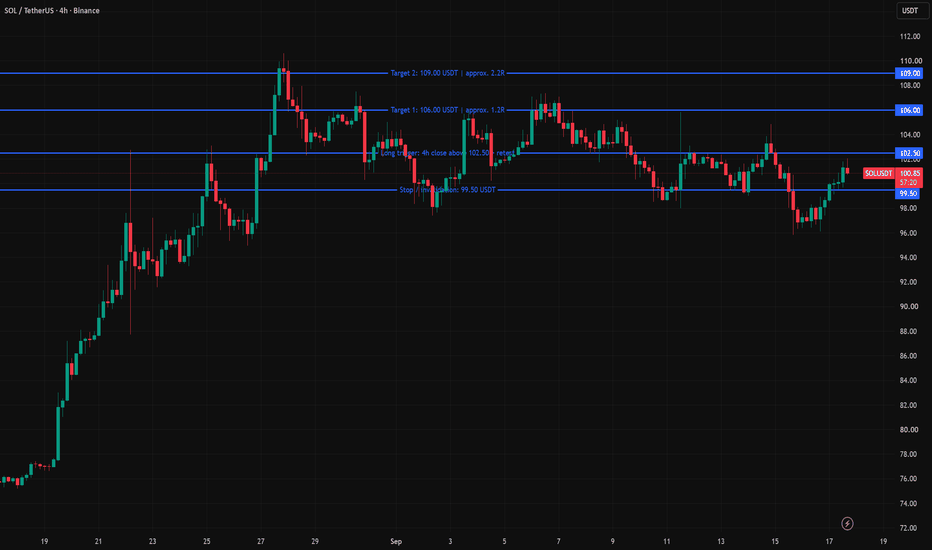
 Short
Short
BTCUSDT 5m - Lower high rejection at 77170 supply, short toward Structural analysis combining range/breakout mapping, supply-zone rejection at swing highs, and a liquidity sweep with lower-high confirmation for a short continuation setup.
Context: price rallied sharply from a multi-hour sideways range (76050-76600) up to a swing high near 77167, then reversed after a stop-hunt sweep below prior lows near 76011.
Key levels: 76950-77170 has acted as a repeated supply/resistance zone, rejecting price on two separate tests; the 76300-76400 area is the prior breakout base and now acts as support below.
Scenario: the second push into resistance printed a lower high (77087 vs 77167), and price is now consolidating with descending highs, favoring a short continuation back toward the 76300 support zone from current levels near 76745, with stop placed above the recent swing high at 76973.
Invalidation: a decisive close back above the 76973 swing high would invalidate the bearish continuation view.
Analysis timeframe: M5, chart displayed on M15.
Educational chart analysis only, not financial advice. Short 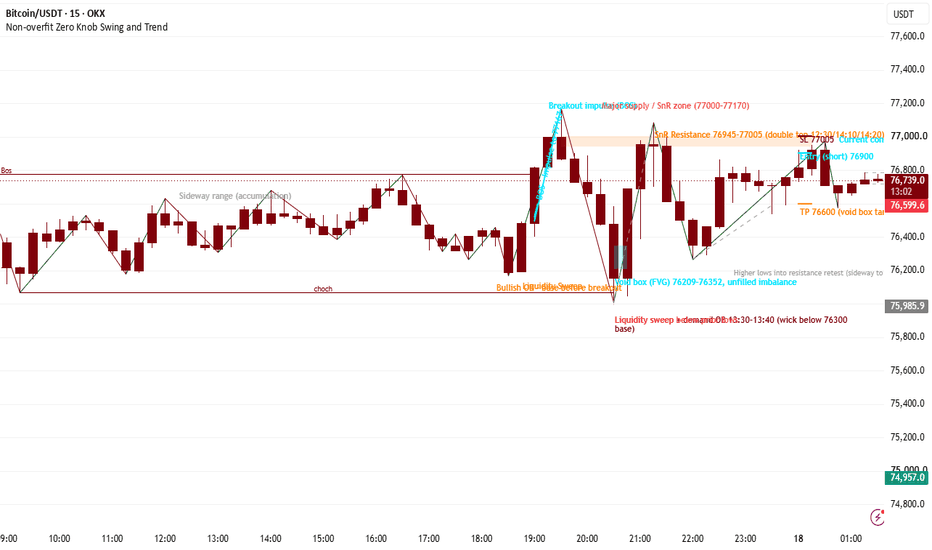
Long 
Long 
BTCUSD – Accumulation to Selling Zone Than Distribution🔥 **BTCUSD – Accumulation to Selling Zone Distribution** 🔥
Bitcoin has finished a rounded **Accumulation Phase** above key support (**$75,200 – $75,600**) and is expanding toward the premium **Selling Zone** near **$79,200** for an institutional short setup.
---
### 📊 **Technical Breakdown**
* **Accumulation Base:** $75,200 – $75,600 (Key Support Zone)
* **Supply POI:** $79,000 – $79,500 (Selling Zone / Premium Liquidity)
* **Target:** **$75,477.13** (Sell-Side Liquidity Pool)
---
### 🎯 **Execution Plan**
* **Bias:** Short 🔴
* **Sell Zone:** $79,000.00 – $79,200.00
* **Stop Loss:** $79,888.00
* **Take Profit:** $75,477.13
* **Risk/Reward:** **~3.6 : 1** ⚖️
---
💬 **Will BTC reject cleanly at $79.2k or push straight to $80k?**
👇 *Like & Follow for daily institutional SMC breakdowns!*
*⚠️ Educational purposes only. Not financial advice.*
Short 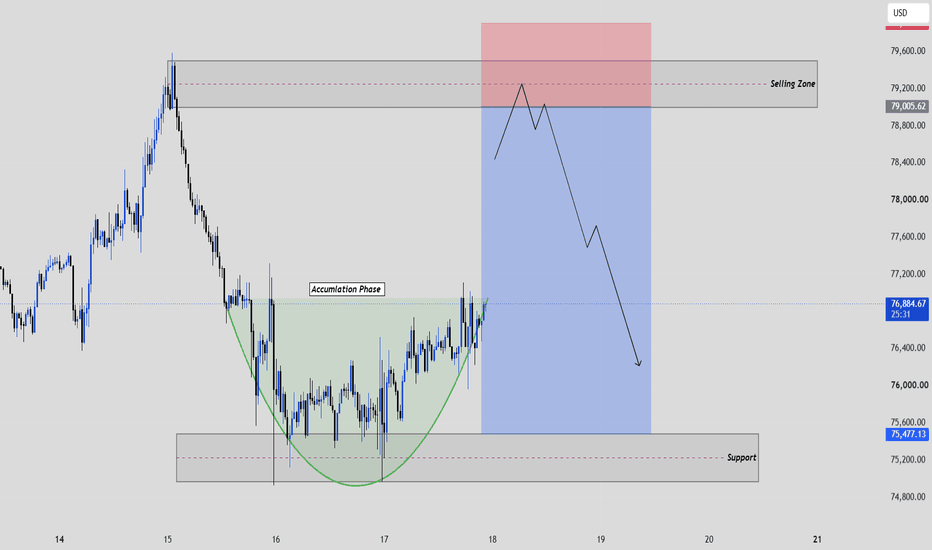
Short 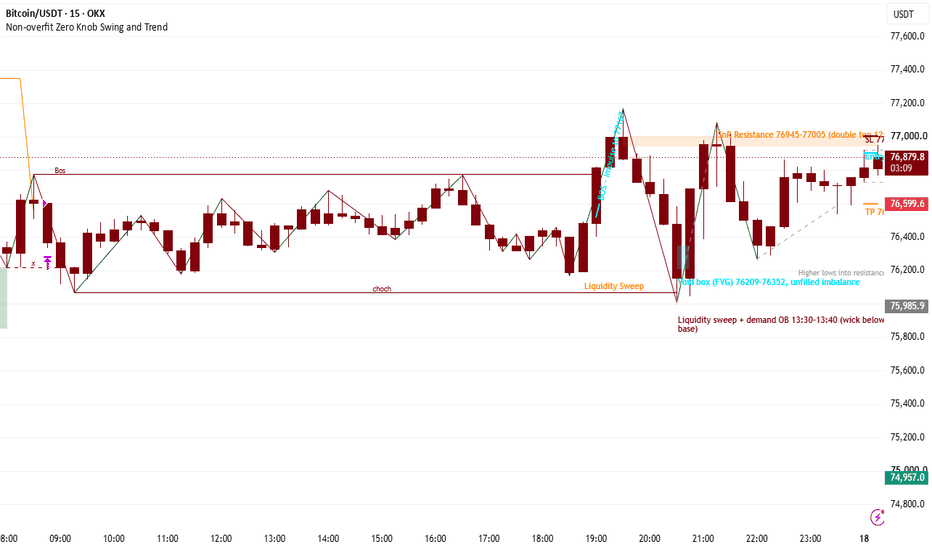
Long 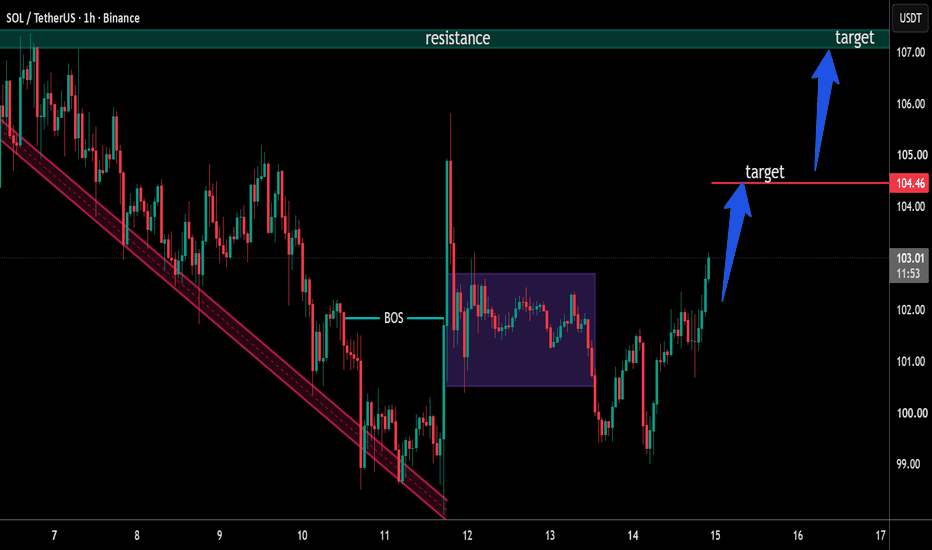
Bitcoin Consolidation bearish vs bullish rebound scenario Bitcoin is currently trading inside a high-volatility decision zone, with price respecting a broader descending structure the recent rejection from the 79,000 / 80,000 area brought sellers back into the market, while the $75,000–$75,400 zone is now acting as an important short-term support area.
Fundamentally, the market is also reacting to major macro and crypto-specific developments. Bitcoin has been under pressure ahead of the Federal reserve’s September 16 policy decision, with higher Treasury yields and expectations for tighter policy supporting the dollar and weighing on risk assets.
Resistance ; 77k / 79k
Support ; 74k / 73k
Tecnically holding below the descending trendline, keeping the short-term structure bearish a sustained break below 75k, could expose the lower channel area around 74k However, the market is also sitting near support, so a liquidity sweep and recovery remains possible. If buyers reclaim 76k and then break the descending structure, BTC could attempt a rebound toward 79k.
Hope you found this analysis helpful. 👍
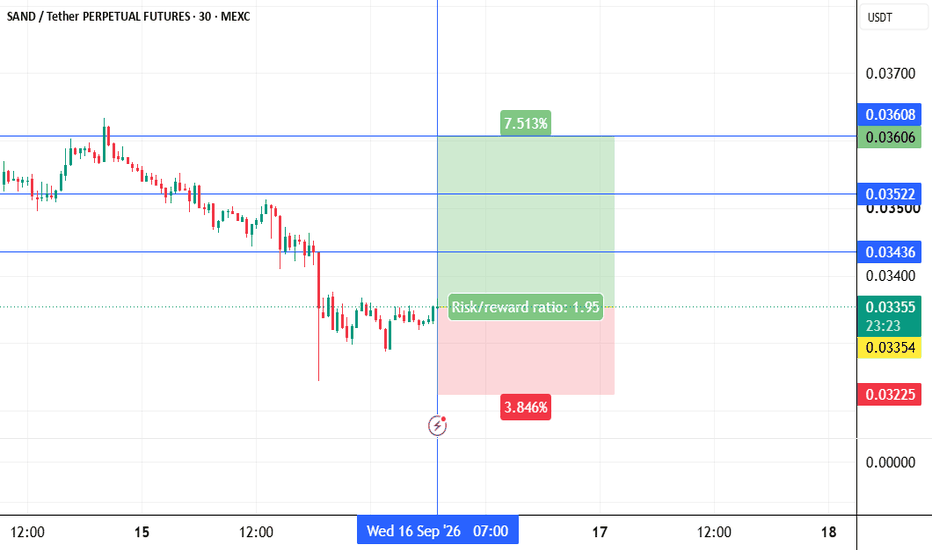
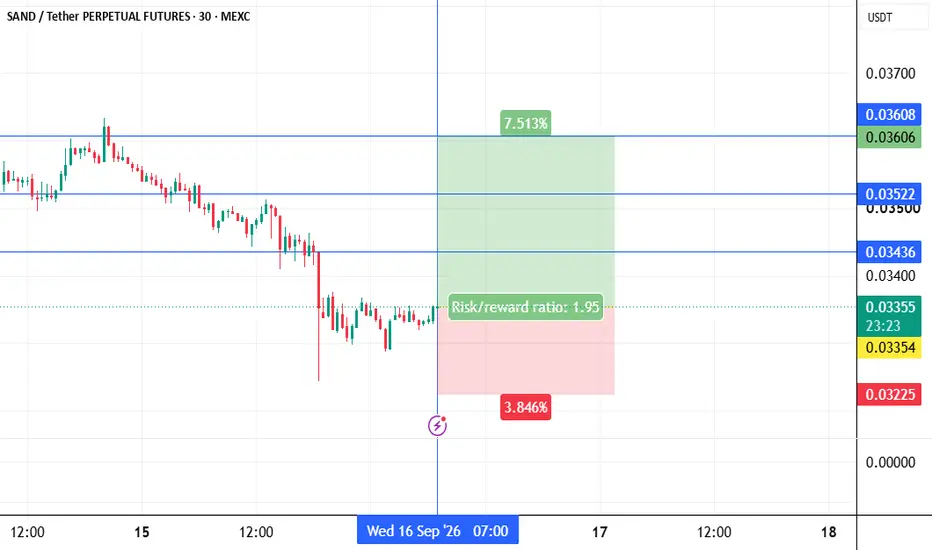
Like, Comment & Follow for more updates. sandusdt longInstructions:
Entry point: yellow
Stop loss: red
Take profit: green or blue
👉Leverage x 5-10-20 for crypto
👉Leverage x 20-50-100 for commodities, stocks, indices, and forex
👉Margin 1-5% max.
Always practice risk and money management.
Invest a maximum of 5% on any trade or across all your trades.
Invest only what you can afford to lose, as no one is in control of the market.
👉Our analyses are primarily based on:
breakouts: two trend lines (ascending and descending) and a line indicating a horizontal breakout.
chart patterns: shoulders and head, triangle parttern, elliott impulse, etc etc.
We don't always have the time to track them at all times or to represent them visibly, given the numerous signals, the number of channels to manage, and especially because of the often rapid pace of market movements.
indicators: We associate at least two indicators with this technique.
👉Depending on the circumstances, we use specific indicators, often setting 3 or more take profit levels.
👉Indeed, there are good days in trading and also bad days. No one can promise to win every trade, and like all traders worldwide, we also experience stop-loss orders. However, we win more than we lose and remain positive.
👉You can close the position before or after the take profit orders indicated by the green lines if you are personally satisfied; the same applies to stop loss orders.
👉We must stay positive, clear-headed, and humble.
we cannot provide all instructions or all trades here on this channel.
Good luck to us all, and may God guide us. Amen.  Long
Long