Trading Roadmap | Gann · Lesson 01 — Price and TimeLesson 01 - Price and Time
Difficulty: (Beginner)
A new course starts here. Almost every tool covered so far answers one question: how far did price travel? The work of W.D. Gann is built on a second question that most charts never ask out loud — how long did it take, and are the two in proportion? This lesson is about that idea, about the man who built a method around it, and about which parts of that method are worth carrying into a modern chart.
One advance, measured twice. The vertical dashed line records how far price moved. The horizontal one records how long it took. Most analysis uses only the first. Everything in this course begins by treating the second as data of equal standing.
🔵 WHERE THIS COURSE FITS
The Wave Analysis course described market movement as a structure of repeating patterns. This course describes it as a relationship between two measurements — price and time — and gives tools that measure the second one explicitly.
The two courses are not rivals. A wave count says which leg of a structure price is in. A time measurement says how long that leg has been running and whether it has run the length that similar legs tend to run.
🔵 1. WHO W.D. GANN WAS
William Delbert Gann was born in Texas in 1878, into a cotton-farming family, and started trading in his early twenties. He opened his own brokerage in New York in 1908 and spent the next four decades trading, teaching, and writing.
- He published several books, including Truth of the Stock Tape (1923) and 45 Years in Wall Street (1949)
- A 1909 interview in The Ticker and Investment Digest recorded a month of his trades under observation — the most documented account of his trading that exists
- He sold courses and forecasts, which was a significant part of his income
There is also a legend around him, and it is worth separating from the record. Claims that he made a fortune of tens of millions are not supported by his estate, which was modest, and his own son questioned how much of his income came from trading rather than from teaching. Some of his writing drifts into numerology and astrology that no amount of goodwill can turn into a testable method.
None of that removes the value of the core idea. It does mean this course takes his work as a framework of measurement rather than as prophecy, and says clearly which parts belong in each category.
🐳 Pro Tip: Be careful with any method sold on the reputation of its author. The measurement either holds up on your own chart or it does not, and the biography has no vote in that.
🔵 2. THE IDEA THE WHOLE METHOD RESTS ON
A chart has two axes, and almost all common analysis lives on one of them.
- Support, resistance, Fibonacci levels, targets — all of these are statements about price
- Very few tools make a statement about duration
- Gann's contribution was to treat time as measurable in the same way: a move can be too fast, too slow, or in proportion
The practical version of that idea is simple. If a rally covered a certain distance in a certain number of bars, then the next rally of the same degree can be compared against both numbers, not just the first.
🐳 Pro Tip: The quickest way to start using this is a habit, not a tool. Whenever you mark a swing, write down two numbers instead of one: its size, and how many bars it took.
🔵 3. THE SAME DISTANCE IS NOT THE SAME MOVE
Two advances can end at the same price and mean completely different things.
Two advances between the same two levels. The one on the left covered the distance quickly with few pauses; the one on the right took far longer and paused repeatedly. On a price-only reading these are the same move. On a price-and-time reading they are not.
- A move that covers ground quickly is often carrying more participation behind it
- A move that takes a long time to reach the same level is typically meeting more supply along the way
- Neither observation is a signal on its own, but the distinction is invisible if duration is never recorded
🐳 Pro Tip: This is the least mystical part of Gann's work and the easiest to test. Compare the bar counts of the advances in a trend you already know — declining speed across successive legs is a common late-trend characteristic.
🔵 4. THE 1×1 LINE
If price and time are both measurable, then a rate can be defined: one unit of price for one unit of time. That rate is the 1×1 line, and it is the centre of the Gann toolkit.
A grid where each cell is one unit of price by one unit of time, and the line that rises exactly one cell per cell. Price here is travelling faster than that rate, so the path stays above the line. When an advance falls back below it, the rate of advance has changed — which is the reading the line was built to give.
- Price above the 1×1 line means the advance is running faster than the reference rate
- Price below it means the advance has slowed relative to that rate
- The line is often drawn from a significant high or low, and can act as moving support or resistance
One warning that matters more than anything else in this lesson: the famous 45-degree angle is a consequence of chart scaling, not a law of markets. A 1×1 line looks like 45 degrees only when one unit of price is drawn the same visual size as one unit of time. Change the zoom and the angle changes while the relationship does not. Lesson 04 deals with this properly.
🐳 Pro Tip: If someone tells you to draw a 45-degree line on any chart without first defining what one unit of price and one unit of time are, the line means nothing. The unit is the whole method.
🔵 5. THE NUMBERS HE KEPT RETURNING TO
Gann divided things — ranges, circles, time periods — into simple fractions, and watched what happened at the divisions.
- A range split into eighths : 1/8, 2/8, 3/8 and so on, with 4/8 (the halfway point) treated as the most important of all
- A range split into thirds : 1/3 and 2/3
- The circle divided into 90 · 180 · 270 · 360 , applied to both price and time
A completed range divided into eighths, with the halfway level marked. The pullback stops at that level. Splitting a range into simple fractions is the oldest idea in the toolkit and the one that survives testing best.
It is worth being honest about why these levels work as often as they do. A halfway retracement is watched by a very large number of participants, whatever method they use to arrive at it. That is a sufficient explanation, and it does not require the numbers to be special in themselves.
🐳 Pro Tip: Half of the range does most of the work here. If you add only one Gann level to your chart, make it that one, and note how often it decides whether a pullback becomes a reversal.
🔵 6. MEASURING TIME ON ITS OWN
The other half of the method takes the same divisions and applies them along the horizontal axis.
- Count the bars between two significant turns, then project the same count forward
- Watch equal intervals from a major high or low, rather than levels
- Note when a market turns at a similar distance in time from a previous turn — Gann called these anniversary dates
Equally spaced vertical lines projected forward from a starting low. Several turns land close to them. Not all of them do, which is the point: this is a way of knowing when to pay attention, not a schedule the market is obliged to keep.
The correct expectation matters here. A time interval does not tell you direction, and it does not guarantee a turn. What it can do is tell you when a market has been moving in one direction for as long as its previous legs ran — which is a reason to watch closely rather than to act.
🐳 Pro Tip: Use time measurements to raise attention, never to enter. A time interval with no price event at it is a date that passed, and nothing more.
🔵 7. WHERE THE TWO MEET
The idea that ties the course together is what Gann called squaring price and time: the point at which a market has travelled an amount of price equal, in chosen units, to the amount of time elapsed.
A range and an equal span of time, drawn as a square with its diagonal. Price reaches the far corner — the distance travelled and the time taken have come into balance at the same bar. Points like this are where the method expects the character of a move to change.
- The unit is chosen by you, and it has to stay consistent to mean anything
- Squaring can be applied from a high, from a low, or across a full range
- Lesson 02 builds the tool Gann used to do this arithmetic quickly: the Square of Nine
🐳 Pro Tip: Fix your unit once per market and write it down. Most confusion with Gann tools comes from silently changing the unit and then reading the results as if nothing changed.
🔵 8. WHAT TO CARRY FORWARD, AND WHAT TO LEAVE
A short and honest sorting, since this course covers a body of work that contains both.
Worth carrying:
- Recording duration alongside distance for every swing you mark
- Dividing ranges into simple fractions, above all the halfway level
- Angles and the 1×1 rate as dynamic support and resistance, once the unit is defined
- Comparing the current leg against the bar counts of previous legs of the same degree
Worth leaving:
- Any claim that a number is significant in itself rather than because it is widely watched
- Planetary and astrological overlays, which cannot be tested in any useful sense
- Precise date forecasts presented as certainty
- The idea that the method reveals a hidden order rather than a set of measurements
🐳 Pro Tip: Judge each tool in this course by one question: can it be stated clearly enough that someone else would get the same result on the same chart? Everything that passes that test is worth your time.
🔵 COMMON MISTAKES
- Drawing a 45-degree line without defining what one unit of price and one unit of time are
- Treating a time interval as a signal instead of as a reason to look
- Changing the unit between measurements and comparing the results anyway
- Adding every angle and every division to the chart until nothing on it can be read
- Taking the legend around Gann as evidence that the tools work
- Expecting an exact date and an exact price, when the method produces areas
🔵 QUICK SELF-CHECK
- Take a trend you know well and write down the bar count of each leg — are they getting shorter or longer?
- Mark a completed range, divide it into eighths, and check what the halfway level did
- Measure the time between two major turns and project it forward — what happened near that area?
- Ask yourself what your unit of price per bar would be on the chart you trade most
- Look at a rally you called strong and check whether it was strong in price, in time, or in both
🔵 WHAT IS NEXT
Lesson 02 builds the Square of Nine — the numbered spiral Gann used to relate price levels and dates through the same set of divisions, and the tool most associated with his name.
Worth sitting with before then: a chart is a record of two things, and most of us throw one of them away before we start analysing. The rest of this course is about picking it back up.
Previous course — Wave Analysis
Trading Roadmap | Wave Analysis · Lesson 01 — Wave Analysis Foundations
Trading Roadmap | Wave Analysis · Lesson 14 — The Full Read
Best Regards, BigBeluga 🐳  Education
Bitcoin Bounces — But Bulls Still Have Plenty to ProveSeptember Support Reclaimed For Now
Bitcoin has recovered back above the $76,264 area after briefly breaking below it earlier this week. Holding above this former support would be an encouraging first step for the bulls.
Medium-Term Trend Still Down
Despite the bounce, Bitcoin continues to produce a series of lower highs and lower lows from the $82,300 peak. That structure still leaves the medium-term trend pointing lower.
Moving Averages Turn Bearish
The 100/50-period EMAs have now crossed bearishly, with price still trading beneath both averages. Bulls will need to reclaim these to start improving the 4-hour picture.
Momentum Is Recovering
RSI has climbed back towards the 50 level, while StochRSI is rising towards overbought territory. Momentum has improved, but neither currently gives a particularly strong bullish signal.
The Big Test Remains $80,000
Bitcoin has failed around $79,600–$80,000 three times in little over a week. A convincing break above this area would give the chart a bullish change of character and finally challenge the recent sequence of lower highs.
In Summary
Bitcoin has reclaimed the $76,264 area, giving bulls something to work with after this week's breakdown. However, the medium-term structure remains bearish, with a series of lower highs and lows and the 100/50-period EMAs now bearishly crossed. Momentum is recovering, but bulls still have plenty to prove. Until Bitcoin can convincingly break through the $79,600–$80,000 resistance area, the risk of sellers stepping back in remains very real.  Long
Long
 Long
Long
 Long
Long
 Long
Long
 Long
Long
ETH at the Edge — Will $2,400 Be the Next Stop?CRYPTOCAP:ETH update
ETH is still trading right below the strong $2,530–$2,560 resistance zone, where we’ve already seen multiple rejections from the upper trendline.
The liquidation heatmap adds an interesting layer here. There’s a large liquidity cluster around $2,400, which is relatively close to the current price and could act as a magnet if ETH gets rejected again.
So the setup remains pretty simple:
$2,530–$2,560 → major resistance
$2,400–$2,430 → key downside liquidity/support zone
RSI is also showing bearish divergence, so I’m not comfortable chasing longs into this resistance.
If ETH gets a clean breakout and holds above the resistance, the bearish setup weakens. But if we see another rejection and lose the local support, $2,400 becomes the level I’d watch closely.
For now, patience and confirmation.
What’s your view on ETH here?
 Short
Short
Short 
BTCUSD Technical Analysis Liquidity Sweep and Key LevelsBTCUSD is currently consolidating below the 76,800–76,900 resistance zone after a strong upward move.
Resistance: 76,700–76,900
Support: 75,550–75,650
FVG: 76,200–76,300
Liquidity: Recent highs around 76,550–76,650 have been swept.
Market structure: Price remains above the marked support while forming a short-term consolidation.
A sustained break and acceptance above 76,900 could open room for further upside, while rejection from resistance may bring price back toward the 76,200–76,300 FVG and lower support. Long 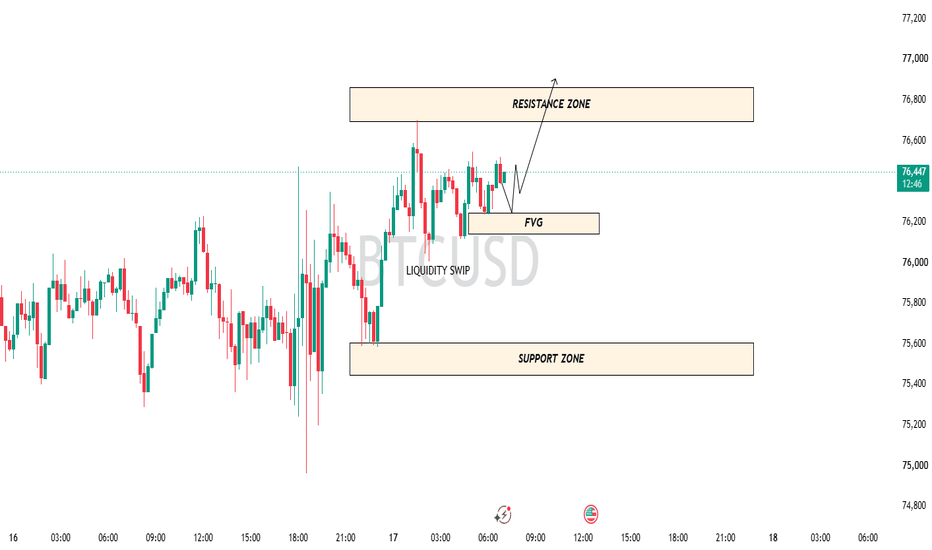
Short 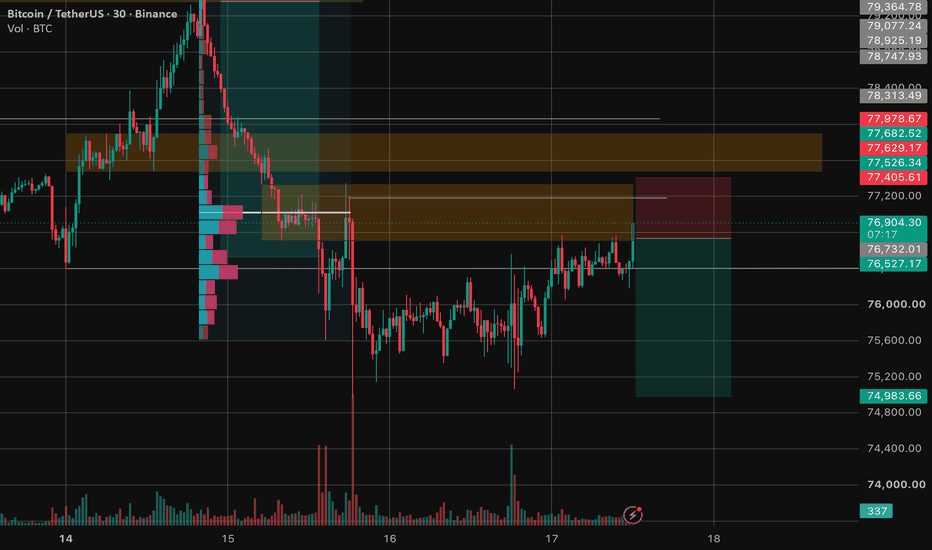
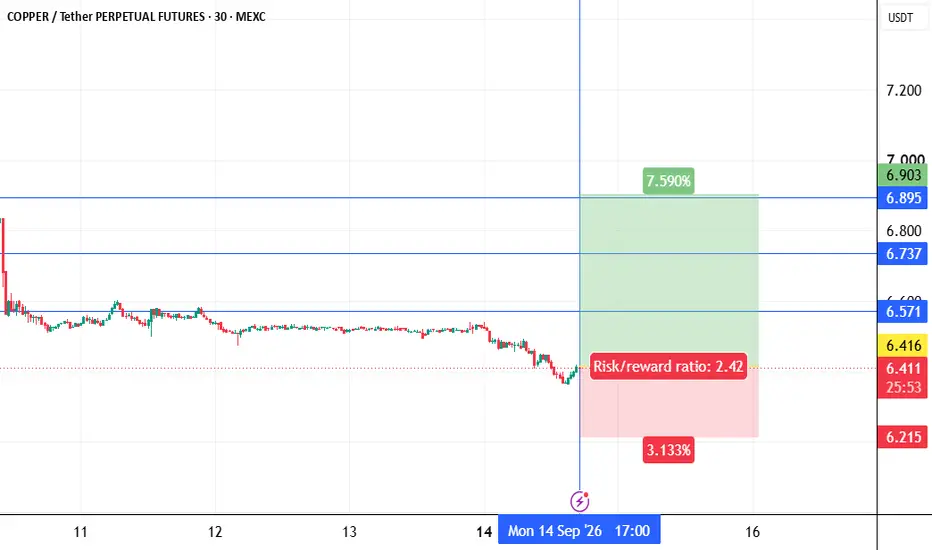
copperusdt long Roddy01-SIGNALSPROVIDERInstructions:
Entry point: yellow
Stop loss: red
Take profit: green or blue
👉Leverage x 5-10-20 for crypto
👉Leverage x 20-50-100 for commodities, stocks, indices, and forex
👉Margin 1-5% max.
Always practice risk and money management.
Invest a maximum of 5% on any trade or across all your trades.
Invest only what you can afford to lose, as no one is in control of the market.
👉Our analyses are primarily based on:
breakouts: two trend lines (ascending and descending) and a line indicating a horizontal breakout.
chart patterns: shoulders and head, triangle parttern, elliott impulse, etc etc.
We don't always have the time to track them at all times or to represent them visibly, given the numerous signals, the number of channels to manage, and especially because of the often rapid pace of market movements.
indicators: We associate at least two indicators with this technique.
👉Depending on the circumstances, we use specific indicators, often setting 3 or more take profit levels.
👉Indeed, there are good days in trading and also bad days. No one can promise to win every trade, and like all traders worldwide, we also experience stop-loss orders. However, we win more than we lose and remain positive.
👉You can close the position before or after the take profit orders indicated by the green lines if you are personally satisfied; the same applies to stop loss orders.
👉We must stay positive, clear-headed, and humble.
we cannot provide all instructions or all trades here on this channel.
Good luck to us all, and may God guide us. Amen.  Long
Long
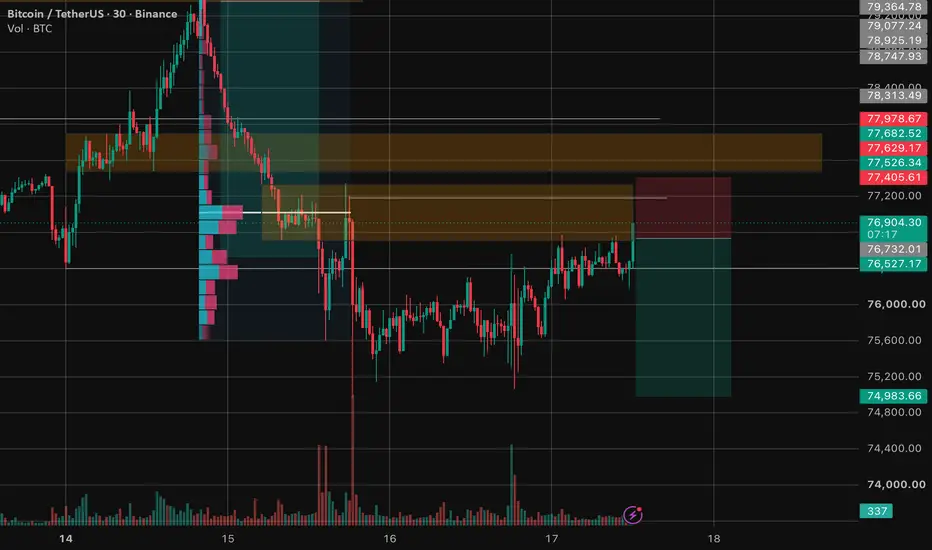
Bitcoin is back at the 76,516 value-area top after buyersBITSTAMP:BTCUSD : US session read from my KenKem Master Volume Profile (MVP) indicator & strategy.
CONTEXT
The US session opens at 12:30 UTC. Price sits near 76,500, above VWAP (76,359) and above the master value-area high (76,310), which is still marked as defended. The net-volume read flipped between buy and sell pressure within a few bars, so the flow is two-sided into the open.
KEY ZONES
• Resistance / supply: 76,516 (local VAH), then 76,700 (session high)
• Support / demand: 76,310 (local VAL + master VAH), then 76,105
• Point of Control (volume magnet): 76,417 local, 75,636 master
SCENARIOS (to watch, NOT signals)
📈 Bullish: a close above 76,516 → room toward 76,592 then 76,700 (acceptance above the value area).
📉 Bearish: rejection at 76,516 → back to 76,417 then 76,310; a close below 76,105 opens 75,933 then 75,636.
↔️ Range/unclear: stuck 76,310 to 76,516 → stand aside until a decisive close.
⛔ Invalidation: a close below 76,105 voids the higher lean.
WHAT THE MVP TOOL IS SHOWING
The Master Volume Profile plots rolling value areas (VAH/VAL), the Point of Control, and a net-volume pressure read to locate where volume is building or drying up. This idea is the qualitative output of that tool; the strategy's internal thresholds, gating and entry/exit logic are not disclosed.
Built with the KenKem Master Volume Profile indicator & strategy.
Technical analysis only, by KenKem's algorithm, NOT financial advice. Trade your own plan and manage your risk.
 Long
Long
 Long
Long
 Long
Long
BTC Reclaimed 76,237 And The Break Reads As A Sweep.BTC Reclaimed 76,237 And The Break Reads As A Sweep.
Bitcoin lost its range low earlier this week, ran to 74,887, and has now climbed back above 76,237 to trade at 76,273. That reclaim is what turns the break into a liquidity sweep rather than the start of a trend leg, and it puts the cluster from 76,649 up to 77,161 back overhead as the next resistance. Both timeframes read neutral on conviction with the hourly showing no participation at all - zero on every extension and volume flag - so the recovery has been quiet rather than forceful. The 4H still carries volatility near the top of its range from the flush. Neutral.
Resistance: 76,649 - first overhead
Key resistance: 77,161 - then the 78,028 area above it
Current price: 76,273
Support: 76,144 - just beneath
Key support: 75,750 - the shelf below
Structural floor: 74,887 - this week's low
Two paths from here:
It works through 76,649 and 77,161 and the range is whole again. Clearing that cluster would put 78,028 back as the ceiling it has to break, and only beyond 79,318 does anything structural change. The sweep low at 74,887 is the reference point beneath all of it.
It fails here and revisits 74,887. Losing 76,144 and then 75,750 would make this reclaim a retest from beneath rather than a recovery, and a second trip to 74,887 opens 74,478 with 73,545 below that.
A swept low that gets reclaimed usually means the sellers ran out before the buyers did. What it does not tell you is how far the recovery goes. 76,649 above, 76,144 below.
Built with SYNTHESIS v3.4 | SOM / ACE / IMP / SYNTHESIS
Study, not financial advice. Why Strong Candles Can Be Weak InformationA large candle attracts attention because it compresses a lot of movement into a short period. Big range, strong close, obvious momentum — visually, it looks important. But candle size and information quality are not the same thing. A strong candle can still tell us surprisingly little on its own if we ignore where it formed, what it interacted with, whether price held the new area, and what happened afterward.
────────────────────────────
SIZE GETS ATTENTION
────────────────────────────
Large candles are useful because they tell us that price moved aggressively during that period. They can show expansion, urgency and a temporary imbalance between buyers and sellers. The mistake is treating that visual strength as the conclusion.
A large bullish candle is not automatically proof that the market is now structurally bullish, just as a large bearish candle does not automatically confirm a reversal. The candle tells us that price moved strongly. It does not, by itself, explain what that move means.
────────────────────────────
LOCATION CHANGES THE MEANING
────────────────────────────
The same candle can carry very different information depending on where it appears. A large bullish candle expanding from a tight consolidation is different from an equally large bullish candle printing directly into an established resistance area after an already extended move.
Both candles can look powerful. Their context is completely different.
That is why I find “Where did this candle form?” more useful than simply asking whether the candle looks strong. Location can turn an impressive candle into meaningful structural information — or reveal that it was mostly a dramatic move into a difficult area.
────────────────────────────
FOLLOW-THROUGH TELLS US MORE
────────────────────────────
A strong candle often creates the impression of confirmation before the market has actually demonstrated anything beyond the initial expansion. What follows can be more informative than the candle itself.
If price continues building in the same direction, holds the newly gained area and develops additional structure, the initial candle gains context. If price immediately retraces, loses the level or turns into overlapping two-sided trade, the interpretation becomes weaker.
That does not mean the original candle was “wrong.” It means the candle described one event, while the subsequent price action told us whether that event actually mattered.
────────────────────────────
EXPANSION IS NOT THE SAME AS ACCEPTANCE
────────────────────────────
Price can move rapidly through a level without proving that the market is comfortable trading beyond it. Expansion answers one question: Did price move strongly? Acceptance answers another: Did price remain there and continue doing business at the new location?
A large candle through resistance can look decisive at first glance. If price immediately falls back below that area and cannot rebuild above it, the expansion still happened, but the broader interpretation changes. The market moved through the level; it did not necessarily establish acceptance beyond it.
That distinction is one reason strong candles can be weak standalone information. The move is obvious. The meaning is still unresolved.
────────────────────────────
CONTEXT IS THE PART THE CANDLE CANNOT SHOW ALONE
────────────────────────────
A single candle cannot tell us whether the move happened after compression or after a long extension, whether it ran directly into a major level, whether the higher timeframe supports it, or whether price later held the area.
Those questions live outside the candle itself.
So when I see a large candle now, I try not to ask only “How strong does this look?” I also ask: Where did it form? What changed structurally? Did price hold the move? Was there follow-through?
Those answers usually matter more than the candle’s size.
Size gets attention. Context gives meaning.
A strong candle can be important. It just should not be asked to explain more than it actually does.
Structure observations, not signals. Education 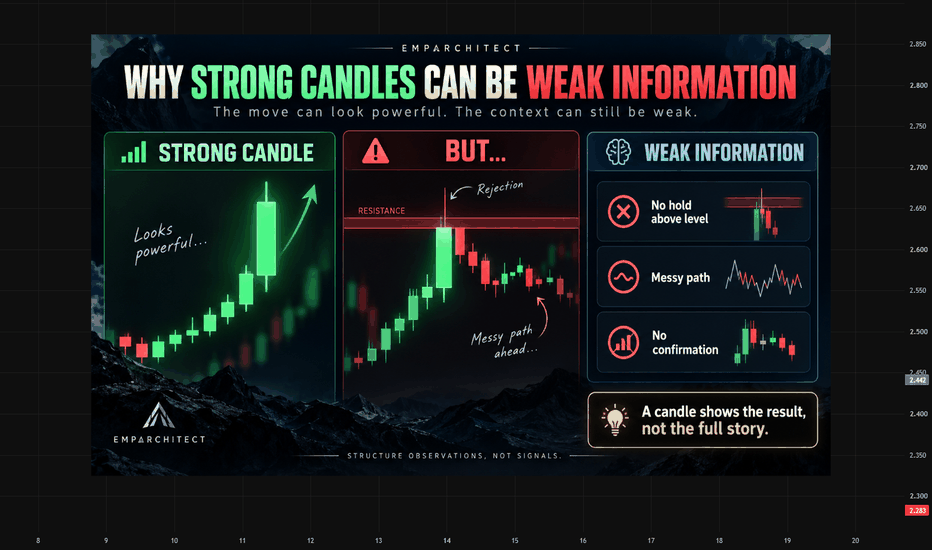
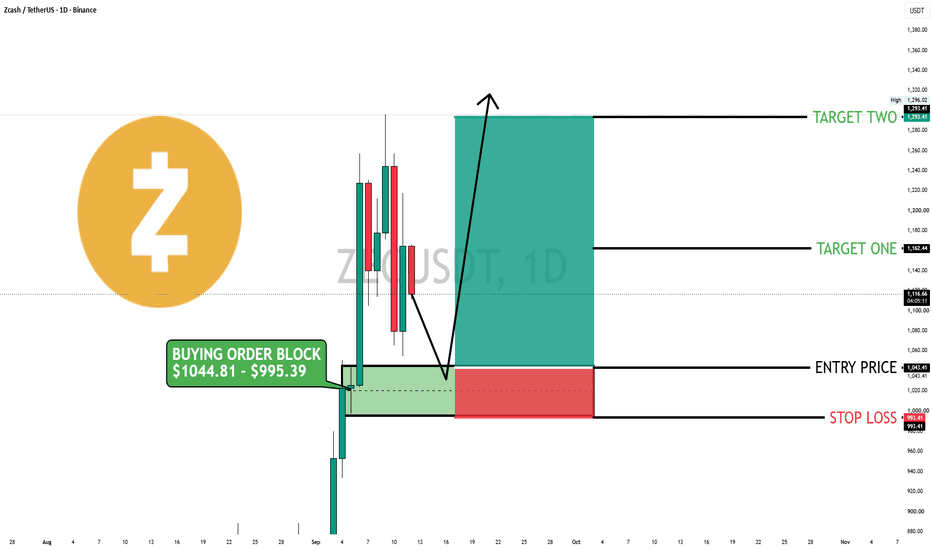
$ZEC | 1D | BUY SETUP |Everyone is calling BINANCE:ZECUSDT a dead legacy privacy coin.
I'm watching a massive 1D structural shift play out in slow motion.
Here is why the crowd is missing the transition from "dead relic" to a high-utility scarcity play. 👇
📊 THE OBVIOUS NARRATIVE vs. THE DATA
The retail crowd sees CRYPTOCAP:ZEC as a forgotten 2016 PoW coin that only gets mentioned during regulatory delisting scares. They think the project lacks momentum and has no future.
But look at the 1D market structure:
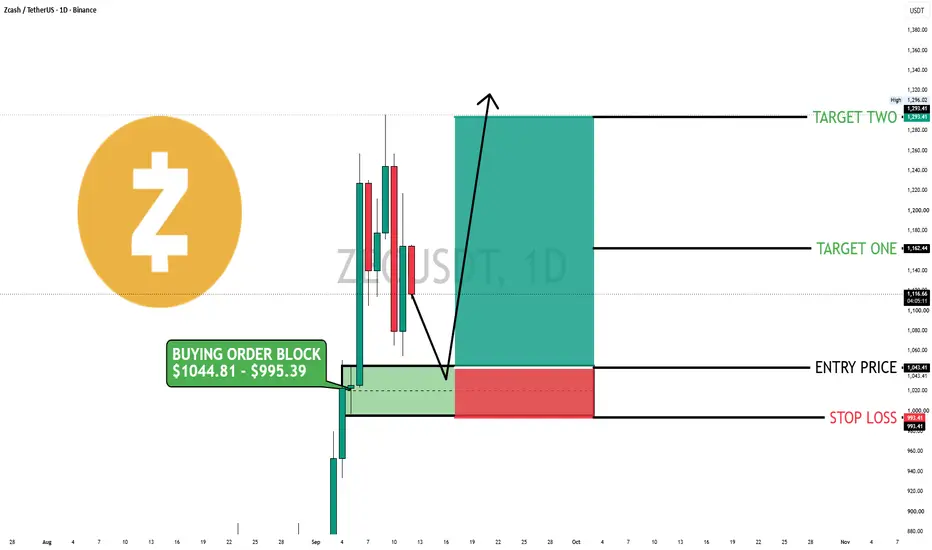
This isn't a dead chart. This is a powerful bullish breakout. Price surged from sub-$880 to a swing high of $1,296.02. Now, it is undergoing a textbook, low-volume corrective pullback to a high-timeframe Buying Order Block between $995.39 and $1,044.81.
🎯 THE DISCONNECT & WHY IT MATTERS
Two massive structural catalysts are completely ignored by the crowd:
Pure Scarcity: Like Bitcoin, CRYPTOCAP:ZEC has a hard cap of 21 million tokens. No private VC unlocks, no hidden vesting cliffs, and no hyper-inflationary emissions.
The Tech Shift: The transition toward Zcash Shielded Assets (ZSA) and Proof-of-Stake (PoS) turns CRYPTOCAP:ZEC from a simple transactional privacy token into a privacy-preserving smart asset layer.
The crowd thinks they are selling an outdated privacy coin. The smart money is accumulating a fully-distributed, ultra-scarce asset ahead of a major network upgrade.
🎯 THE TRADE SETUP
We are waiting for a sweep into the daily demand zone before looking for confirmation.
Buying Order Block: $995.39 – $1,044.81
Entry Trigger: $1,043.41
Stop Loss: $993.41
Target One: $1,162.44
Target Two: $1,293.41
🚨 THE PLAY:
Bullish above $1,043.41. If this major 1D demand zone holds, we have a clean path back toward Target Two ($1,293.41), offering a high-confluence swing setup.
A daily candle close below $993.41 invalidates this bullish thesis. Protect your capital.
Not Financial Advice. ALWAYS DYOR.  Long
Long