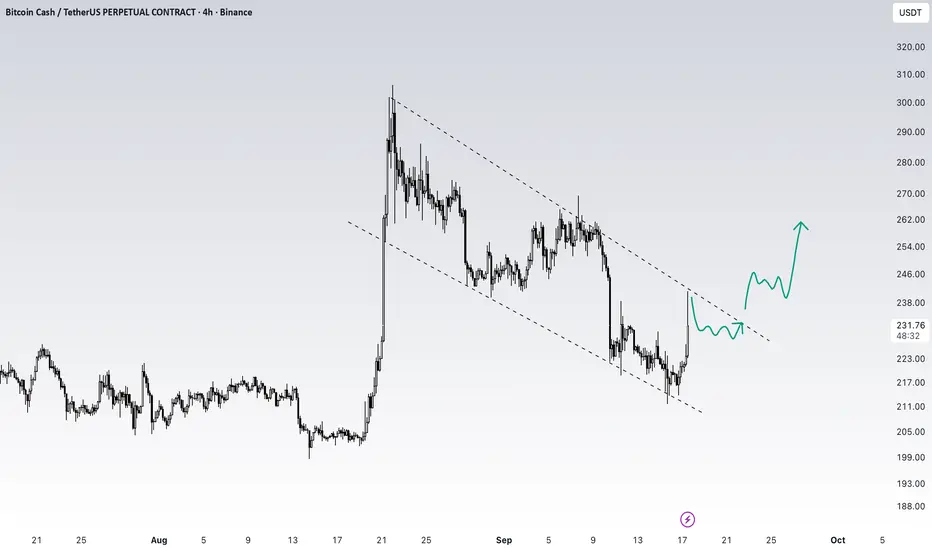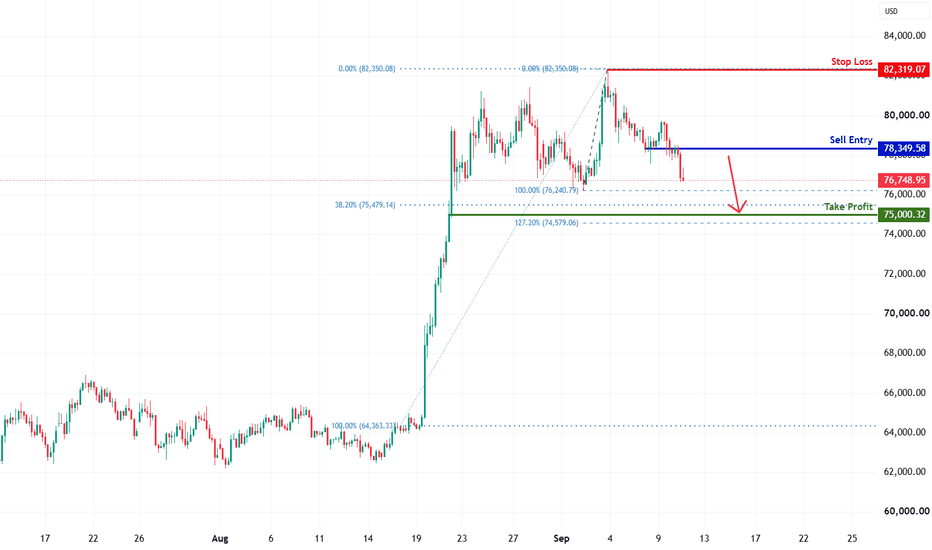
#ETHUSDT Bullish Breakout Eyes Higher Targets#ETH
The price is moving within a descending channel on the 1-hour timeframe and has reached the lower boundary. It is now poised for a bounce and is expected to retest this boundary.
The Relative Strength Index (RSI) indicates a downward trend, which is likely to continue given the overbought conditions.
A key support zone (in green) has been identified at 1730. The price has bounced off this zone several times, making it a strong support level.
The price is trending towards the 100-period moving average, which we are approaching. This trend supports an upward move.
Entry Price: 1820
Target 1: 1847
Target 2: 1872
Target 3: 1900
You can close at the second target or wait for the third target to be reached. The choice is yours.
Stop Loss: At the resistance zone (in green).
Remember this simple rule: Money Management.
Any questions? Please leave a comment.
Thank you.
Crypto market
Most breakouts fail. (Education)Most breakouts fail. Not because breakouts don't work, but because most people buy the ones that were never going to hold. This week I've got setups lining up across completely unrelated markets, biotech, energy, currencies, a consumer name, and every one of them goes through the same three-gate filter before it earns a trade. Here's the filter itself, so you can run your own charts through it.
Gate 1, trend The higher-timeframe structure has to be confirmed before anything else is even looked at. Shorter EMA above the longer one, price respecting those levels on pullbacks rather than drifting sideways near them, the long-term line still rising. A breakout inside a broken or sideways trend is a trap, not an opportunity. If the trend isn't confirmed, the setup dies here, and most of them do. That's the filter working.
Gate 2, momentum A confirmed trend tells you the direction. It says nothing about timing. Gate 2 asks whether momentum is actually turning up from a genuine reset, or whether price is already extended and you'd be chasing it into strength. This is the gate that turns a "buy now" into a "wait for it." A pair that hasn't yet closed a full day back above its key moving average, with momentum still red, has not passed this gate no matter how good the trend looks. Being right on direction and wrong on timing still loses money.
Gate 3, risk Only after trend and momentum pass does the actual trade get defined, and the first thing defined is the exit if you're wrong, not the profit. Where does the idea prove itself failed. Then, is the distance to a realistic target worth the distance to that stop. Risk a unit to make a unit and it's usually not worth it. Risk a unit to make two or three, now it's a trade. The more speculative, higher-risk ideas get sized down here, not up.
The order is the whole point Trend first, because momentum inside a broken trend is a trap. Momentum second, because a confirmed trend entered at the wrong time still hurts. Risk last, because a stop-loss only means something once you already know you're looking at a real setup. Run them in that fixed order on every chart, biotech or currency or commodity, and the filter is identical because the questions were never about the asset. They're about whether you're taking the trade for a good reason or an exciting one.
And the single most useful habit inside all of it: wait for the level. Buy the break, not the anticipation of the break. The setups that go on to work almost always give you the trigger first. The ones that don't were never going to, and waiting for the close is what saves you from finding out with real size.
Not financial advice. All commentary is for analytical purposes only.
#APEUSDT chart (1-hour timeframe)#APE
The price is moving within a descending channel on the 1-hour timeframe and has reached the lower boundary. It is now poised for a bounce and is expected to retest this boundary.
The Relative Strength Index (RSI) indicates a downward trend, which is likely to continue given the overbought conditions.
There is a key support zone in green at 0.1356, and the price has bounced off this zone several times, making it a strong support level.
The price is trending towards the 100-period moving average, which we are approaching. This trend supports an upward move.
Entry Price: 0.1455
Target 1: 0.1477
Target 2: 0.1505
Target 3: 0.1542
Stop Loss: At the resistance zone in green
Remember this simple rule: Money management.
Any questions? Please leave a comment.
Thank you.
Asymmetric BetThorchain. Rune. The last hope for permissionless blockchain technology.
Real Revenue. Real Utility. Real upside.
In May 2021, RUNE hit a $5B circulating market cap on pure speculation. At that time, the network was not fully operational, and the token grew on hype alone.
Today, the protocol is completely active, executing millions in seamless native cross-chain volume daily. Most notably, every transaction now permanently burns RUNE out of existence.
Native XMR Swaps are coming soon. With regulatory pressure forcing centralized exchanges to delist privacy assets globally, liquidity for XMR has fractured. By adding native, permissionless, no-KYC cross-chain trading between XMR, BTC, and stablecoins, THORChain has positioned itself as the premier global liquidity hub for the privacy ecosystem. Because of the protocol's 3:1 pool-to-bond ratio, accommodating this massive wave of new, un-censorable volume requires millions of dollars in RUNE to be pulled from the order books and locked directly into node bonds and liquidity pools.
We are trading the alignment of a clean technical breakout with a structural supply squeeze. The technical target of $178 implies a traditional market cap of ~$60B, but due to systemic burns and capital lockups, the real liquid market cap required to hit this target will be significantly lower.
Accumulate the floor, track cross-chain volume metrics, and hold for the macro extension.
GMXUSDT 1D#GMX is testing both the descending trendline resistance and the 200-day SMA on the daily timeframe. A confirmed breakout above these key resistance levels could trigger a bullish move toward the following upside targets:
🎯 $7.37
🎯 $8.01
🎯 $8.65
🎯 $9.56
🎯 $10.72
⚠️ Always remember to use a tight stop-loss and maintain proper risk management.
BTCUSD | SELL SETUP...🔴 BTCUSD | SELL SETUP
📍 Entry Zone: 64,700 – 64,950
🎯 Profit Targets:
🥇 TP1: 63,900
🥈 TP2: 63,500
🥉 TP3: 62,800
🛡️ Risk Control (SL):
65,250 (above the resistance zone)
📊 Market Analysis
Price has reached a major resistance area after a strong impulsive rally.
The rally appears stretched, increasing the chance of a profit-taking pullback.
Initial support is around 63,900, with stronger demand near 62,800.
🟢 Bullish Invalidation
If 1H closes above 65,200, sellers lose control and the next bullish targets become:
65,500
65,900
66,300
Wait for confirmation (such as a bearish rejection candle or lower high) before entering, as trading directly into resistance can produce false signals.
Bitcoin idea from MSnRFor Bitcoin Monthly bearish Storyline is playing in the market as you can see from 82.5K level and for that storyline there still a pull back is yet to happen and look like we are on that pullback (short term bullish movement)
72.7K level is the QM level for that monthly bearish Storyline
we are currently on weekly and bullish storyline that's the reason market pushing higher prices and as I mentioned earlier with that 72.7K level you can the see a weekly FVG too aligned with it so we can closely watch that level and when the market creates new Bearish Storylines (weekly and daily) we can go for sells and I'm predicting that sell movement is going to be a waterfall selloff even towards 35K mark
67.2K is the bull trap level so wait patiently
AAVE: Long-Term Downtrend Meets Medium-Term RecoveryLong-Term Trend Still Bearish
Despite the recent recovery, AAVE continues to produce a series of lower highs and lower lows on the higher timeframe. Bulls need a break above $118.87 to signal a genuine change of character, with $131.98 becoming the next major resistance beyond that.
Medium-Term Recovery Intact
Since bottoming around $57.83, AAVE has established a sequence of higher highs and higher lows. As long as the $82.70 support continues to hold, the medium-term recovery remains intact despite the larger bearish trend.
Resistance Continues to Cap Price
The $102-$103 resistance zone has once again attracted sellers, preventing the latest rally from extending further. While the 100/50-day EMAs remain bearishly crossed, both averages are beginning to flatten, hinting that downside momentum is fading.
Momentum & Volume Diverge
RSI remains above 50, suggesting buyers still retain a slight momentum advantage. However, volume has gradually declined as price has approached resistance, implying that bullish conviction is weakening into this key supply zone.
In Summary
AAVE remains caught between a long-term bearish trend and a medium-term recovery. The higher low structure continues to favour the bulls while above $82.70, but repeated rejection around $102-$103 and declining volume suggest caution. A break above $118.87 would mark the first meaningful shift in the long-term trend, while losing $82.70 would weaken the current recovery.
#DOGEUSDT 4h / QM#DOGEUSDT 4h
Do you think DOGE is coiling up for a breakout?
A clean QM pattern is forming, and it has the potential to push the price higher.
There are two bullish scenarios:
1️⃣ Price rallies directly from the current level.
2️⃣ Price first sweeps liquidity by engulfing the yellow zone, then reverses higher toward the red supply zones.
The bearish scenario is that the QM pattern fails, the support level breaks, and price continues its decline.
In that case, the next downside targets would be the blue demand zones.
In my opinion, this setup is worth considering for a long position—but with controlled risk, since the higher-timeframe trend is still bearish.
Also, place your stop loss with some distance below the yellow zone, as many traders are likely placing their stops right around that area.
We'll be watching it closely and keep you updated.
CRYPTOCAP:DOGE
#GALAUSDT — Holding the Last Fortres, Recovery or Final Break#GALA
The price is moving within a descending channel on the 1-hour timeframe and has reached the lower boundary. It is now poised for a bounce and is expected to retest this boundary.
The Relative Strength Index (RSI) indicates a downward trend, which is likely to continue given the overbought conditions.
There is a key support zone in green at 0.001928, and the price has bounced off this zone several times, making it a strong support level.
The price is trending towards the 100-period moving average, which we are approaching. This trend supports an upward move.
Entry Price: 0.002080
Target 1: 0.002114
Target 2: 0.002169
Target 3: 0.002226
Stop Loss: At the resistance zone in green
Remember this simple rule: Money management.
Any questions? Please leave a comment.
Thank you.
Crypto volume is often fake — so what can you actually trust?🧭 THE QUESTION
If an exchange can paint volume, how do you build a process that isn't fooled?
Honest answer first: there is no 100% "true" volume anywhere in crypto. There are only
gradients of trust. The useful move is not chasing a perfect tape — it's knowing which
data is cheap to fake, and which is expensive.
📊 WHAT IS EASY VS HARD TO FAKE
• Raw volume — easiest to inflate. Wash trades, self-dealing, vanity numbers. This is the
weakest link, and we treat it as secondary.
• Price / levels — hard to fake for long. Cross-exchange arbitrage snaps prices back in
seconds. A painted print that doesn't match the market dies fast.
• Liquidations — real forced closes of real positions. You don't fake a liquidation without
someone actually losing money.
• Funding — real transfers between longs and shorts on a schedule. Inflating it means
paying out of pocket.
• CVD / signed flow — wash trades that are buy+sell to yourself often cancel in delta.
They can dilute a signal; they rarely invent a clean one-way push alone.
So: faking "how much traded" is cheap. Faking a coherent move across price + flow + open
interest + liquidations together is expensive — that usually IS the market.
🌐 WHERE THE CLEANER NUMBERS LIVE (rough trust ladder)
1) Regulated venues (e.g. CME crypto futures) and audited ETF flows — legal/reporting teeth.
2) Large, battle-tested spot/perp venues with real liquidity (and a history of looking
structurally healthy in independent studies). Mid-tier venues have been where "volume
theater" showed up most clearly in public research.
3) Aggregators that filter by trust scores / quality screens.
4) On-chain / DEX — transparent, but wash volume still exists (just costlier via fees).
🔬 WHAT WE RAN (PUBLIC HEALTH CHECK, NOT A SIGNAL)
We ran the classic "does volume couple to volatility?" test on OKX public candles —
BTC, ETH, ADA, XRP — minutes over ~1 week and coarser bars over ~1.5 months.
Healthy markets in the literature: volume↔volatility correlation rises as you zoom out
(often into roughly the 0.6–0.9 band on higher aggregations). Wash-heavy venues in those
studies stayed low (~0.2) and didn't scale up.
Our read on that signature:
• BTC ~0.61 (1m) → ~0.70 (1h) — healthy pattern
• ETH ~0.60 → ~0.75 — healthy
• ADA ~0.49 → ~0.70 — healthy (thinner name, still scales)
• XRP ~0.42 → ~0.66 — healthy
Same shape as a normal market: moderate on minutes, stronger when aggregated. Extra checks
(volume clustering / heavy return tails) also looked like real tape, not flat synthetic
noise. One limit: OKX candles don't expose trade-count the same way, so the sharpest
"trades without volume" leg of some papers wasn't fully reproducible — the main
volume↔volatility signature still passed.
🎯 TAKEAWAY
We don't survive by worshipping one exchange's volume bar. We survive by requiring
agreement: price structure, flow, positioning, and stress marks (like liquidations) have
to rhyme. One metric is cheap to fake. A chorus is not.
👉 Follow quantlinesystems — process journal and method, not signal spam.
⚠️ Educational. Not financial advice. Not an endorsement of any exchange. Past health
checks are not a guarantee of future data quality.
ETHUSD idea from MSnRFor Ethereum Monthly bearish Storyline is playing in the market as you can see from 2448 level and for that storyline there still a pull back is yet to happen and look like we are on that pullback (short term bullish movement)
2178 level is the QM level for that monthly bearish Storyline
we are currently on weekly and bullish storyline that's the reason market pushing higher prices and as I mentioned earlier with that 2178 level you can the see a weekly FVG too aligned with it so we can closely watch that level and when the market creates new Bearish Storylines (weekly and daily) we can go for sells and I'm predicting that sell movement is going to be a waterfall selloff even towards 800$ mark
CELO USDT SHORT SIGNAL#89 CELO/USDT – Trade Setup (SHORT)
📈 Position Type: SHORT
🕒 Timeframe: 1H
📊 Market: Futures
💰 Entry Zone:
0.07125
🛑 Stop-Loss:
0.074
🎯 Take-Profit Targets:
• TP1: 0.070
• TP2: 0.06880
• TP3: 0.06744
• TP4: 0.06587
⚙️ Leverage:
5 *10
▫️ After TP1, move SL to Entry + 0.2%.
▪️ Exit Plan:
• 40% at TP1
• 20% at TP2
• 20% at TP3
20% at. TP4
📌 Risk Management:
Risk only 1–2% of your capital per trade.
⚠️ Always check and confirm the setup on your chart before entering the trade.
BTC: overnight trail ratchet + why breadth still matters🧭 FOLLOW-UP (process journal, not a live signal)
Last post covered early break-even and partials on a BTC long. Overnight the trail did the
boring, correct thing: as price pushed into the high-$64k area, the protective stop was
ratcheted HIGHER in steps — never lower. A trail is a one-way ratchet. When price eased
off the highs and a lower stop would have been worse than the current one, the system
correctly stayed quiet. Silence is also a feature.
📒 WHAT THAT MEANS FOR THE TRADE
Partials already locked progress earlier. The remaining slice is now protected with a stop
above the original entry — so even a full stop-out on the rest still leaves the overall
trade green. Next chapter is either a higher target area near ~$65k, or the trail keeps
climbing if price makes new highs. No live entry/stop levels posted here.
📊 BREADTH — THE OTHER HALF OF THE STORY
While BTC was marking the overnight highs, a full-market breadth read (BTC's place in its
own range vs a wide alt basket) flipped into a clear CONFLICT: BTC running near the top of
its range while the typical alt sits much lower in its own. Translation: upside without
broad confirmation — "thin" strength.
Important honesty about the open-source Lite on this chart:
Geometric Conflict Lite uses a small public basket of major alts only. Majors often track
BTC more closely, so Lite can stay NEUTRAL / calm while the wider-market read is already
in conflict. Same idea, different sample size — Lite is a teaching lens, not a 1:1 clone
of the full breadth engine. Don't treat the Lite panel as "all clear" just because the
line isn't red.
Why it still matters for this long: thin upside is exactly when you want a trail ABOVE
entry, not hope. And it's why casual alt-longs off support stay on ice — those supports
are often borrowed when BTC leads the range alone.
🎯 TAKEAWAY
Good systems don't only enter. They defend, harvest, and ratchet — especially when breadth
says the move is running ahead of the pack.
👉 Follow quantlinesystems — process journal, not signal spam.
⚠️ Educational journal. Not financial advice. Not a live entry/stop call.
BTC reclaimed the sellers' cost basis
BTC reclaimed the sellers' cost basis, now it's fighting the heaviest shelf on the map
Two things on this chart matter more than everything else combined: the magenta line and the red one.
The magenta line is the anchored VWAP from the May top the average price of every trade since the decline began. Think of it as the sellers' collective cost basis. For two months it capped every single rally: price approached it, sellers defended their average, price rolled over. That's the mechanical reason the downtrend kept working.
In early July that stopped. Price closed above the anchor near 62,000, and the line has gone flat underneath,csellers are no longer in control of their own average. When a two-month resistance line flattens and holds as floor, the structure of the decline is broken, even if nobody announced it.
The red line is the second story: roughly 64,000 is the single most-traded price of this entire six-week range. Look at the profile on the left it's the heaviest shelf on the map, and the buy/sell split shows much of that volume was sell-side. That means a large population sold heavily at 64K. Price is now sitting directly on top of their shelf.
That's the whole battle in one level. If price keeps finding acceptance above 64,000, everyone who sold there is underwater and the shelf flips from resistance to support. Reject it, and the range continues.
What the map says about the path:
Above 65,000 (the July ceiling), the profile goes thin all the way to the 66,800–67,200 supply band. Almost nothing traded there in six weeks. Thin zones don't slow price down a confirmed break travels that gap fast.
The caveat: price is 4.5% above the anchor it just reclaimed. Extended. The strong-hands buying showed up at 59,000–62,000 you can see the green buy-dominant rows in the profile not up here.
Lose the 64K shelf and the anchor near 62,000 is the level that has to hold. That's where this recovery either proves itself a second time or unwinds.
Bottom line: the structure flipped in July, the map says the next fast move lives above 65K but the location for new risk is the anchor, not the shelf. Acceptance above 64K is the tell to watch this week. Let the level do the talking.
ORD USDT SHORT SIGNAL#88 ORD/USDT – Trade Setup (SHORT)
📈 Position Type: SHORT
🕒 Timeframe: 1H
📊 Market: Futures
💰 Entry Zone:
3.617
🛑 Stop-Loss:
3.728
🎯 Take-Profit Targets:
• TP1: 3.546
• TP2: 3.462
• TP3: 3.367
• TP4: 3.269
⚙️ Leverage:
5 *10
▫️ After TP1, move SL to Entry + 0.2%.
▪️ Exit Plan:
• 40% at TP1
• 20% at TP2
• 20% at TP3
20% at. TP4
📌 Risk Management:
Risk only 1–2% of your capital per trade.
⚠️ Always check and confirm the setup on your chart before entering the trade.
⚠️
Bitcoin Retests Buyer Zone Inside an Ascending ChannelHello traders! Here’s my technical outlook based on the current BTCUSDT (1H) chart structure. BTCUSDT previously formed a Rounding Bottom, signaling the end of the previous decline and the beginning of a bullish recovery. Price later entered a broad ascending channel, repeatedly reacting between the 62,300 Buyer Zone and the 64,000 Seller Zone, confirming a well-defined trading range. Currently, BTCUSDT is trading above the 62,300 Buyer Zone after pulling back from the 64,000 Seller Zone. The lower boundary of the ascending channel continues to provide support, suggesting buyers may attempt another recovery. As long as BTCUSDT remains above the 62,300 buyer zone and holds the support of the ascending channel, the bullish scenario remains valid. I expect a bounce from the 62,300 support zone to the 64,000 seller zone (TP1). Please share this idea with your friends and click "Boost" 🚀
Bitcoin: Lower High or Breakout?Resistance Faces Another Test
Bitcoin is once again testing the key $64,700 resistance, the same area that rejected price earlier in the week. Bulls have managed to reclaim this level intraday, but a decisive close above it is still needed to avoid another lower high forming.
Trend Structure Continues to Improve
The 100/50-period EMAs have now crossed bullishly, with both moving averages beginning to slope higher. Price continues to trade above both averages, suggesting the short-term trend has shifted in favour of the bulls.
Momentum Remains Constructive
RSI continues to hold above the 50 level, reflecting improving momentum. StochRSI has also crossed into overbought territory, which often accompanies strong rallies, although it can also warn that upside momentum may begin to slow.
Volume Offers a Note of Caution
Volume has declined as price has pushed into the local range highs. While this can sometimes allow price to grind slightly higher, it also suggests buying conviction is not increasing, making this resistance area particularly important to watch.
In Summary
Bitcoin continues to strengthen from last week's bullish rejection at support, with improving trend structure and constructive momentum indicators. However, the recovery is now testing a major resistance zone around $64,700 on declining volume, leaving open the possibility of another lower high. A convincing breakout above resistance would strengthen the bullish case, while rejection would keep the recent range intact.
BTCUSDT 15M: Bullish BOS Holds — 64.94K Weak High Remains the DrThe 15m order flow remains bullish after the sellside sweep near 62.60K produced a bullish CHoCH, followed by successive BOS through 64.35K and 64.65K. The latest expansion raided internal buyside above 64.80K and rejected from the 64.81K–64.94K supply zone, creating a minor bearish CHoCH; this is currently a pullback, not a confirmed reversal, while 64.46K holds. Price is trading in the premium of the 63.88K–64.94K dealing range, with equilibrium near 64.41K, so chasing at 64.70K offers poor risk-to-reward. The immediate 64.46K–64.66K bullish order block/FVG is the key continuation zone, followed by deeper imbalances at 64.04K–64.16K and 63.89K–63.97K. The visible previous-day profile has an approximate POC at 64.10K, VAH at 64.33K and VAL at 63.97K. Its main HVN sits around 64.08K–64.22K, with a secondary node near 64.58K–64.64K; the 64.35K–64.50K area is a clear LVN. The bullish break above VAH and the LVN caused rapid repricing, while the secondary HVN now aligns with the active bullish FVG. No clean confirmation yet.
Key Levels:
Resistance: 64,810–64,940
Support: 64,460–64,660; 64,040–64,160
Buyside liquidity: 64,940 weak high, then 65,000
Sellside liquidity: Below 64,460; major pool around 63,890–63,970
POC: Approximately 64,100
VAH: Approximately 64,330
VAL: Approximately 63,970
Other important zone: 64,350–64,500 LVN; deeper demand at 63,060–63,300
Trade Idea:
Bias: Bullish while 64,460 remains protected
Setup: Pullback long from the active bullish FVG/order block
Entry area: 64,520–64,620
Confirmation needed: Sweep of local sellside inside the zone, strong rejection and a 15m bullish displacement close above 64,740
Stop loss: 64,430
TP1: 64,810
TP2: 64,940–65,000
TP3: 65,200
Execution Guide:
Wait for price to trade into 64.46K–64.66K and reject; enter only after a bullish displacement candle closes back above the nearby intraday highs, preferably on its retest. A full 15m close below 64.46K invalidates the continuation entry and exposes 64.16K–64.04K near the profile POC. A short becomes valid only after that breakdown and a failed retest from below.
BTCUSDGood morning, everyone! Hope you're all having a great day. ☀️
Do you remember yesterday's analysis?
Based on the confirmations we received, we entered a long position.
We secured our trade by moving to break-even (BE) after TP1, closed 70% of the position at TP2, and we're now letting the remaining 30% run toward TP3.
Even if the market reverses and hits our break-even stop, we'll still walk away with profits from the 70% we've already secured—without giving anything back.
Do you know why?
Because confirmation is our best friend. 🍻