Long
Long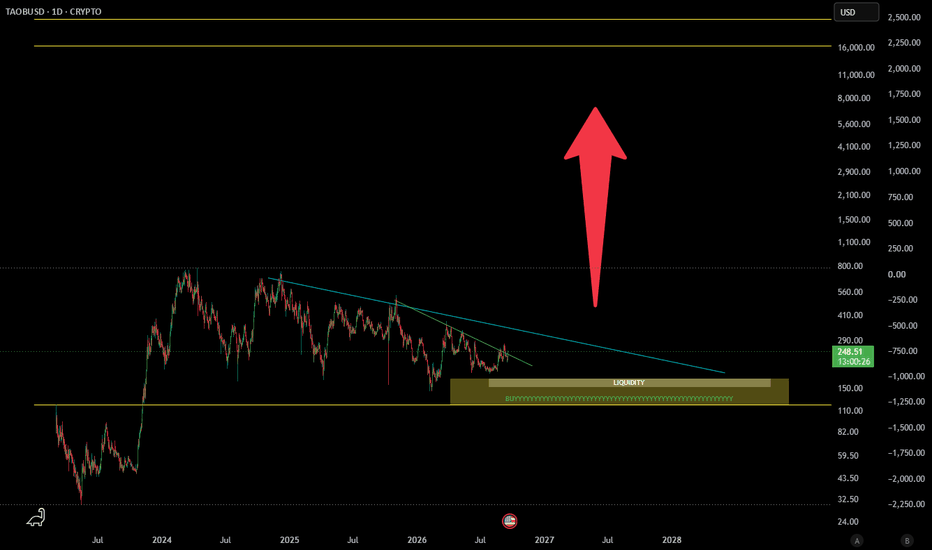
NEAR Explodes Higher — But Major Resistance AwaitsExplosive Weekly Breakout
NEAR is putting in a huge weekly candle, breaking decisively above the previous $3.087 high and continuing the recovery from its $0.841 low.
Weekly Structure Improves
The breakout strengthens the developing series of higher highs and higher lows. This is also supported by the bullishly crossed 21/8-week EMAs.
Major Resistance Now in Play
Price has pushed directly into the $3.34–$3.68 area, a significant zone that has repeatedly acted as support and resistance. This could provide the first major test of the breakout.
VRVP Opens Up Above
The largest concentration of volume sits around the recent breakout area, while the VRVP shows considerably less volume at higher prices. If resistance gives way, there appears to be less historical volume overhead.
Momentum Becoming Stretched
RSI has now moved into overbought territory, while StochRSI is also pushing higher. After such a large weekly move, some consolidation or a pullback would not be surprising.
Next Area Above
If NEAR can convincingly clear the current resistance zone, the top of the weekly FVG around $4.75 becomes an interesting area further above.
In Summary
NEAR has produced an explosive weekly move, breaking above $3.087 and strengthening its developing bullish structure. The 21/8-week EMAs are also bullishly crossed, while the VRVP shows relatively little volume at higher prices. However, price is now entering significant resistance between $3.34 and $3.68 with momentum becoming stretched. A convincing break through this zone could bring the top of the weekly FVG around $4.75 into focus.  Long
Long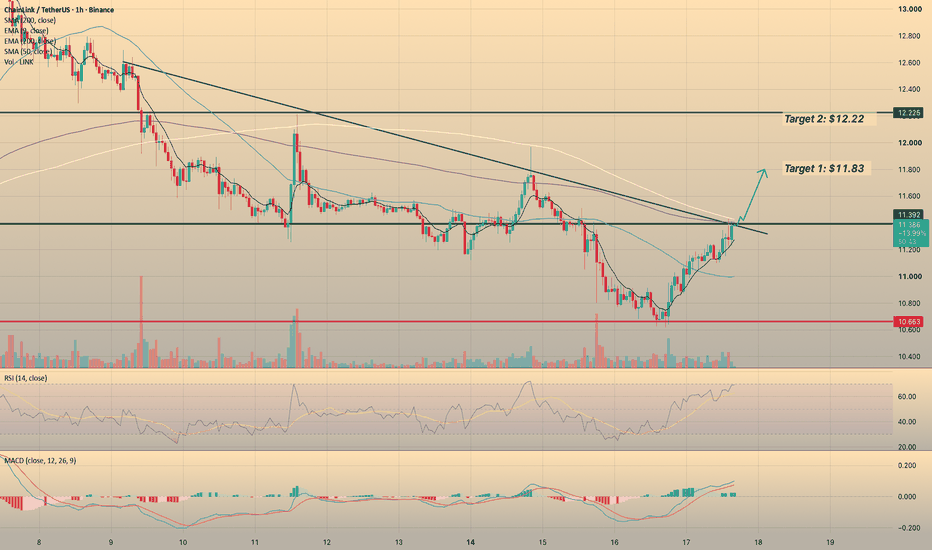
240M DOGE Bought, But the Network and Charts Says Be Careful* Whales bought over 240 million DOGE in the past week, lifting holdings to 19.02 billion DOGE.
* The DOGE price is testing key resistance between $0.08564 and $0.08672.
* Active addresses and transfers have declined, pointing to weaker network activity.
The DOGE price has an interesting setup right now. Whales have bought more than 240 million DOGE in the past week, taking their total holdings to 19.02 billion DOGE. Big holders are clearly buying more DOGE even after the recent drop.
The problem is that the network data doesn't look as strong. Active addresses have fallen to around 36,500, down from roughly 45,000, and transfers have dropped from about 57,000 to 47,300. So, the whale buying is strong, but fewer people are using the network.
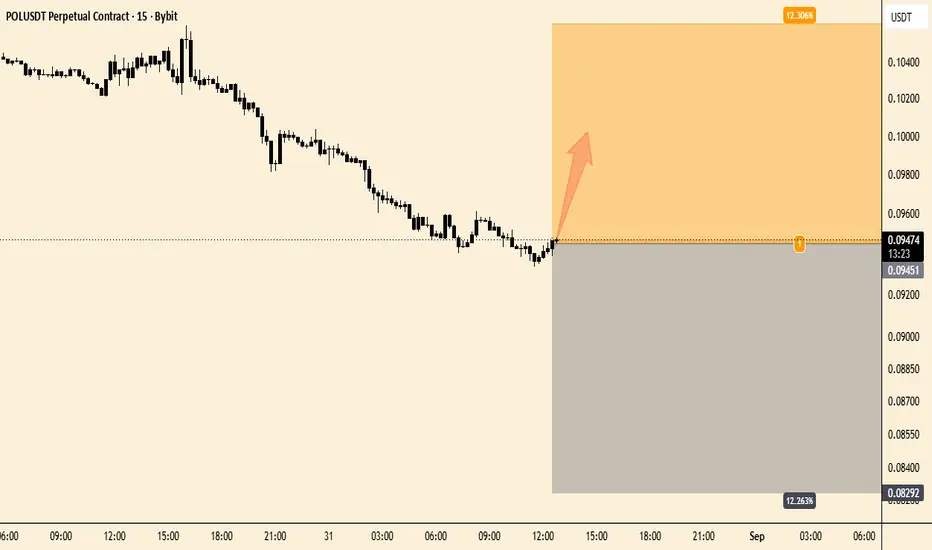
We had a look at the DOGE charts, and the price is around $0.08292. On the daily chart, DOGE is still above the 100-day SMA at $0.07804. That level is important because holding above it keeps the broader setup in decent condition. The daily RSI is at 48.57, which puts the market pretty much in the middle.
The shorter-term picture is a little tougher for buyers. DOGE is below the 100-period SMA at $0.08564, and the 4-hour RSI is down to 39.78. If buyers can push DOGE back above the $0.08564–$0.08672 zone, the next levels to watch are $0.08934, $0.09757, and possibly $0.10531.
For now, the DOGE price is stuck between strong whale buying and weaker network use. Holding $0.07804–$0.07733 keeps the recovery setup alive. A break above $0.08672 could open the way toward $0.08934 and $0.09757, with $0.10531 higher up. If DOGE loses $0.07733, the next major support area is around $0.06410.
CoinCodex's one-month forecast puts the DOGE price at $0.08693. That's only a little above the current level, so the forecast points to a fairly modest move in the weeks ahead. The bigger question is whether network activity can start picking up again alongside the whale buying.
 Long
Long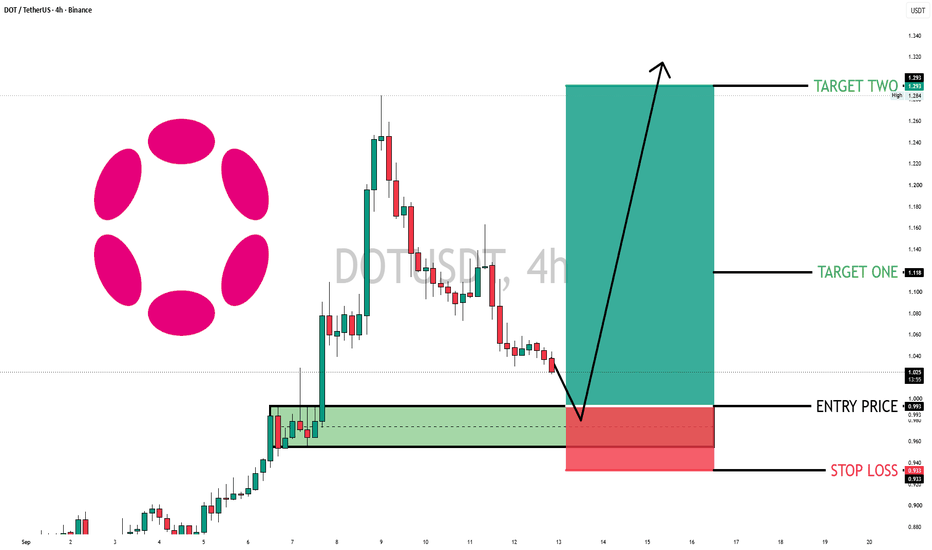
xrpusdt longInstructions:
Entry point: yellow
Stop loss: red
Take profit: green or blue
👉Leverage x 5-10-20 for crypto
👉Leverage x 20-50-100 for commodities, stocks, indices, and forex
👉Margin 1-5% max.
Always practice risk and money management.
Invest a maximum of 5% on any trade or across all your trades.
Invest only what you can afford to lose, as no one is in control of the market.
👉Our analyses are primarily based on:
breakouts: two trend lines (ascending and descending) and a line indicating a horizontal breakout.
chart patterns: shoulders and head, triangle parttern, elliott impulse, etc etc.
We don't always have the time to track them at all times or to represent them visibly, given the numerous signals, the number of channels to manage, and especially because of the often rapid pace of market movements.
indicators: We associate at least two indicators with this technique.
👉Depending on the circumstances, we use specific indicators, often setting 3 or more take profit levels.
👉Indeed, there are good days in trading and also bad days. No one can promise to win every trade, and like all traders worldwide, we also experience stop-loss orders. However, we win more than we lose and remain positive.
👉You can close the position before or after the take profit orders indicated by the green lines if you are personally satisfied; the same applies to stop loss orders.
👉We must stay positive, clear-headed, and humble.
We must stay courageous and, above all, prudent regarding market reversals that no one can control
👉we cannot provide all instructions or all trades here on this channel.
such as:
⚡Move your stoploss
⚡Put B.E (break even)
⚡re-entering the trade at the same entry point or lower.
⚡recovery signals provided in the event of—or following—a stop-loss (SL) hit.
⚡personalized discussions, instructions, and answers.
⚡revealing our high-performance indicators and teaching you how to configure and use them.
Good luck to us all, and may God guide us. Amen.  Long
Long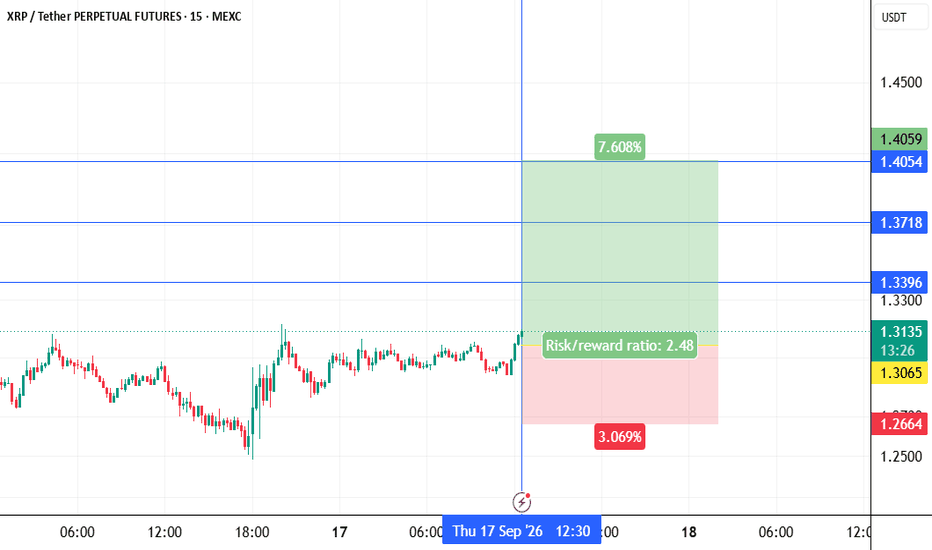
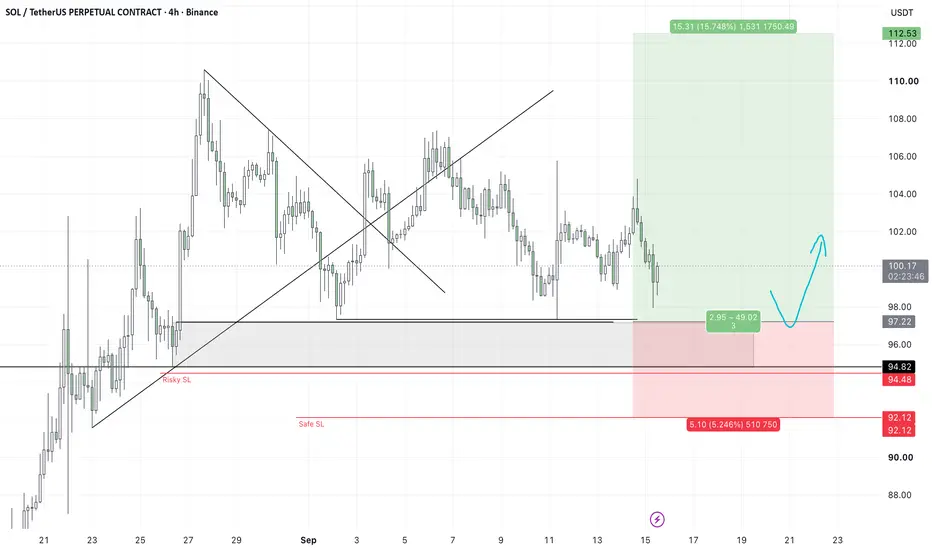
SOLANA: Approaching the $97.22 Demand Zone — Long Setup Ahead?SOLANA: 13-Day Range — Watching the $97.22 Bottom for a Long Setup
Solana has been trading inside a clear range between $97 and $107 for almost 13 days, and the price is now approaching the bottom of this range around $97.22.
At this area, I’m looking for potential long opportunities.
There are two ways I would consider entering this trade: 👇👇
1. Risky Limit Entry
For a more aggressive approach, you can place a limit order around $97.22.
For the stop loss, there are two options:
- Risky SL: $94.48
- Safer SL: $92.12
Personally, if I were taking the limit-entry approach, I would prefer the safer stop loss at $92.12 to give the trade more room.
For the targets, you can manage the position based on R:R:
- TP1 = 1R
- TP2 = 2R
- TP3 = 3R
If we get the long entry near the bottom of the range, the main idea is for SOL to move back toward the top of the range around $107.
2. Confirmation Entry
The second approach is to wait for confirmation instead of entering immediately at $97.22.
Once the price reaches the bottom of the range, I would look for a clear reaction from the area, such as a strong bullish candlestick or a change in market structure from bearish to bullish.
If that confirmation appears, we can then look for an entry with confirmation. This approach may provide a higher-probability setup, although the entry could be at a higher price and the potential R:R may be different.
So, personally, I prefer waiting for the reaction and confirmation rather than blindly entering at the bottom of the range.
However, if you want to take the limit-order approach, the $97.22 area is the level I’m watching, with either $94.48 or the safer $92.12 stop loss.
If #SOL reaches the top of the range around $107, that would be the main area to watch. And if the price breaks above the range with strong momentum, SOL could potentially continue higher.
As always, manage your risk properly and don’t risk more than you can afford to lose.
 Long
Long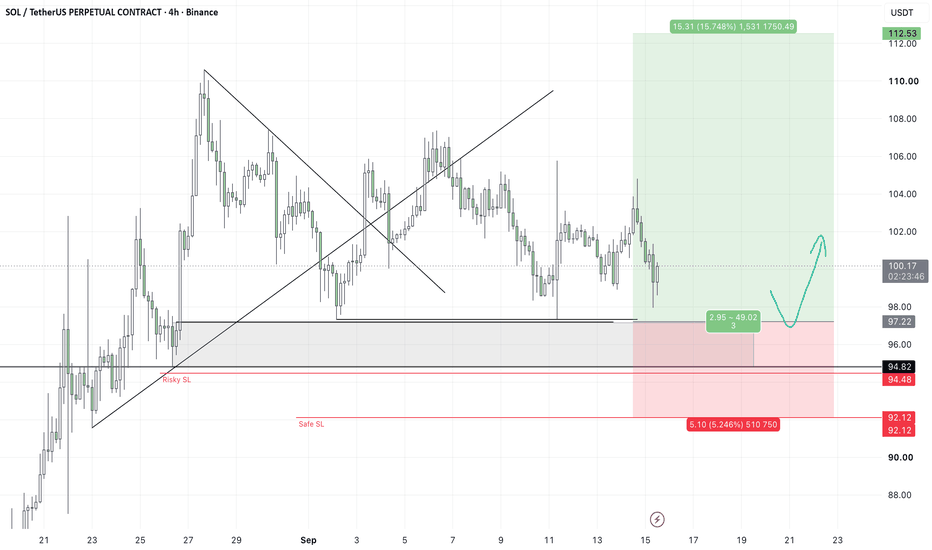
 Long
Long
PUMP — Bullish Flag Formation | Key Resistance & Breakout Level?⏱️ Time Frame: 12H
💱 Pair: PUMP/USDT
📍 Exchange: MEXC
📈 Pattern: Bullish Flag
🎯 Current Price: approximately 0.00422 USDT
---
🔎 CHART ANALYSIS
PUMP/USDT appears to be forming a Bullish Flag pattern after previously experiencing a strong upward move. This structure indicates a phase of consolidation/correction following a bullish impulse, with price moving within a channel that is gradually trending downward.
🔴 Upper resistance line → the main selling-pressure area.
🟡 Lower support line → the main buyer-defense area.
🟢 Middle line → serves as the equilibrium area within the flag.
Price is currently around 0.00422, and appears to be moving upward from the support area toward the upper resistance of the Bullish Flag.
What makes this setup interesting is that price is now approaching this resistance area. Therefore, price reaction at this resistance becomes an important point for determining the next potential direction.
---
🟢 BULLISH SCENARIO — BREAKOUT 🚀
If the 12H candle successfully breaks and closes above the Bullish Flag resistance, the pattern could experience a bullish breakout and potentially continue the previous upward trend.
📈 Key bullish confirmation:
🔓 Breakout above the Bullish Flag resistance.
🕯️ 12H candle closes clearly above resistance.
🔄 Resistance is retested as support and successfully holds.
📊 Buying momentum increases after the breakout.
If the breakout is confirmed, the next horizontal resistance areas on the chart become important:
🎯 Target 1: 0.00460
🎯 Target 2: 0.00505
🎯 Target 3: 0.00540
The 0.00540 area is important because it is near the previous high around 0.005441.
🚀 If momentum remains strong and price breaks through 0.00540–0.00544, the price structure could develop into a larger bullish continuation.
---
🔴 BEARISH SCENARIO — REJECTION / BREAKDOWN ⚠️
Conversely, if price fails to break the upper resistance and experiences rejection, PUMP/USDT could continue its consolidation phase inside the Bullish Flag.
📉 Bearish signs to watch:
❌ Price fails to break resistance.
🕯️ A rejection/long wick forms around the resistance area.
📉 The 12H candle closes back below resistance.
🔻 Price subsequently breaks below the lower Bullish Flag support.
If a breakdown occurs, the Bullish Flag structure could become invalidated, potentially opening the possibility of a deeper correction.
🔸 The middle area of the flag may act as dynamic support.
🔸 The lower flag support is around 0.00310–0.00340.
⚠️ As long as the lower support remains intact and resistance has not been broken, PUMP/USDT remains in a Bullish Flag consolidation phase.
---
🧩 PATTERN EXPLANATION — BULLISH FLAG
📐 A Bullish Flag is a bullish continuation pattern that typically appears after a strong upward impulse (flagpole), followed by a temporary consolidation or correction that generally moves downward.
In this chart:
🚀 Flagpole → the strong upward move in PUMP/USDT before entering the consolidation phase.
🔴 Upper Trendline → dynamic resistance within the flag.
🟡 Lower Trendline → dynamic support within the flag.
🟢 Consolidation Zone → the area where buyers and sellers are temporarily reaching a balance.
This pattern has two main possibilities:
🚀 Upside breakout → potentially continues the previous bullish trend.
📉 Downside breakdown → could invalidate the Bullish Flag pattern and open the possibility of a deeper correction.
---
🎯 KEY LEVELS TO WATCH
🟢 0.00460 → Resistance / Target 1
🟢 0.00505 → Resistance / Target 2
🟢 0.00540 → Major Resistance / Target 3
🔴 0.00422 → Current Price Area
🟡 0.00340–0.00310 → Lower Bullish Flag Support
---
📌 CONCLUSION
PUMP/USDT is currently at a critical area as price approaches the main resistance of the Bullish Flag.
🚀 Breakout + 12H candle close above resistance could confirm that the Bullish Flag has successfully broken out and potentially open the way toward 0.00460 → 0.00505 → 0.00540.
⚠️ Conversely, a rejection from resistance could cause price to continue consolidating inside the flag. If the lower support is subsequently broken with confirmation, the Bullish Flag pattern could become invalidated.
🔍 The key level to watch is the Bullish Flag resistance. A confirmed breakout is much more important than merely having a wick penetrate the resistance.
#PUMP #PUMPUSDT #PumpFun #Crypto  Long
Long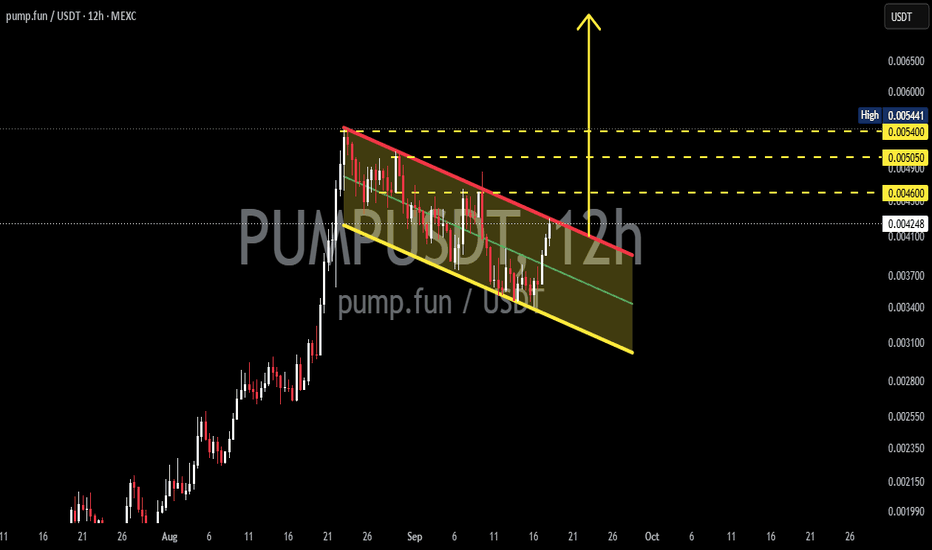
BTCUSD — Resistance Rejection & Bearish Retest SetupBTCUSD is approaching a key descending trendline resistance near 78,000, where price may face selling pressure. The chart highlights a potential rejection from this area, followed by a move back toward the 76,350–76,450 target zone.
The 78,800–79,400 Order Block (OB) remains an important higher resistance area. A sustained break and close above the descending trendline could weaken the bearish structure and require reassessment of the setup.
Key Levels:
Resistance: 78,000 area
Order Block: 78,800–79,400
Target / Support: 76,350–76,450
Key idea: Watch price reaction around the trendline before confirmation  Short
Short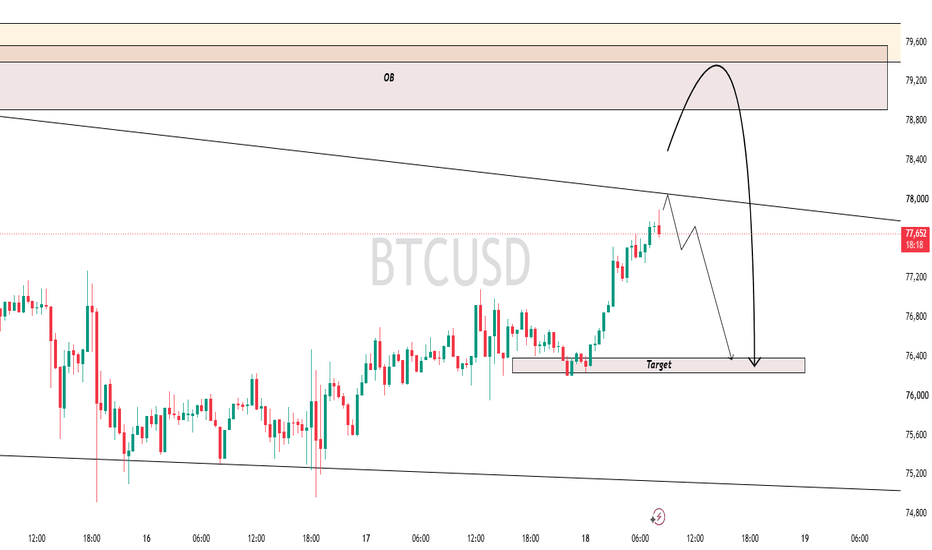
Long 
 Long
Long
OTHERS MARKETCAPThe market capitalization of crypto assets outside the top 10 is still holding the rising structure that has been developing since the 2022 cycle bottom. The latest 2026 decline returned directly into that long term support, tested it again, and produced a strong reaction. For me, that is the most important part of the chart. Despite years of relative weakness, the broader altcoin market has not lost its structural base.
At the same time, price remains trapped beneath the descending resistance that has controlled the entire structure since the 2021 peak. This creates one of the largest compression formations in the altcoin market. The lower boundary continues to rise while the upper boundary continues to fall. The available space is disappearing.
The current rebound has already moved OTHERS back toward roughly 210 to 220 billion dollars. If this recovery continues, the next major destination is the upper part of the structure around the 400 to 450 billion dollar region. That area has rejected the market repeatedly and remains the real gate separating another internal recovery from a much larger expansion.
What makes the setup interesting is the asymmetry. Small and mid sized altcoins have spent years losing attention, liquidity and confidence, yet their aggregate capitalization continues to build higher long term lows. The market looks exhausted, but the underlying structure has survived.
At the same time, OTHERS dominance is beginning to challenge the descending trendline that has controlled smaller altcoins since 2021. The first major rejection came in 2024, another followed in 2026, and now dominance is pushing back into the same barrier from a higher base. If this trend finally breaks, it would reinforce the message from the market cap chart: capital is not only returning to altcoins in USD terms, it may also be starting to rotate deeper into the risk curve.
That is the part that matters most. OTHERS is holding its long term base while OTHERS.D is attacking a five year ceiling. If both structures resolve higher together, the next phase of the altcoin market could look very different from the last several years
My view remains constructive. The 2026 test looks much more like another major base test than the beginning of structural collapse. If OTHERS eventually breaks through the long term ceiling, years of compression could unwind very quickly. altcoin market has spent years building pressure. The next important question is no longer whether the base exists, but what happens when the ceiling finally gives way.  Long
Long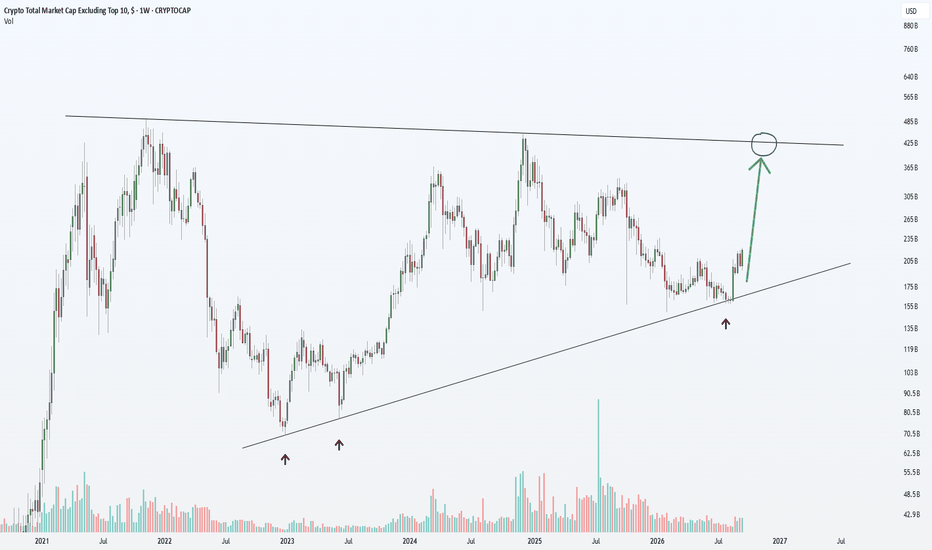
LPT at the Turning Point — Breakout or Another Rejection?💵 Coin: UPCOM:LPT — Livepeer/USDT
⌛ Time Frame: 4D
📍 Exchange: OKX
📉 Pattern: Descending Trendline
💰 Price on chart: around $1.457
🔻 Swing Low: $1.159
🎯 Key Resistance: $1.620 → $1.850 → $2.050 → $2.510 → $2.800 → $3.830
---
📉 Descending Trendline Pattern
The LPT chart is showing a long-term downtrend, with price consistently forming lower highs and trading below the descending yellow trendline.
🔻 The Descending Trendline has acted as dynamic resistance, limiting previous upward movements over the observed period.
📌 As long as price remains below the trendline, the bearish structure remains the primary reference.
However, the more often a trendline is tested, the more important that area becomes to watch. A breakout and confirmation above the trendline could represent a significant structural change.
---
🟢 Bullish Scenario
🚀 The bullish scenario would begin to gain confirmation if LPT successfully breaks out and holds above the Descending Trendline.
If the breakout occurs with increasing volume and the 4D candle delivers a convincing close above the trendline, a potential structural shift from bearish conditions toward recovery/bullish momentum becomes more relevant.
🎯 Key resistance targets:
🟡 $1.620 — initial resistance
🟡 $1.850 — next resistance
🟡 $2.050 — important resistance
🟡 $2.510 — next resistance
🟡 $2.800 — significant resistance area
🟡 $3.830 — major resistance on the chart
🚀 $4.830 — extended target if strong bullish momentum develops
📈 If price successfully breaks through these resistance levels one by one, the recovery structure could become stronger.
⚠️ Important note: a trendline breakout alone does not automatically mean a trend reversal. Ideally, price should show a close above the trendline + successful retest + continuation.
---
🔴 Bearish Scenario
🐻 If LPT fails to break the Descending Trendline and experiences another rejection, bearish pressure could continue.
📉 A failed breakout could cause price to retest the nearest support areas.
🔻 $1.457 is the approximate price area shown on the chart.
🔻 If selling pressure becomes stronger, attention may shift toward $1.159, which represents the visible low on the chart.
⚠️ A breakdown below $1.159 could indicate that the long-term bearish structure remains dominant and could increase the risk of forming a new low.
---
⚖️ Conclusion
📊 LPT remains within a long-term Descending Trendline structure.
🔴 Bearish: price remains below the trendline → resistance remains dominant → the risk of rejection and another support retest remains open.
🟢 Bullish: breakout + close above the Descending Trendline → successful retest → continuation → $1.620 / $1.850 / $2.050 / $2.510 / $2.800 / $3.830 become the key levels to watch.
🚀 The $3.830–$4.830 area becomes an interesting upside zone if the trendline breakout is properly confirmed and momentum continues.
⏳ On the 4D timeframe, candle-closing confirmation is especially important to avoid getting caught in a false breakout.
---
🔥 KEY LEVELS
🔻 Support: $1.159
📍 Current: ±$1.457
🟡 Resistance: $1.620
🟡 Resistance: $1.850
🟡 Resistance: $2.050
🟡 Resistance: $2.510
🟡 Resistance: $2.800
🟡 Major Resistance: $3.830
🚀 Extended Target: $4.830
#LPT #Livepeer #LPTUSDT #Crypto  Long
Long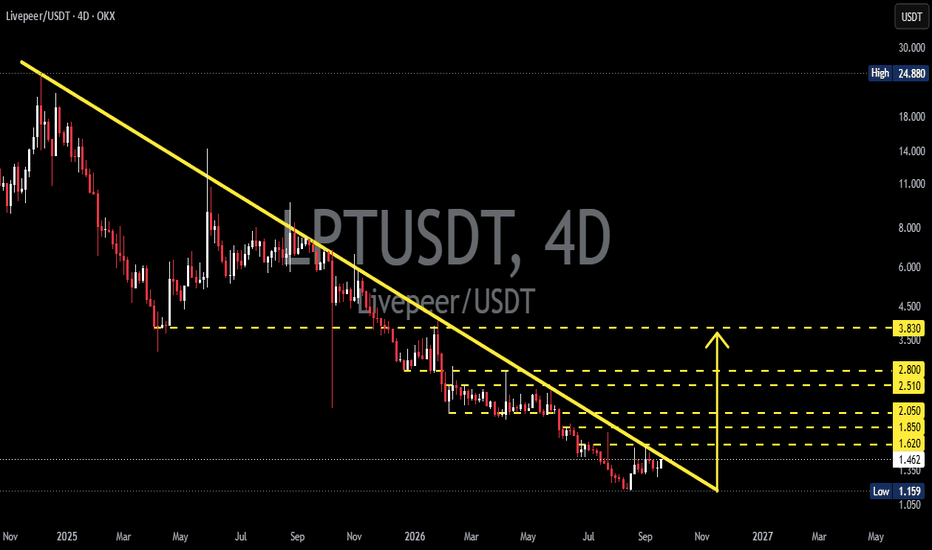
 Long
Long
FET Key Resistance Approaching — Breakout or Rejection?📊 Technical Analysis — Fetch.ai (FET/USDT)
⏳ Time Frame: 4D
📍 Current Price: around $0.1814
---
📉 Pattern: Descending Trendline
🔻 The chart shows a long-term Descending Trendline formed from the peak area around $2.1950, connecting a series of lower highs through the current period.
📌 As long as price continues to move below the descending trendline, the long-term structure remains under bearish pressure.
📉 However, price is currently approaching an important area around the Descending Trendline, making the potential for a breakout or rejection increasingly relevant to watch.
---
🟢 Bullish Scenario — Descending Trendline Breakout
🚀 The main bullish confirmation would occur if FET manages to break above the Descending Trendline and secure a convincing 4D candle close above it.
📈 Such a breakout could indicate that long-term bearish pressure is weakening and that the price structure may enter a recovery phase.
🎯 Resistance / Target Areas:
1️⃣ $0.2400
➡️ The initial resistance that needs to be reclaimed after the breakout.
2️⃣ $0.2750
➡️ The next resistance area and an important level for measuring momentum strength.
3️⃣ $0.3130
➡️ The next resistance that could become a potential profit-taking area.
4️⃣ $0.3450
➡️ The next major resistance zone.
5️⃣ $0.6000
🔥 If strong long-term bullish momentum develops and all previous resistance levels are successfully broken, the $0.6000 area becomes a significantly higher structural target.
📌 The more resistance levels that are successfully converted into support, the stronger the confirmation of a bullish structural shift.
---
🔴 Bearish Scenario — Rejection from the Descending Trendline
⚠️ If price reaches the Descending Trendline again but fails to break above it, this could indicate that sellers are still maintaining control.
📉 A rejection from the trendline could cause price to move lower again and retest previous support areas.
🎯 Key Areas to Watch:
🔻 $0.1450 — important short-term support.
🔻 $0.1130 — previous low area and a stronger structural support level on the chart.
🚨 If $0.1130 is convincingly broken, the bearish structure could regain stronger downside pressure and potentially lead to the formation of a new lower low.
---
⚔️ Key Chart Levels
🟡 $0.2400 — initial resistance
🟡 $0.2750 — next resistance
🟡 $0.3130 — next resistance
🟡 $0.3450 — major resistance
🟡 $0.6000 — long-term structural target
🔴 $0.1450 — important support
🔴 $0.1130 — major support / previous low
📉 Descending Trendline — key dynamic resistance
---
🔎 Conclusion
📊 FET/USDT remains within a long-term Descending Trendline structure, making a trendline breakout a very important technical factor to watch.
🟢 Bullish: Breakout + 4D close above the trendline → attention shifts toward $0.2400 → $0.2750 → $0.3130 → $0.3450, with $0.6000 as a long-term structural area.
🔴 Bearish: Rejection from the trendline → risk of retesting $0.1450, followed by $0.1130 if selling pressure continues.
⚠️ Key factor: Do not rely solely on a breakout wick. A confirmed 4D candle close and the ability of price to hold the breakout area as support will be important factors in distinguishing a valid breakout from a false breakout.
#FET #FetchAI #FETUSDT #Crypto  Long
Long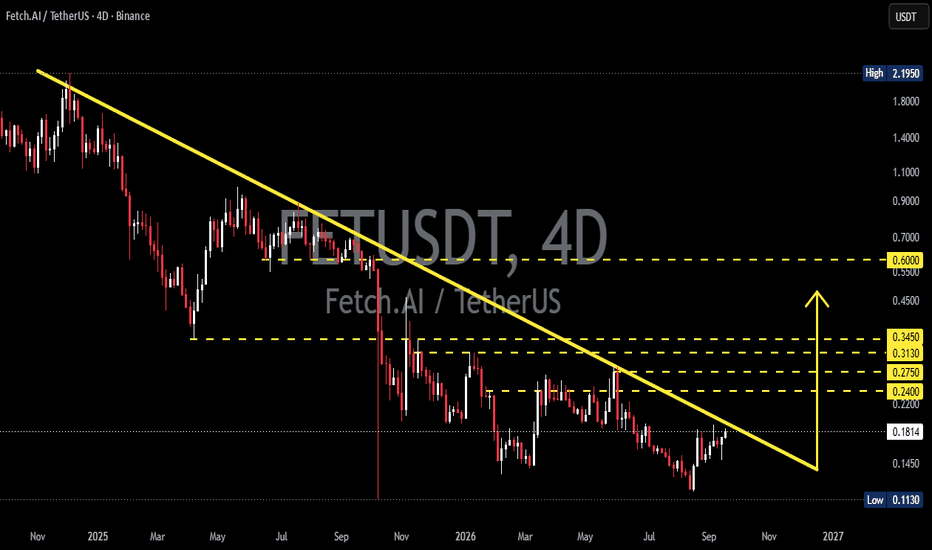
 Long
Long
Will Arthur Paper Hand $SYN Too?Arthur Hayes is the co founder of BitMEX and he has built a reputation as one of crypto’s loudest macro thinkers, always talking big cycles, big narratives, and even bigger price targets!
The story is usually the same, he lays out a long term vision for where tokens *could* go if everything plays out perfectly But the market doesn’t trade on vision alone, it trades on timing, conviction, and sometimes… impatience
The funny contrast comes from what happens after those predictions. Time and again, his exits appear far earlier than his targets would suggest. It creates this running joke in the market where people don’t just listen to what he says a token *could* reach they also quietly track how long it takes before he decides he’s done holding it
The track record being circulated is what fuels the “paper hands” narrative
KUCOIN:HYPEUSDT was talked up to $150 but exited near $61. COINBASE:ZECUSD had a $10K dream but got cut around $423. $CARDS barely had time to breathe before it was sold, and BINANCE:WLDUSDT became almost a meme itself after being declared “still held” right before it wasn’t
Whether these exits were risk management or just timing, the pattern is what people fixate on
Now the spotlight has shifted to BINANCE:SYNUSDC , which was publicly highlighted on June 29.In crypto culture, that timestamp matters more than it should because it basically starts a countdown timer in everyone’s head, Not to the target price but to the exit
The question isn’t “how high can it go,” it’s “how fast until it gets rotated out?”
And that’s the punchline of the whole narrative. Arthur’s predictions are long term, but the market experience around them has become very short term. Maybe CRYPTO:SYNUSD breaks the pattern, maybe it doesn’t but at this point, traders aren’t just watching charts. They’re watching the clock
If you are a pro crypto trader, you are already enjoying the pumps and taking profits.. If you are new to the crypto world, don’t follow or chase these whales and pumps blindly
 Long
Long
 Long
Long