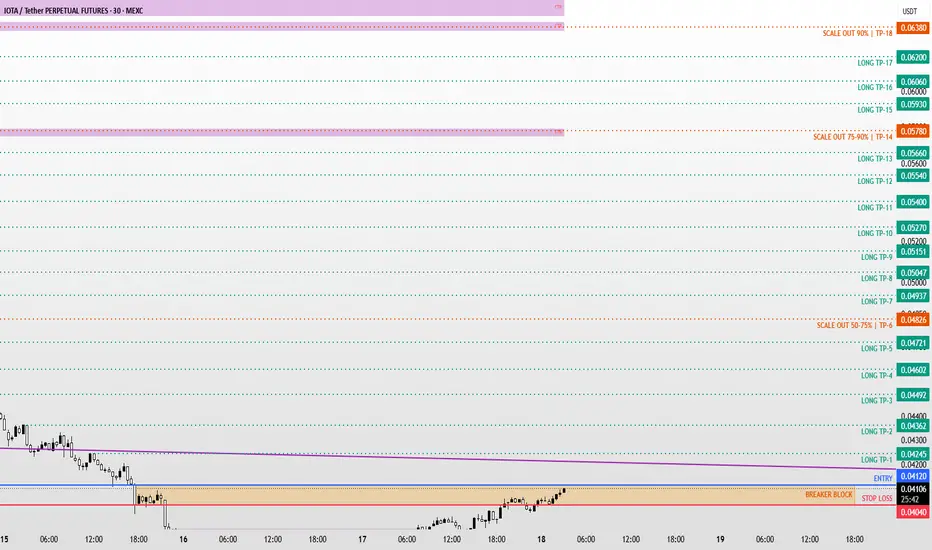
Short
Short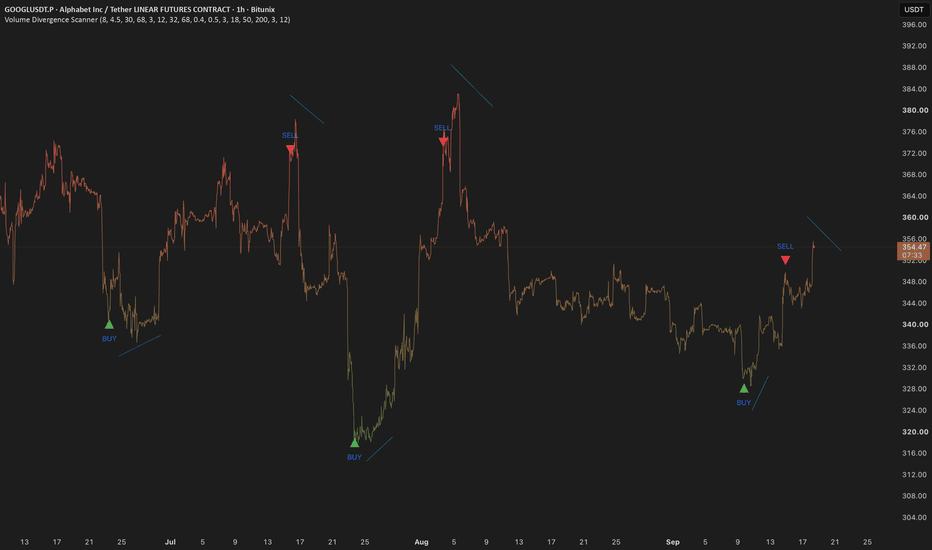
The Elephant Jungle 9/18/26 Page 3SO, WHAT’S THE PLAY, RED?
Well, right now I am looking for shorts.
I am not chasing anything. I am simply waiting for the confirmations I want to see.
As for longs, I am not interested in trying one until we reach the 4H Order Block. If we get there, then I will start watching closely to see if the Bulls give me a reason to step in.
That’s my plan for today.
Nothing complicated. Nothing forced.
Let price come to me.
I would love to hear your thoughts on the market too, so drop them in the comments and let me know what you are watching.
And like always, trade safe, use good risk management, wait for your levels, and most importantly, wait for your confirmations.
The jungle will always give you another opportunity.
You just have to make sure you’re still around when it arrives.
Until next time... iotausdt longInstructions:
Entry point: yellow
Stop loss: red
Take profit: green or blue
👉Leverage x 5-10-20 for crypto
👉Leverage x 20-50-100 for commodities, stocks, indices, and forex
👉Margin 1-5% max.
Always practice risk and money management.
Invest a maximum of 5% on any trade or across all your trades.
Invest only what you can afford to lose, as no one is in control of the market.
👉Our analyses are primarily based on:
breakouts: two trend lines (ascending and descending) and a line indicating a horizontal breakout.
chart patterns: shoulders and head, triangle parttern, elliott impulse, etc etc.
We don't always have the time to track them at all times or to represent them visibly, given the numerous signals, the number of channels to manage, and especially because of the often rapid pace of market movements.
indicators: We associate at least two indicators with this technique.
👉Depending on the circumstances, we use specific indicators, often setting 3 or more take profit levels.
👉Indeed, there are good days in trading and also bad days. No one can promise to win every trade, and like all traders worldwide, we also experience stop-loss orders. However, we win more than we lose and remain positive.
👉You can close the position before or after the take profit orders indicated by the green lines if you are personally satisfied; the same applies to stop loss orders.
👉We must stay positive, clear-headed, and humble.
We must stay courageous and, above all, prudent regarding market reversals that no one can control
👉we cannot provide all instructions or all trades here on this channel.
such as:
⚡Move your stoploss
⚡Put B.E (break even)
⚡re-entering the trade at the same entry point or lower.
⚡recovery signals provided in the event of—or following—a stop-loss (SL) hit.
⚡personalized discussions, instructions, and answers.
⚡revealing our high-performance indicators and teaching you how to configure and use them.
Good luck to us all, and may God guide us. Amen.  Long
Long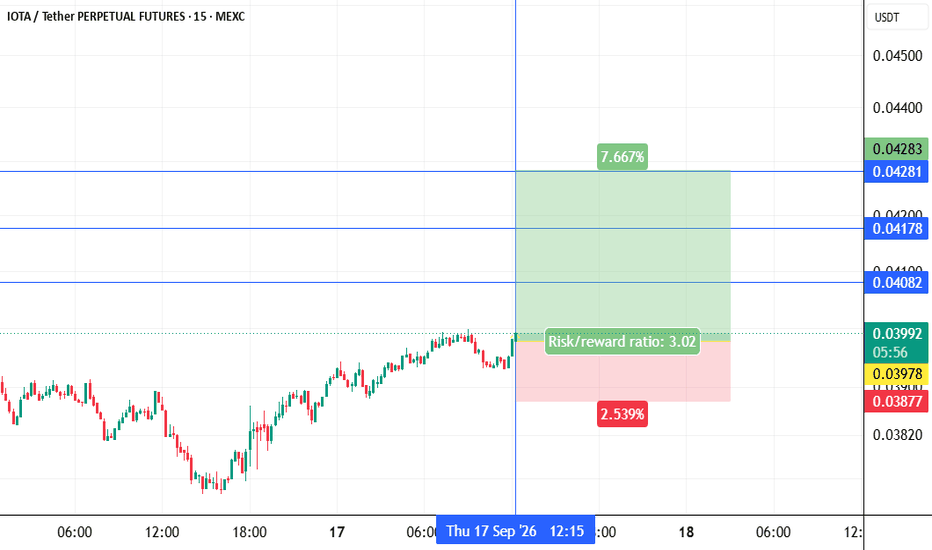
neousdt longInstructions:
Entry point: yellow
Stop loss: red
Take profit: green or blue
👉Leverage x 5-10-20 for crypto
👉Leverage x 20-50-100 for commodities, stocks, indices, and forex
👉Margin 1-5% max.
Always practice risk and money management.
Invest a maximum of 5% on any trade or across all your trades.
Invest only what you can afford to lose, as no one is in control of the market.
👉Our analyses are primarily based on:
breakouts: two trend lines (ascending and descending) and a line indicating a horizontal breakout.
chart patterns: shoulders and head, triangle parttern, elliott impulse, etc etc.
We don't always have the time to track them at all times or to represent them visibly, given the numerous signals, the number of channels to manage, and especially because of the often rapid pace of market movements.
indicators: We associate at least two indicators with this technique.
👉Depending on the circumstances, we use specific indicators, often setting 3 or more take profit levels.
👉Indeed, there are good days in trading and also bad days. No one can promise to win every trade, and like all traders worldwide, we also experience stop-loss orders. However, we win more than we lose and remain positive.
👉You can close the position before or after the take profit orders indicated by the green lines if you are personally satisfied; the same applies to stop loss orders.
👉We must stay positive, clear-headed, and humble.
We must stay courageous and, above all, prudent regarding market reversals that no one can control
👉we cannot provide all instructions or all trades here on this channel.
such as:
⚡Move your stoploss
⚡Put B.E (break even)
⚡re-entering the trade at the same entry point or lower.
⚡revealing our high-performance indicators and teaching you how to configure and use them.
⚡recovery signals provided in the event of—or following—a stop-loss (SL) hit.
⚡personalized discussions, instructions, and answers.
Good luck to us all, and may God guide us. Amen.  Long
Long
runeusdt longInstructions:
Entry point: yellow
Stop loss: red
Take profit: green or blue
👉Leverage x 5-10-20 for crypto
👉Leverage x 20-50-100 for commodities, stocks, indices, and forex
👉Margin 1-5% max.
Always practice risk and money management.
Invest a maximum of 5% on any trade or across all your trades.
Invest only what you can afford to lose, as no one is in control of the market.
👉Our analyses are primarily based on:
breakouts: two trend lines (ascending and descending) and a line indicating a horizontal breakout.
chart patterns: shoulders and head, triangle parttern, elliott impulse, etc etc.
We don't always have the time to track them at all times or to represent them visibly, given the numerous signals, the number of channels to manage, and especially because of the often rapid pace of market movements.
indicators: We associate at least two indicators with this technique.
👉Depending on the circumstances, we use specific indicators, often setting 3 or more take profit levels.
👉Indeed, there are good days in trading and also bad days. No one can promise to win every trade, and like all traders worldwide, we also experience stop-loss orders. However, we win more than we lose and remain positive.
👉You can close the position before or after the take profit orders indicated by the green lines if you are personally satisfied; the same applies to stop loss orders.
👉We must stay positive, clear-headed, and humble.
We must stay courageous and, above all, prudent regarding market reversals that no one can control
👉we cannot provide all instructions or all trades here on this channel.
such as:
⚡Move your stoploss
⚡Put B.E (break even)
⚡re-entering the trade at the same entry point or lower.
⚡revealing our high-performance indicators and teaching you how to configure and use them.
⚡recovery signals provided in the event of—or following—a stop-loss (SL) hit.
⚡personalized discussions, instructions, and answers.
Good luck to us all, and may God guide us. Amen.  Long
Long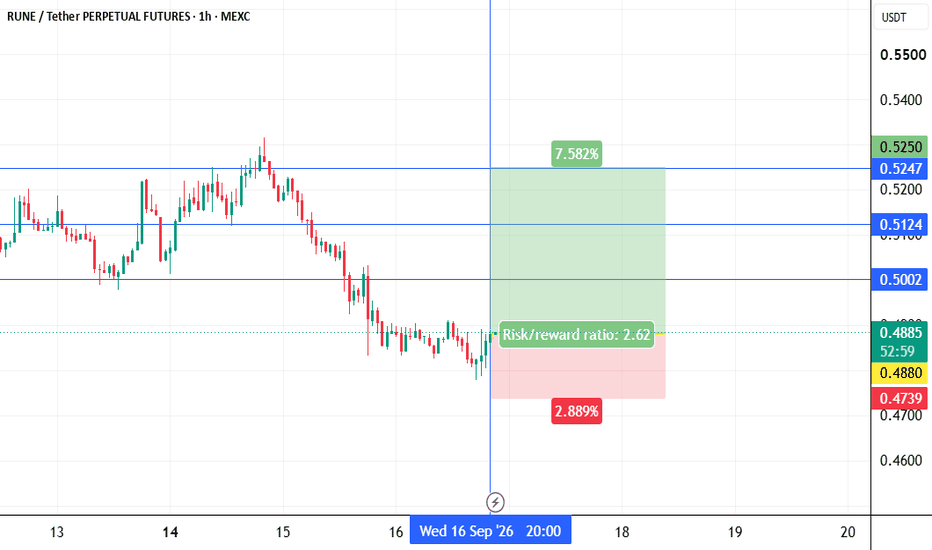
 Long
Long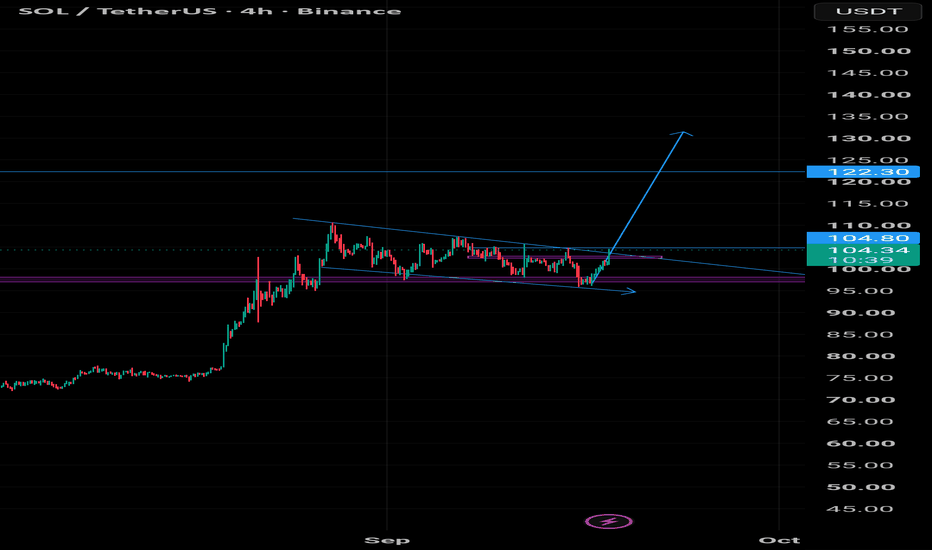
1HR Chart view: the 400MAObserve the 400MA (white, thin solid) on the 1H chart. Consider how it has become the the floor. This is a typical arrangement for gaining upward momentum into the larger, bigger picture.
This is a show of strength building towards price increases. Seems like the prices of everything has been going up lately (surely unrelated).
Let's see how things progress over the next 30-90 days.
The 400MA isnt too long for consideration, because the 400MA on the 1H chart is the 100MA on the 4H chart.
I view charts by 1H, 4H, 1D and 4D. I could consider 6H and 6D chart views, but 4 works just fine. 4D gives better information than 1W view, in my opinion.
We might see a downward turn below the 400MA on the 1H view, and the MA ribbon may twist and unwind: that's fine. When it does, then zoom out to the 4H view. In the 4H view, are we seeing prices maintain above the 400MA there?
Etcetera. Use your eyes. Mind what you see, and perceive also.
Join me also on r/XCNcharts for more.  Short
Short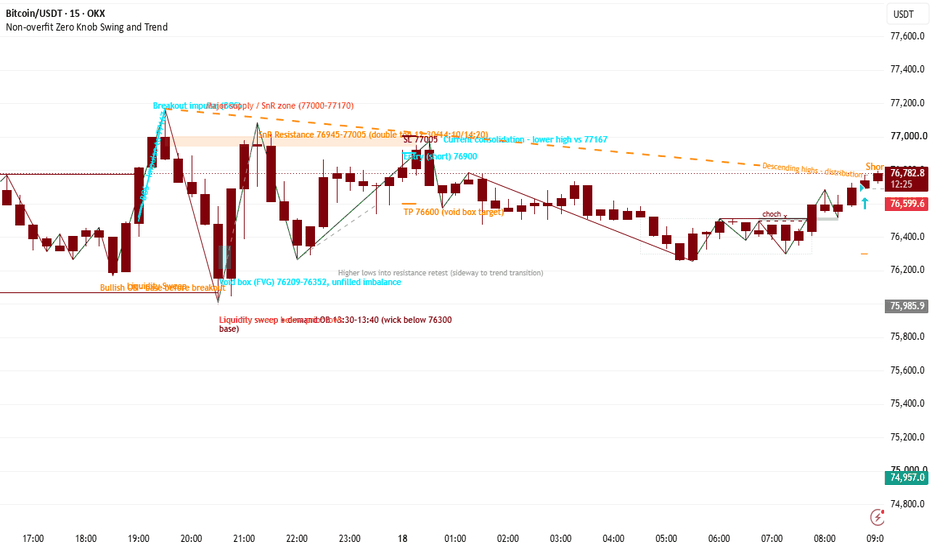
Long 
 Long
Long
Long 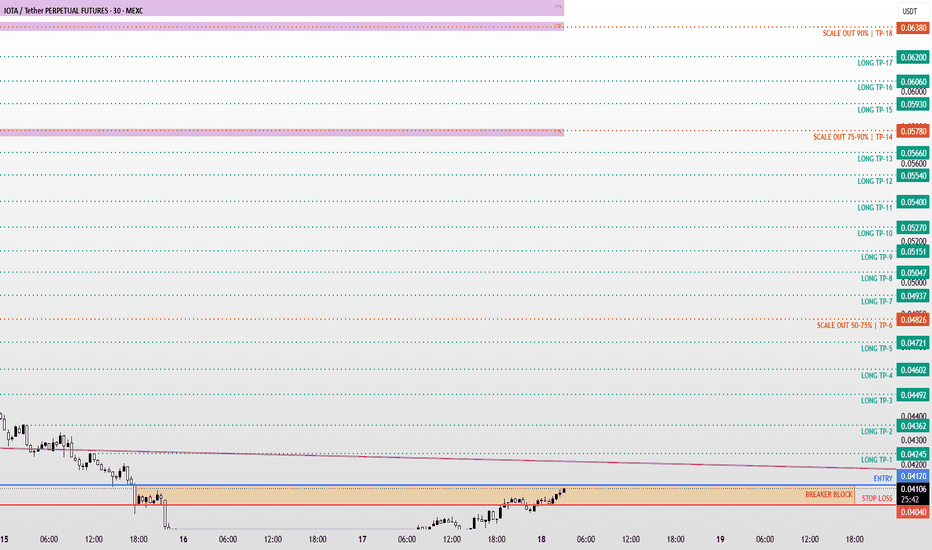
PONKE AT MAKE-OR-BREAK SUPPORTYello, Paradisers! Is PONKE about to trap impatient bears at one of the most important support zones on the chart before attempting a much stronger upside expansion?
💎PONKEUSDT is currently trading around $0.0207 after another rejection from the upper boundary of the 4H falling wedge. While the lower timeframes remain bearish, the bigger picture is becoming increasingly interesting because price has once again reached a major Daily support area around $0.0198–$0.0186.
💎What makes this zone especially important is the market structure developing around it. PONKE has now tested approximately the same support area three times, creating a potential triple-bottom structure. At the same time, this support also aligns with the lower boundary of the falling wedge and an important former Daily resistance zone that is now being tested as support.
💎This creates a clear conflict between the timeframes. The 1H and 4H structures remain bearish, meaning there is still no confirmed short-term reversal. However, the Daily and Weekly structures remain bullish, which is why aggressively chasing shorts directly into this support would carry significantly worse risk-to-reward.
💎For the bullish scenario to gain confirmation, PONKE first needs to hold the current support and reclaim the falling-wedge resistance. Above that, the $0.0230–$0.0235 region becomes the next important obstacle, where the 4H resistance and high-volume trading area are located.
💎A successful breakout and acceptance above this region could open the way toward the next major Daily resistance zone around $0.0270–$0.0280. That would represent a meaningful expansion from the current price and could quickly bring momentum back into the market.
💎However, confirmation matters. A temporary bounce from support is not enough to declare the correction finished. Until PONKE breaks the falling wedge and starts closing above the nearby resistance levels, the short-term bearish structure technically remains intact.
💎The bullish thesis becomes significantly weaker if price loses the $0.01801 support area on a confirmed candle closing basis. Such a breakdown would invalidate the current triple-bottom idea and indicate that sellers remain in control.
💎This is exactly the type of situation where patience becomes more valuable than prediction. The potential upside is attractive, but entering before confirmation means accepting unnecessary risk. Professional traders do not need to catch the exact bottom; they need to participate when the probabilities become favorable.
Strive for consistency, not quick profits. Treat the market as a businessman, not as a gambler. Discipline, patience, and waiting for confirmation are what keep traders inside the winner's circle.
MyCryptoParadise
iFeel the success🌴  Long
Long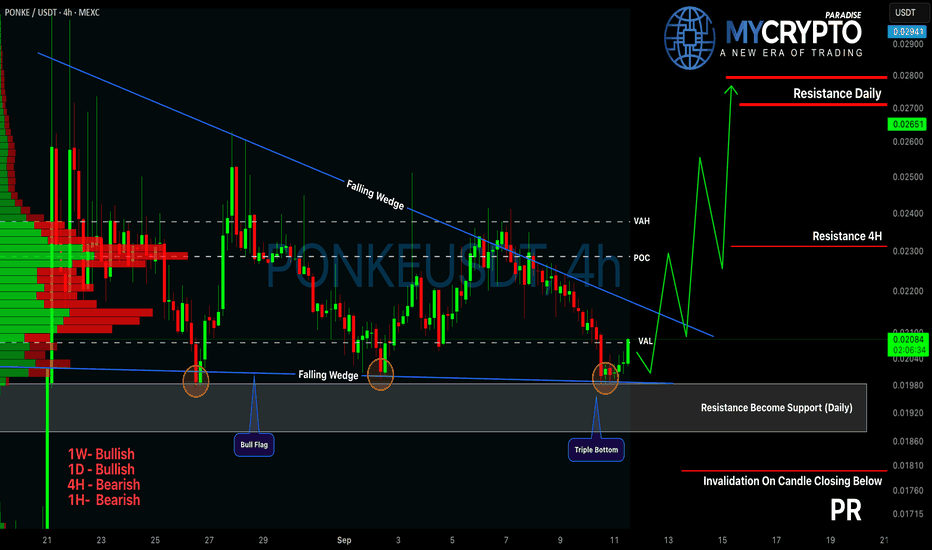
thetausdt long Roddy01-SIGNALSPROVIDERInstructions:
Entry point: yellow
Stop loss: red
Take profit: green or blue
👉Leverage x 5-10-20 for crypto
👉Leverage x 20-50-100 for commodities, stocks, indices, and forex
👉Margin 1-5% max.
Always practice risk and money management.
Invest a maximum of 5% on any trade or across all your trades.
Invest only what you can afford to lose, as no one is in control of the market.
👉Our analyses are primarily based on:
breakouts: two trend lines (ascending and descending) and a line indicating a horizontal breakout.
chart patterns: shoulders and head, triangle parttern, elliott impulse, etc etc.
We don't always have the time to track them at all times or to represent them visibly, given the numerous signals, the number of channels to manage, and especially because of the often rapid pace of market movements.
indicators: We associate at least two indicators with this technique.
👉Depending on the circumstances, we use specific indicators, often setting 3 or more take profit levels.
👉Indeed, there are good days in trading and also bad days. No one can promise to win every trade, and like all traders worldwide, we also experience stop-loss orders. However, we win more than we lose and remain positive.
👉You can close the position before or after the take profit orders indicated by the green lines if you are personally satisfied; the same applies to stop loss orders.
👉We must stay positive, clear-headed, and humble.
We must stay courageous and, above all, prudent regarding market reversals that no one can control
👉we cannot provide all instructions or all trades here on this channel.
such as:
⚡Move your stoploss
⚡Put B.E (break even)
⚡re-entering the trade at the same entry point or lower.
⚡revealing our high-performance indicators and teaching you how to configure and use them.
⚡recovery signals provided in the event of—or following—a stop-loss (SL) hit.
⚡personalized discussions, instructions, and answers.
Good luck to us all, and may God guide us. Amen.  Long
Long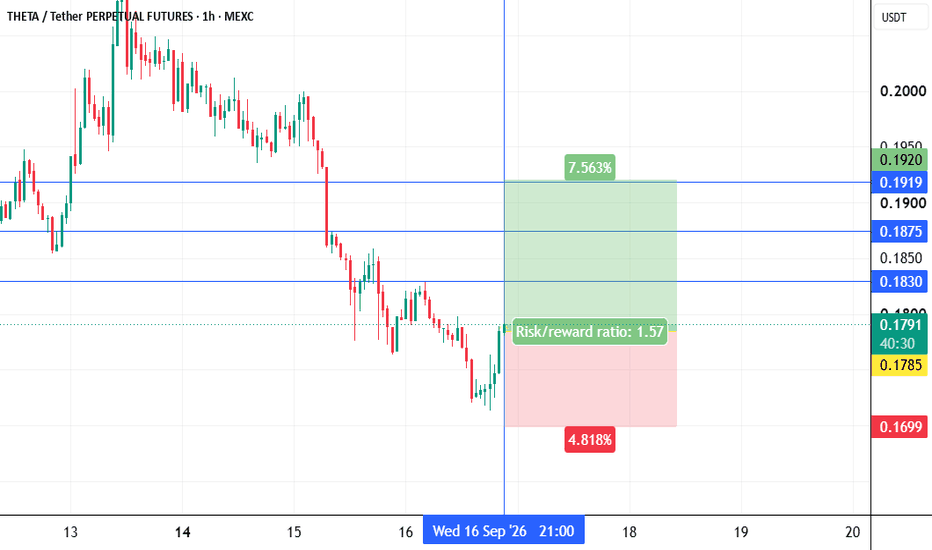
ETH: From a Falling Wedge to a $4,300 Recovery ScenarioEthereum’s daily chart is showing a change in structure. The declining resistance that controlled price for months has been broken, and the recent advance has brought ETH back to an important horizontal pivot.
The next test is whether buyers can establish the $2,400–$2,450 area as support.
This region repeatedly attracted selling during the earlier consolidation. Holding it from above would strengthen the case that the balance between buyers and sellers is changing.
There is another constructive detail: ETH is consolidating after its sharp August advance while the daily EMA, currently near $2,280 on the chart, turns higher beneath price. Buyers have retained much of that advance so far. A successful support retest would give the recovery a stronger foundation.
My upside roadmap has three stages:
🔹 $2,670 — breakout confirmation. A daily close above the recent high, followed by price holding the breakout area, would support another expansion higher.
🔹 $3,180 — first target. This sits ahead of the broader $3,300–$3,600 supply zone, where earlier selling was aggressive. I expect that region to test the strength of any recovery.
🔹 $4,280–$4,300 — final target. This allows an exit ahead of the higher resistance cluster around $4,400–$4,420, where multiple Fibonacci measurements converge.
Using $2,450 as the reference entry, the final objective offers approximately 75% upside. The chart’s invalidation level near $1,820 implies roughly 26% downside, putting the full-target reward-to-risk around 2.9:1, before costs. This is a position trade, and the sizing needs to reflect that stop distance.
A sustained loss of the $2,400 area would be an earlier warning that the recovery is losing momentum. I would reassess the setup rather than assume every pullback is a buying opportunity.
The potential implications extend beyond ETH.
For an altcoin-season thesis, I would want Ethereum to outperform Bitcoin, BTC dominance to decline, and strength to spread across more altcoins. An ETH rally accompanied by those developments would provide much stronger evidence of capital rotating into the wider market.
My bullish case rests on that sequence: support holds, resistance breaks, and participation broadens. The $4,300 objective remains a conditional recovery scenario, with clear levels to judge whether it is progressing.  Long
Long
 Long
Long
 Long
Long
Bitcoin price says one thing, time says anotherBitcoin: price says one thing, time says another
I have said this many times.
Bitcoin is not like any other asset.
The reason is simple. Every four years the halving cuts the new supply in half. That single rule gives Bitcoin something no stock has, a clock. And when you put the halvings on the chart, the cycles are easy to see.
I measure each cycle from its top, in weeks, not in dollars.
In the three completed cycles we have (2014, 2018 and 2022), the correction phase lasted about 60 weeks each time. Three cases is a small sample, I know. But three out of three is not nothing.
Now look at where we are. The low of this cycle, for now, sits at week 40. We are at week 50 today.
But so many people said the low is in, the correction is over. Maybe. But a low at week 40 would be the earliest of any cycle so far, by a wide margin. History says this phase is not usually finished by now. So the time window I watch runs about ten more weeks. Not a target. A clock.
Let me tell you what I do with this. In the past cycles, this part of the clock was where the risk was smallest compared to the reward . Price was already far below the top, and time was running out for the sellers. That is where I did my buying. I cannot tell you where price goes from here. Nobody can. What I can tell you is that the poker player does not play every hand. He waits for the moment when the odds are on his side, and this is the moment the clock points at.
Most people only look at price. But the market has two axes, and the horizontal one counts too. Long