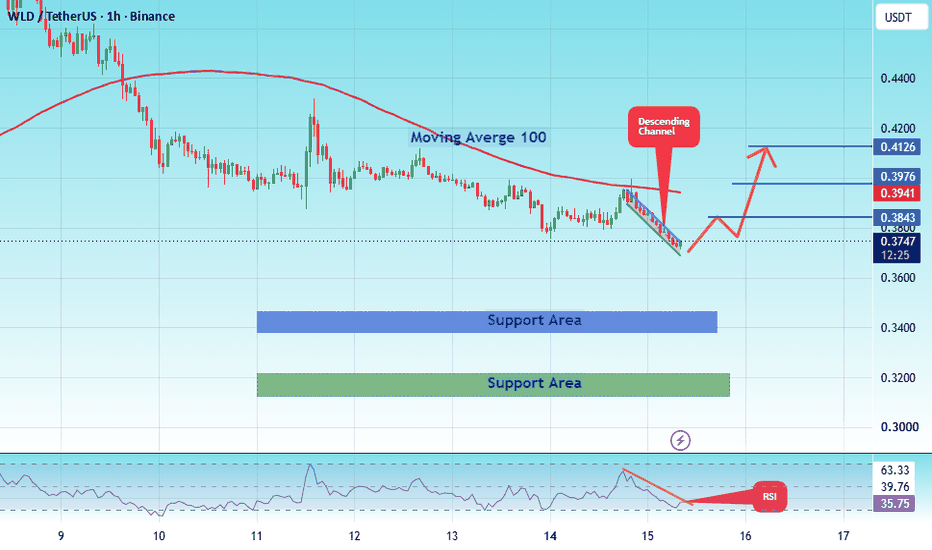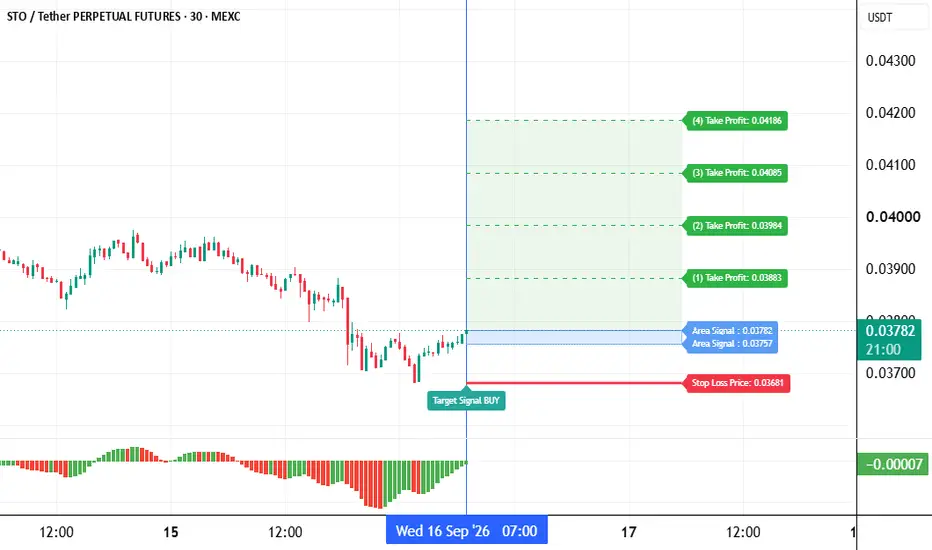
WLD USDT LONG SIGNAL#102 WLD/USDT – Trade Setup (LONG)
📈 Position Type: LONG
🕒 Timeframe: 1H
📊 Market: Futures
💰 Entry Zone:
0.3761
0.3610
🛑 Stop-Loss:
0.3515
🎯 Take-Profit Targets:
• TP1: 0.3874
• TP2: 0.4020
• TP3: 0.4180
• TP4: 0.4365
⚙️ Leverage:
5 *
▫️ After TP1, move SL to Entry + 0.2%.
▪️ Exit Plan:
• 40% at TP1
• 20% at TP2
• 20% at TP3
20% at. TP4
📌 Risk Management:
Risk only 1–2% of your capital per trade.
⚠️ Always check and confirm the setup on your chart before entering the trade.
Crypto market
BTC at a resistance point.. A inverse H&S or Further Breakdown
Bitcoin has now tapped the major trendline drawn across the full structure. This puts price at an important decision point, while BTC is still trading inside the broader range and below the main resistance around $68.8K–$70K.
In the bullish case, I am watching for either a bounce off the monthly average or a retracement toward the $60K area to form our third leg and complete the larger inverse head-and-shoulders structure.
If this structure develops and the broader $59K–$58K support area holds, BTC could establish the right shoulder before attempting to reclaim the local range highs. The first important levels to recover would be around $65K–$66K, followed by the resistance near $68.8K. A confirmed breakout above that area would strengthen the larger reversal scenario.
The alternative is that BTC does not form the inverse head-and-shoulders and instead breaks the range down already. A decisive loss of the $59K–$58K region would weaken or invalidate the bullish setup and could lead to further downside toward $57.1K, $56.2K, $55.3K and potentially $53K.
For now, I am watching whether BTC holds the monthly average or moves toward $60K to form the third leg of the larger inverse H&S—or whether the range breaks down and the market continues lower.
ETH: Upgrading a 1905 to 2000 Long Idea Using MA & Order BlocksToday, I am stress-testing an ETHUSDT trade based on longing the bounce off ascending support up to the 1,950 breakout zone, targeting 2,000 psychological resistance. The original parameters feature an entry at 1,905, a take-profit at 1,995, and a stop-loss at 1,875. I am optimizing these levels using Moving Averages, Volume Profile, and Order Blocks.
💡 IDEA
The bullish hypothesis rests on the 4h and 15m trends, looking for a bounce off ascending support up to the 1,950 breakout zone toward 2,000. However, the original setup contains flawed execution parameters.
🛫 ENTRY
The entry was adjusted from 1,905 to 1,901.5 to maximize technical confluence.
This new level aligns with the 1h EMA50 at 1,901.46, the 14-day Volume Profile Value Area High at 1,900.58, and sits within an unmitigated 15m bullish Order Block spanning 1,899.44 to 1,903.51. If the 15m trend extreme high at 1,953.64 is swept first, the order must be canceled.
💰 TAKE-PROFIT
The original take-profit at 1,995 ignored major overhead resistance. The target was lowered to 1,953 to front-run the 15m trend extreme high at 1,953.64 and the 1h/4h resistance zone at 1,946.75, ensuring an exit before potential trend reversals.
🛡️ STOP-LOSS
The stop-loss was shifted from 1,875 to 1,880 to avoid a key market trap.
The original stop-loss at 1,875 sat directly on the 14-day Point of Control at 1,875.25, acting as a liquidity magnet. The new level at 1,880 sits safely below the 15m swing at 1,888.62, the ATR threshold at 1,881.41, and the 15m Order Block at 1,881.31.
⚖️ RISK-TO-REWARD
The risk-to-reward ratio changed from 1:3 to 1:2.39 based on 21.5 points of risk and 51.5 points of reward.
Although lower than the original ratio, this adjustment improves structural safety and overall trade probability while retaining a solid asymmetric edge.
BTC LONG vs SHORT
The bullish market structure is still playing out.
We've reached a major resistance zone, where I'm seeing a notable concentration of sellers around $66,400 and $67,000.
On ETH, the order flow looks different. While buyers are still present there, #BTC is showing increasing selling pressure. If that continues, it could trigger a pullback to retest the newly formed IFVG before the next leg of the move.
We've already broken above the local high, but the direction is still unclear. For now, the best approach is to stay patient and observe.
LONG vs SHORT
I expect July to close in the green.
That's still my base scenario for the end of the month.
My concern is that if this plays out, August could disappoint newcomers while delivering a real surprise to long-term holders.
BTC Rejects 67K - Momentum Fading - Jul 21 PMCurrent Price & Time:
BTC is trading at 66591 USDT as of 2026-07-21 15:31 UTC.
Multi-Timeframe Structure:
Daily structure is bullish, with price well above the 1D MA5 at 65066 and the 1D MA30 at 62772. The 4H structure is also bullish, with price above the 4H MA5 at 65989 and the 4H MA30 at 64581. The 1H structure is bullish, with price above the 1H EMA55 at 65324. The oscillation assessment confirms trending behavior, with 8 of the last 8 hourly closes above the EMA55 and zero crossings. The distance from the EMA55 is 1.94%, exceeding the 0.3% threshold for range-bound conditions. The overall multi-timeframe structure is bullish, but the 1H RSI at 81.21 signals overbought conditions, introducing convexity risk.
Chart Signals:
The 1H MACD histogram is positive at 62.55 but has flattened from a recent peak, indicating momentum divergence. The 1H RSI at 81.21 is in overbought territory, suggesting a potential mean reversion. The 15M MACD histogram is negative at -20.60, with the DIF crossing below the DEA, confirming short-term momentum exhaustion. The 15M RSI at 55.72 is neutral, but the divergence between the 1H overbought reading and the 15M negative histogram creates a risk-reward asymmetry favoring a short-term pullback. The recent price action shows a long upper wick on the 1H candle near 66700, which is a topping pattern.
Key Liquidity Levels (Demand/Supply):
Demand (Support): 65324 (1H EMA55), 64581 (4H MA30)
Supply (Resistance): 66717 (15M MA5), 67000 (psychological round number)
Chart Markup Guide for this setup:
- Draw a horizontal dashed line at 65324 (1H EMA55) — this is your bull/bear pivot.
- Mark the Demand zone between 65324 and 64581 with a green rectangle.
- Mark the Supply zone between 66717 and 67000 with a red rectangle.
- Watch for a 15m close below 66456 (15M MA30) as the trigger for the short scenario.
Scenario Analysis (If-Then):
- If BTC holds above 65324 (1H EMA55) and reclaims 66717 (15M MA5), then upside target is 67000, then 67500.
- If BTC breaks below 65324 (1H EMA55), then downside target is 64581 (4H MA30), then 64000.
Trading Plan:
Direction: Bearish bias above 66717, with a short trigger on a 15m close below 66456.
Entry: Short on a 15m close below 66456 (15M MA30), with confirmation from a 15M MACD histogram deepening below -20.
Stop-Loss: 66800 (above the recent 1H high).
Target-1: 65324 (1H EMA55).
Target-2: 64581 (4H MA30).
Risk-Reward Ratio: 1:2.8 (risk 209 points to target 1143 points).
Invalidation Level:
A 15m close above 66800 would invalidate the short setup, as it would signal a rejection of the topping pattern and a continuation of the bullish momentum. A 1H close above 67000 would also invalidate, as it would break the supply zone and suggest a liquidity cascade to the upside.
Disclaimer:
This analysis is for informational and educational purposes only. It does not constitute financial advice. Past performance is not indicative of future results. All trading decisions carry risk and are your sole responsibility.
📊 QilanX Backtest Reference
🕒 Last Backtest: 07-21 07:00:39
Total Signals: 3095 Backtested: 2345 Accuracy: 76.5% (1795/2345)
$XRP Update XRP has finally broken above the descending trendliCRYPTOCAP:XRP Update
XRP has finally broken above the descending trendline, which is an encouraging shift after months of weakness.
The next key test is the 50 and 99 EMAs. If buyers can push through those levels and secure a daily close above $1.24, the chart will turn much more bullish and the recovery could accelerate.
For now, the breakout looks solid. As long as XRP stays above the trendline, I'm expecting more upside in the coming days.
$BSB / USDT: Macro Elliott Wave 3 Expansion SetupStrategy: Mid to Long-Term Bullish Accumulation / Reversal
Pattern: Daily Falling Wedge at Wave 2 Demand Apex
Current Price Zone and ideal Entry Price Zone: $0.129 – $0.138
📊 Elliott Wave & Fibonacci Level Breakdown
Wave 1 (Initial Impulse): Established the primary structural swing high from cycle lows near $0.080 up to resistance.
Wave 2 (Current Bottoming Phase): Retracing 61.8% – 78.6% Fib of Wave 1 into the current $0.125 – $0.138 demand pocket. Limit order absorption (flat price despite sell CVD) signals this macro pullback is completing inside the falling wedge apex.
Wave 3 (Macro Parabolic Expansion): Projected 1.618x – 2.618x Fib extension of Wave 1. Upside expansion targets $0.35 – $0.85.
Wave 4 (Consolidation / Pullback): Projected shallow 23.6% – 38.2% Fib retracement of Wave 3.
Wave 5 (Macro Blow-Off Top): Projected 0.618x – 1.000x Fib extension of Waves 1–3 combined, targeting $1.50 – $2.00+.
🔄 Reloading Scenarios: Wave 2 vs. Wave 4 Strategy
🔥 Primary Opportunity: Wave 2 Reloading (Heavy Capital Deployment)
Zone: $0.125 – $0.138 (Current Golden Pocket / Wedge Apex)
Rationale: Wave 2 offers the maximum Risk-to-Reward ratio across the entire Elliott Wave cycle. Reloading heavily here allows you to front-run the longest, most violent leg of the trend (Wave 3) while maintaining a tight, well-defined invalidation level.
Execution: Maximize position sizing in this accumulation floor.
⚡ Secondary Opportunity: Wave 4 Reloading (Optional Scale-In)
Zone: Shallow pullback zone after Wave 3 completion (estimated around $0.32 – $0.38, depending on Wave 3 peak).
Rationale: Wave 4s in altcoin macro trends tend to be brief, complex, or shallow (23.6%–38.2% Fib). Reloading here is strictly optional for compounding gains or adding trailing margin before Wave 5, but offers significantly less R:R compared to the Wave 2 base.
🎯 Key Targets & Risk Management
Invalidation / Stop Loss: Daily close below $0.120 (Invalidates Wave 2 bottom structure)
TP 1 (Wave 3.1 Breakout / Wedge Target): $0.35 – $0.50
TP 2 (Wave 3 Macro Extension): $0.75 – $0.85
TP 3 (Wave 5 Cycle Ceiling): $1.50 – $2.00
#BSB #CryptoTrading #ElliottWave #Fibonacci #Altcoins #TradingSetup
BULL TRAP?Eyes on Bitcoin ladies and gentlemen, Bull Trap is completed and Trigger is in progress.
Book your gains NO IFs or BUTs. When you have a set up like that you take action.
Once the Trigger is completed on the 4hrs TF you will see it as a Big Green Candle on the Daily.
Don't try to get the last penny that leave it to the newbies.
Is MET Building Momentum Again? A Look at the analysis.MET seems to be moving again. One thing I like about this chart is that it's finally showing signs of life after spending days trapped inside a heavy accumulation range.
According to the 4H chart, MET has shown a notable recovery after printing a local bottom around $0.128-$0.130, followed by a strong impulsive move back above $0.16. The latest candles suggest buyers are stepping back in, although the price is now approaching a resistance area where previous rallies have struggled.
Chart Analysis:
After weeks of lower highs and steady selling pressure, MET finally found strong demand near the $0.13 zone. That support triggered a sharp reversal accompanied by rising volume, often a sign that larger participants are accumulating rather than simply short-covering.
The recent breakout toward $0.17 confirms renewed momentum, but price has pulled back slightly, which is healthy after such a fast move. As long as MET continues holding above $0.155-$0.145, bulls remain in control of the short-term trend.
Why More Eyes Are Turning Toward BITGET:METUSDT :
One of the biggest reasons traders have started watching Meteora more closely is the expansion of its ecosystem through the new Referral Staking Program.
This introduces another layer of utility for MET holders by allowing staking rewards to benefit from the growth of Meteora's liquidity network and DLMM-generated trading activity. Instead of relying purely on market sentiment, the token gains stronger connections to actual protocol usage.
The combination of improving token utility and renewed buying pressure helps explain why MET has started appearing on more traders' watchlists.
Market Outlook:
MET is becoming a project worth keeping on the watchlist; not only because of recent price action, but also because the narrative is increasingly being supported by expanding utility and growing activity within the Solana DeFi ecosystem.
The current chart doesn't suggest a full trend reversal just yet, but it does indicate that momentum has shifted significantly compared to the prolonged downtrend seen earlier. Buyers have defended key support, volume is improving, and higher lows are beginning to form.
For now, I'm watching the reaction around $0.145 very closely. Hold that level, and I think the market has a realistic shot at challenging $0.17-$0.18 again before attempting the bigger $0.19 resistance. However, if MET collapses, I will start DCAing it on Bitget for the long-term.
As always, this is just my personal chart view; not financial advice. So always DYOR.
Martons Group: Can Bitcoin's Breakout Sustain Its Bullish MomentBitcoin has once again captured the attention of global financial markets as recent price action suggests a potential breakout from a prolonged period of consolidation. Rising trading activity, renewed investor optimism, and improving market sentiment have fueled discussions about whether the current upward movement represents the beginning of a stronger bullish trend or simply another short-term rally within a volatile market cycle.
At Martons Group, cryptocurrency market analysis is built on evaluating multiple factors rather than relying solely on price movements. Technical indicators, macroeconomic conditions, institutional participation, liquidity, and investor behavior all contribute to understanding whether bullish momentum can be maintained over time.
The latest market developments demonstrate why disciplined analysis remains essential when navigating rapidly changing digital asset markets.
Bitcoin Shows Signs of Strength
After several weeks of relatively stable trading, Bitcoin has demonstrated renewed upward momentum. Breaking above important technical levels has attracted increased attention from traders who are monitoring whether buyers can maintain control of the market.
At Martons Group, analysts note that strong price movements often generate additional market participation as investors respond to improving sentiment. Increased trading volume frequently accompanies significant breakouts, providing additional confirmation that market activity is strengthening.
However, sustained trends typically require continued buying interest rather than isolated price spikes.
What Drives Bullish Momentum?
Several factors may contribute to stronger upward momentum in cryptocurrency markets. Institutional participation, improving macroeconomic conditions, expanding blockchain adoption, and increasing investor confidence often work together to support positive market sentiment.
According to specialists at Martons Group, no single catalyst determines long-term price direction. Instead, market trends develop through the interaction of multiple economic and financial variables.
Understanding these broader influences helps investors evaluate whether current momentum has the potential to continue over a longer period.
The Role of Technical Analysis
Technical analysis remains an important tool for understanding market behavior. Support and resistance levels, trading volume, momentum indicators, and trend structures help traders evaluate the strength of current market movements.
At Martons Group, technical analysis is viewed as one component of a broader research process rather than a standalone forecasting method. Price patterns become more meaningful when interpreted alongside market fundamentals and macroeconomic developments.
Combining multiple analytical perspectives provides a more balanced understanding of evolving market conditions.
Institutional Investors Continue to Influence the Market
Institutional participation has become one of the defining characteristics of today's cryptocurrency market. Large investment firms, asset managers, and financial institutions continue expanding their involvement in digital assets.
At Martons Group, analysts observe that institutional investors often contribute to improved market liquidity and greater long-term stability. Their investment decisions increasingly reflect broader evaluations of blockchain technology, regulatory developments, and portfolio diversification opportunities.
Growing institutional interest continues shaping the evolution of the cryptocurrency ecosystem.
Volatility Remains Part of the Market
Despite renewed optimism, Bitcoin continues to be one of the most volatile financial assets. Strong rallies are frequently accompanied by temporary corrections as traders adjust positions and markets respond to new information.
At Martons Group, specialists emphasize that volatility should be viewed as a natural characteristic of cryptocurrency markets rather than an exceptional event. Investors who understand market cycles are often better prepared to manage changing conditions.
Maintaining realistic expectations helps reduce emotional decision-making during periods of heightened market activity.
Technology Supporting Better Market Decisions
Modern financial markets generate enormous volumes of information every second. Artificial intelligence, cloud computing, automated analytics, and advanced data processing have become essential tools for understanding complex market behavior.
At Martons Group, technology supports continuous market monitoring by organizing large datasets into structured analytical insights. Traders can evaluate market conditions more efficiently through real-time information, technical indicators, and comprehensive research tools.
As digital finance continues developing, technology remains one of the primary drivers of more informed investment decisions.
Martons Group's Analytical Approach
At Martons Group, cryptocurrency market research combines technical analysis, macroeconomic evaluation, institutional activity, blockchain fundamentals, and continuous monitoring of global financial developments.
Rather than focusing exclusively on optimistic or pessimistic forecasts, specialists evaluate multiple market scenarios that help investors understand both opportunities and potential risks.
This balanced analytical framework enables traders to respond more effectively to changing market conditions while maintaining a disciplined investment approach.
Conclusion
Bitcoin's recent breakout has renewed optimism across cryptocurrency markets, raising expectations that bullish momentum may continue. Whether this movement develops into a sustained trend will depend on continued investor confidence, institutional participation, macroeconomic conditions, and overall market liquidity.
At Martons Group, successful cryptocurrency investing is built upon comprehensive analysis, disciplined risk management, and long-term strategic thinking. By combining advanced technology with continuous market research, investors can better understand evolving market conditions while remaining prepared for both opportunities and periods of increased volatility.
Ripple News: Court Clears $130M Ripple Share SaleLinqto has received U.S. Bankruptcy Court approval to sell approximately $130 million worth of private Ripple shares. The pre-IPO investment platform continues its Chapter 11 restructuring. This deal is part of a wider recovery process for thousands of customers who invested in private companies through the platform.
Major Institutions Buy Ripple Shares
The reported transaction includes Galaxy Digital buying $60 million in Ripple shares. Arrington Capital is buying $50 million. The Private Shares Fund is buying $16 million, and GAM Alternatives Lux is buying $4 million.
Ripple has reportedly waived its right of first refusal, allowing the transfers to proceed. The deal reflects continued institutional demand for exposure to Ripple’s private-market valuation. However, it does not mean Ripple is going public. The transaction has no direct impact on XRP holders or XRP ownership.
The proceeds will support customer recoveries as Linqto winds down its operations.
Linqto Bankruptcy Plan Was Backed by Customers
Linqto filed for Chapter 11 in July 2025 after new management uncovered potential securities-law violations dating back to 2020. This included issues involving the structure of special-purpose vehicles used for customer investments.
The platform had already shut down in March 2025. Its bankruptcy case involves investments linked to around 111 private companies, with the portfolio valued at more than $500 million.
On February 6, 2026, the court approved Linqto’s restructuring plan after roughly 95% of voting customers supported it. The plan offered customers recovery through a liquidating fund holding indirect private-company interests. Alternatively, it offered a publicly listed closed-end fund holding private shares, or a combination of both options.
Forge Dispute Threatens to Delay Customer Recoveries
The recovery process has now run into another legal challenge. According to Bloomberg Law, Linqto and its creditors have sued Forge Global Holdings. The private-market platform allegedly attempted to withdraw as trustee of the customer recovery trust just five days before Linqto planned to launch the trust on July 20.
Forge was expected to hold customer assets, manage transfers and help administer the recovery plan. According to the complaint, Forge cited demands from its new parent company, Charles Schwab, for its decision to back out.
Linqto and the Official Committee of Unsecured Creditors are asking the bankruptcy court to force Forge to honor its agreement. They want Forge to continue serving as trustee.
The dispute could delay asset transfers, increase legal costs and slow customer recoveries. For Linqto users with indirect exposure to Ripple, the case is about how and when their assets are administered. It is not about the validity of Ripple shares or the value of XRP itself.
BTCUSD - Upward Channel Holds Firm!Bitcoin has broken above the $65,500 resistance level and continues to move within an upward channel on the H4 timeframe. The ascending high-low structure remains intact, while the $64,600–$65,500 area is turning into a new support zone after the breakout.
Fundamentally, sentiment towards risk assets is improving as oil prices cool due to diplomatic expectations in the Middle East, and Asian technology stocks are recovering strongly. This context creates a more favorable environment for Bitcoin.
On the H4 timeframe, as long as the price holds the $64,600–$65,500 range, buyers maintain the advantage. A successful retest and a firm close above $66,000 could pave the way for BTC to continue its advance towards the target of $67,911.
Bias: Bullish
Target: $67,911
ADA Price Could Reach $0.56 if Support HoldsCardano price is trading near an important support area that could decide its next move. According to the analyst, ADA price could recover to around $0.56 if buyers defend current levels. If the support fails, the price could fall toward the $0.11-$0.17 range before recovering.
How Low Can Cardano Price Drop?
Cardano Price Prediction
The analyst said the area between $0.11 and $0.17 is the strongest support for Cardano based on historical price action. ADA has traded around this range several times since 2022, making it an area where buyers could return if the price drops further.
The analyst added that this is a personal technical view and not a guaranteed outcome.
Based on the analyst’s indicator set, Cardano’s estimated “fair value” is around $0.56.
If ADA has already formed a bottom, the analyst expects the next major target to be this level. However, if selling pressure increases, the price could first retest the $0.11-$0.17 support zone.
Also Read : Cardano Activates Van Rossem Hard Fork, What next for ADA?
What Next For ADA Price?
On the daily chart, the analyst said ADA has held support twice and is now trading near another important support level.
ADA price outlook
The next resistance is around $0.23. If buying momentum improves, ADA could move toward $0.32.
However, if the price fails to hold support and continues to weaken, the analyst expects another decline before any larger recovery begins.
Long-Term Price Targets
The analyst believes Cardano can recover over the long term if the market improves.
The key price levels mentioned in the analysis are:
Support zone: $0.11-$0.17
Estimated fair value: $0.56
Monthly resistance: $1.43
Long-term targets: $1.92 and $4.55
The analyst also highlighted higher technical targets above $7 but did not provide a timeline for reaching those levels.
Weak Buying Activity Remains a Concern
Despite the bullish long-term outlook, the analyst said Cardano is still missing strong buying activity.
According to the analysis, weekly indicators do not yet show a significant increase in market demand, making sustained upward movement less certain until buying interest improves.
Liquidity Has Been Taken. Now Watch These Key LevelsMU has recovered well from the 827 demand zone, where buyers absorbed heavy selling and pushed price back above short-term support. The recovery is encouraging, but the real test is still ahead.
What I'm Watching
> Demand Zone: 827-877 remains the strongest buying area.
> Supply Zone: 995-1,010 is where sellers are likely waiting.
> Trendline: Price is still below the descending trendline. A breakout would improve the bullish outlook.
> Volume: Buying volume has increased during the bounce, showing fresh interest from buyers.
> Order Flow: Buyers are becoming more aggressive, while sellers are gradually losing momentum.
Buyer vs Seller
> Buyers are defending higher lows and absorbing sell pressure.
> Sellers still control the higher-timeframe trend until 995 is reclaimed.
> A high-volume breakout above 995 would signal buyers are taking control.
Fundamental View
> AI memory demand and HBM growth continue to support Micron's long-term outlook.
> Data center spending remains a strong catalyst.
> Recent weakness looks more like profit-taking than a deterioration in fundamentals
Key Levels
Support: 877 , 827
Resistance: 995 , 1096
My Plan: I'm not chasing the rally. I'll be watching how price reacts around the 995 supply zone. If buyers absorb the supply with strong volume, i expect momentum to continue toward 1,096. Otherwise, another pullback into demand remains possible.
XRP Price Prediction Today: Can Bulls Break $1.20XRP price today is trading above $1.10 after gaining nearly 4%, while Bitcoin has climbed back above $65,000. The recent recovery has improved market sentiment, but XRP still needs to move above $1.20 to confirm a stronger uptrend.
The $1.20 level has acted as a strong resistance in recent weeks.
According to analyst, a sustained move above this level could push XRP toward the next resistance zone between $1.24 and $1.28. A break above $1.29 would strengthen the bullish trend.
On the downside, XRP needs to stay above $1.13 to maintain the current recovery. A drop below $1.10 could erase recent gains.
XRP Price Rises as Funding Rates Fall
One unusual signal during the latest rally is the sharp drop in XRP funding rates.
Funding rates fell 240% in one day, even as XRP moved above $1.13. At the same time, trading volume increased 64% over the past 24 hours.
This suggests the price increase is being supported by spot buying rather than excessive leveraged trading, making the move appear healthier than a leverage-driven rally.
Whale Buying Continues
Large XRP holders added around 70 million XRP during the recent price recovery. Despite this accumulation, XRP has remained below $1.20, showing that buying pressure has not yet been strong enough to trigger a larger breakout.
Network Activity Remains Weak
Active XRP addresses have dropped to around 20,000, the lowest level in nearly a year. Lower network activity suggests fewer users are currently interacting with the XRP Ledger, even as the price attempts to recover. At the same time, new capital entering XRP remains limited, which has slowed upward momentum.
Key XRP Price Levels
$1.10 – Major support
$1.13 – Short-term support
$1.20 – Key resistance
$1.24-$1.28 – Next resistance zone
$1.29 – Level that could open the way for a stronger rally
XRP has started to recover, supported by higher trading volume and continued accumulation by large holders. However, the price remains below its key resistance, network activity is near a one-year low, and fresh buying remains limited. Holding above $1.13 and breaking $1.20 will be the next important signals to watch.
SOL/USDT — Caught Between a Weekly Downtrend and a 4H Recovery inflection
SOL is at a genuine point right now, and I want to walk through why this is a "watch the levels" setup rather than a clean directional call.
Zoom out to the weekly and the trend is still technically down — price is deep below its longer-term structure and only recently stopped bleeding. But zoom into the daily and 4H, and you're looking at a textbook double bottom around $73–74 that's produced a clean series of higher lows into today's $78.4. That's the tension: bigger picture caution, smaller picture strength.
The next real test is $80–81 — that's where the 100-day EMA and the psychological round number sit together. A daily close above it opens the door toward $92–94 (the 200-day EMA). Losing $76.8 doesn't break anything yet, but losing $73–74 would put the recent recovery in question and put the $63–65 zone back in play.
My own indicator currently reads WAIT with low confidence (23%) — not a signal flip, just a market that hasn't cleanly resolved yet. Sometimes the most useful call is "not yet," and this is one of those spots.
Levels I'm watching:
Resistance: $80–81 → $82–83 → $92–94
Support: $76.8 → $73–75 → $63–65
XRP: Bullish Day, But the Trend Is Still DownInitial resistance approaches
XRP has joined today's recovery across the crypto market and is now pulling back into the $1.1866 resistance level. This marks the first meaningful hurdle bulls need to overcome if the recovery is to continue.
Primary trend remains bearish
Despite the recent bounce, the 100/50-day EMAs remain bearishly crossed, while the higher timeframes continue to show a well-established downtrend. The broader outlook won't begin to improve until key resistance levels are reclaimed.
Momentum improving
RSI has climbed back above the 50 level, suggesting bullish momentum is beginning to build. Meanwhile, StochRSI has turned higher but remains below overbought territory, leaving room for further upside if buyers stay in control.
Volume lacks conviction
Trading volume has remained relatively subdued throughout the recent consolidation. A convincing move above resistance would ideally be accompanied by a noticeable increase in buying volume.
Bulls still have work to do
A break and close above $1.1866 would strengthen the short-term bullish case, but the more significant resistance zone around $1.30 remains the bigger obstacle. Until those levels are reclaimed, rallies should still be viewed within the context of a broader downtrend.
In Summary
XRP has produced an encouraging recovery, with momentum improving as RSI moves back above 50 and price challenges the first resistance around $1.1866. However, the 100/50-day EMAs remain bearishly crossed, while the higher timeframes continue to point lower. A move above $1.1866 would be a positive first step, but reclaiming the $1.30 resistance zone is likely needed before the broader trend begins to shift back in the bulls' favour.
$SOL Sitting on a Low-Volume Pocket. Watching for the SweepWatching CRYPTOCAP:SOL and I'd like to see this scenario play out. There's a local liquidity zone with no volume in it. Price clearly won't linger there, so we've got two options here.
Price flies through that low volume zone off this liquidity and holds above (no trade).
Liquidity grab and a return to the zone near 0.5.
The second scenario is the one that gives me a chance to enter a position. Watching closely, I'll be looking for a break on the lower timeframe in case of a sweep and absorption, and opening the trade if the conditions are there.
NFA!
Here's the read on SOL/USDT Structure & bias.
Price at $78.57 is pressing directly into PDH ($78.5) with a BULLISH terminal bias and VWAP Dev at +0.63% trading modestly rich to the anchored VWAP (purple), which is now curling up beneath price around $77.3. That reclaim of AVWAP after the mid-July dip is the key bullish tell: the institutional cost basis is rising and price is holding above it.
The range. You're boxed between $82 (early-July swing high / range top) and $62.5 (range low). Within that, the action since the June low at $60 has been a recovery leg → $82-83 spike → controlled pullback → higher-low base off the $74-75 shelf. Constructive, not vertical.
Key levels.
$78.5 (PDH) immediate decision point. This is where you are. Acceptance and a 4H close above opens $80 round number and then the $82 range high.
$77.3 (AVWAP) first support / trend line in the sand. Losing it flips the near-term tone.
$74-75 (yellow HVN + red POC at $74) the heaviest volume node on the profile. This is the real value area and the line that matters; below it the bullish structure breaks and $68 comes back into play.
$82 / $62.5 outer range boundaries.
What I'd watch:
The volume profile shows a thin patch between roughly $79 and $82 low resistance overhead, so a clean break of PDH can travel quickly to the range high. The risk is a failed test here: a rejection wick off $78.5 that loses the rising AVWAP would set up a rotation back to the $74-75 value shelf. VWAP Dev only +0.63% means it's not stretched there's room to run without being overextended.
Net: bullish while above the rising AVWAP ($77.3), with $78.5 the trigger and $74 the invalidation for the structure.
Dogecoin: The Battle Between Wave Y and a New ImpulseDogecoin Daily Chart | Elliott Wave Analysis
At this stage, both the aggressive and conservative scenarios remain valid. The key difference lies in how the current corrective structure is interpreted, and only future price action will determine which scenario is actually unfolding.
Aggressive Scenario
In the aggressive scenario, the current structure may still be part of a classic Zigzag. If this interpretation is correct, I expect the market to first develop a three-wave corrective pattern, at least resembling the behavior of Wave (B) within the current Zigzag.
Once that correction is complete, another Zigzag could develop, allowing the entire corrective structure to finish with the typical seven-swing sequence.
Another possibility is that the current movement represents only a portion of a higher-degree Wave X. If so, the correction could become considerably more complex, developing multiple nested Zigzag formations before eventually completing a larger Wave Y, and ultimately Wave (IV).
For now, both interpretations remain valid until future price action provides structural confirmation.
Conservative Scenario
In the conservative scenario, the correction of Wave X, interpreted as an Extended Leading Diagonal, is viewed as having been completed through a classic Zigzag, potentially completing the entire corrective cycle.
If this interpretation proves to be correct, a breakout above the previous Wave B high of the recent Zigzag would provide the first meaningful confirmation that the next bullish phase is underway.
However, at the current stage, a three-wave corrective structure remains the more probable outcome until the market confirms otherwise—particularly if the Extended Leading Diagonal has already reached completion.
As always, the market will determine the correct path. Until then, structure, invalidation levels, and future price action remain our most reliable guide.
Patterns whisper. I listen.
— Mr. Nobody | Elliott Wave Principle
Dogecoin
2 hours ago
Dogecoin Daily Chart | Elliott Wave Analysis
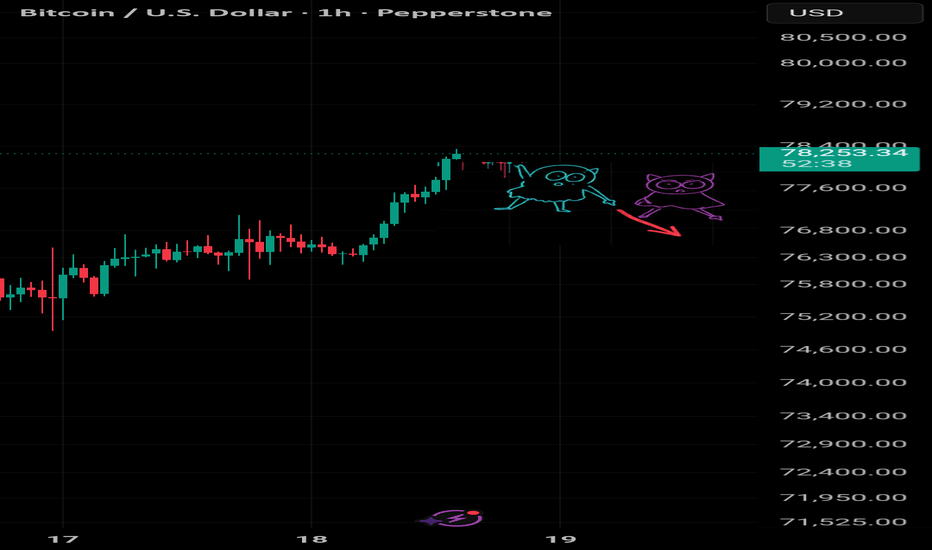
BITCOIN Is Bearish! Sell!
Take a look at our analysis for BITCOIN.
Time Frame: 1h
Current Trend: Bearish
Sentiment: Overbought (based on 7-period RSI)
Forecast: Bearish
The market is approaching a significant resistance area 66,700.97.
Due to the fact that we see a positive bearish reaction from the underlined area, I strongly believe that sellers will manage to push the price all the way down to 65,404.90 level.
P.S
Overbought describes a period of time where there has been a significant and consistent upward move in price over a period of time without much pullback.
Like and subscribe and comment my ideas if you enjoy them!