Long
Long

SOLUSDT 8H Update — Retest Held, Trendline Broken TooFollow-up to the rangebreaker CHoCH flagged last update. The sequence played out in order, which is worth noting plainly rather than just moving on to the next chart.
C swept below the range at 96, reclaimed back above 97.38, and the smaller timeframe came back to retest that exact level, the small candles sitting right on 97.38 before the push. That retest holding was the actual entry point, not the reclaim candle itself, exactly the sequence the methodology calls for. From there price didn't just bounce, it broke straight through the descending trendline from the 110 high and printed a fresh local high at 114.32.
Gate one, structure, is now confirmed rather than pending. The trendline that gated the last update's read is broken, and this is happening with the larger trend from the August low near 80, not against it.
Gate two, the zone, was the 96-98 region. It did its job twice, once as the sweep and once as the retest, and both times it held.
Gate three, the trigger, is confirmed. The break above the trendline with a new high on top of an already-confirmed CHoCH and successful retest is about as complete as this kind of setup gets. What matters now is whether 97.38 continues to hold as support on any pullback, that's the new line in the sand. Losing it back below would undo the structural read this entire sequence has been building.
If anyone faded the rangebreaker, this is the chart that explains why that's a hard way to trade. The sweep does the work of clearing out the people who would have sold the reclaim. The retest is just confirmation for everyone else.  Long
Long
Long 
 Long
Long
BTCUSDT 8H Update — Rangebreaker Plays Out, CVD Still OpenFollow-up to the rangebreaker CHoCH flagged last update, where the structural trigger was there but order flow hadn't confirmed it yet.
Price did exactly what the reclaim above 75,550 called for. The retest of that level held, the descending trendline from the Sep 4 high near 82,200 has now been broken outright, and price pushed straight through to 81,389 before settling near 81,193. Same sequence as the SOL setup from the same methodology, sweep, reclaim, retest, break.
Gate one, structure, is confirmed. The trendline is broken and the range low that was swept and reclaimed has held on the retest, textbook execution of the weighted entry sequence, larger timeframe shows the tell, smaller timeframe retest is where the size goes.
Gate two, the zone, was 75,250-75,550, and it did its job across the sweep, reclaim, and retest.
Gate three is where this update has to stay honest rather than just declare a win. The open question last time wasn't the price structure, it was spot CVD having fully round-tripped back to the 65,000 level despite price sitting thousands of points higher, an effort versus result mismatch that hadn't resolved. This chart doesn't carry that indicator, so that gate is still unconfirmed here, not resolved. Price breaking out on structure alone is real, but it isn't the same claim as order flow catching up to back it. That check still needs to happen before this gets called clean across the board.
Structure did its part. Whether the tape actually backs this move the way it should still needs to be looked at directly, not assumed because price went up. Long 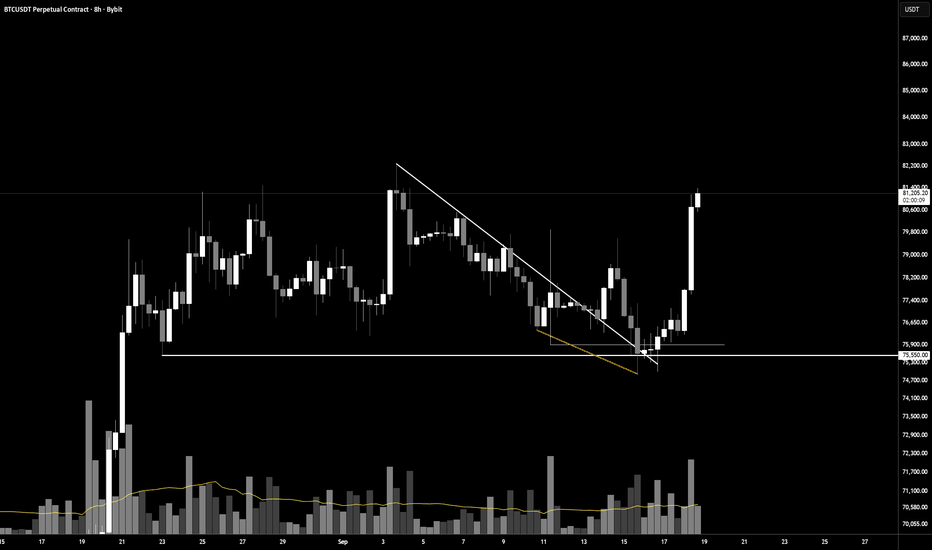
 Short
Short
 Long
Long
 Long
Long
700 BTC Moves from Binance to Kraken, Spotted by Whale AlertA substantial transfer of 700 BTC, valued at approximately $56.6 million, was reported to have moved from Binance to Kraken. This notable movement was highlighted in a tweet by @whale_alert, prompting discussions among traders regarding its implications. Such large transfers can indicate shifts in market sentiment and may influence future price movements.
The Key Development
The broader cryptocurrency market is currently displaying mixed signals, with varying momentum observed across major assets. The transfer of 700 BTC from Binance to Kraken stands out in this environment, particularly as it represents significant whale activity. Traders are closely monitoring such movements, as they can precede larger market trends and shifts in liquidity. The fact that this transfer occurred amid a backdrop of fluctuating market conditions heightens its importance, suggesting that traders should remain vigilant.
The Numbers
Currently, the price of BTC is relatively stable, although the transfer reflects ongoing interest from large holders in navigating the exchange landscape. With no significant price changes recorded, the focus shifts to how this transfer might influence market dynamics in the coming days. The absence of a confirmed catalyst means traders are speculating on the implications of this activity amidst the current market context.
Binance is one of the largest cryptocurrency exchanges globally, known for its extensive trading volume and broad range of services. Kraken, another major player, offers trading services for various cryptocurrencies and is popular for its security features. Regulatory scrutiny on exchanges and the overall market landscape gives these transfers heightened importance, as investors seek to understand potential impacts on liquidity and price volatility.
What Traders Are Watching Next
Traders are watching for potential follow-through from this significant movement, especially considering the mixed signals in the broader market. Key levels to monitor include recent support and resistance points, which could be influenced by further whale activities. The risks associated with sudden shifts in liquidity and sentiment remain high, making it essential for traders to stay updated on any emerging trends. Long 
LIQUIDITY SWEPT! BITCOIN PREPARES FOR A MASSIVE REVERSALCurrent Price: ~78,358
Timeframe: 1 Hour
Overall Bias: 🟢 Bullish above 77,800–78,200
🔥 Market Structure
BTCUSD experienced a significant selloff from the 81,000–82,000 region, followed by consolidation and a gradual decline. However, the chart shows a strong reaction from the lower 76,400–76,800 area, where liquidity appears to have been swept before buyers stepped back in.
The subsequent recovery produced a strong bullish displacement and a break of structure (BOS), suggesting that short-term momentum has shifted back toward the buyers.
🟢 Key Support / Buy Zone
The most important area on the chart is 77,800–78,200.
This zone can act as a potential demand/support area. If BTC holds above this region and produces bullish confirmation on a pullback, the bullish structure remains intact.
The Supertrend support around 76,800 provides an additional structural level. A decisive break below this area would significantly weaken the bullish thesis.
🎯 Upside Targets
If buyers maintain control, the chart projects:
TP1: 80,200
TP2: 81,200
TP3: 82,400
The 81,800–82,400 zone is particularly important because it coincides with the previous major high and potential supply/resistance.
🧠 SMC Perspective
The setup can be interpreted as:
Liquidity Sweep → Bullish Displacement → BOS → Pullback/Retest → Potential Continuation
The key confirmation would be price respecting the 77,800–78,200 demand area and subsequently breaking nearby swing highs.
🔴 Bearish Invalidation
The bullish scenario becomes questionable if BTC loses 77,800 with sustained selling pressure. A decisive break below 76,800, particularly on a strong 1H close, would invalidate the current bullish structure and could open the door toward lower support levels.
📌 Final Outlook
BTCUSD remains technically bullish while 77,800–78,200 holds. The preferred scenario is a controlled pullback into support followed by bullish confirmation, with 80,200 → 81,200 → 82,400 representing the potential upside path. Long 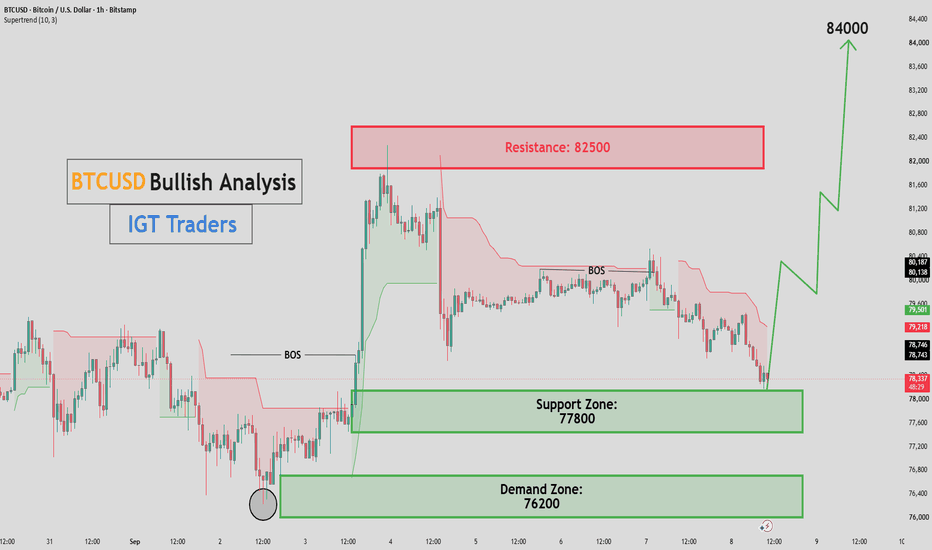
BTCUSD BULLISH ANALYSIS — BUYERS ARE LOADING FOR THE NEXT LEGBTCUSD is maintaining a bullish 1H structure after a powerful impulsive move from the lower levels. Price is currently trading around 79,150, consolidating above the 77,000 support zone while repeatedly testing the upper range.
📈 Market Structure
The chart shows a strong sequence of bullish BOS (Break of Structure) during the major advance. After reaching above 80,000, BTC entered a consolidation phase rather than producing a clear bearish structural reversal.
The Supertrend remains bullish, with the trend support currently around 77,695, adding confluence to the bullish scenario.
🟢 Key Support Zone — 77,000
77,000 is the immediate key support area.
Price has repeatedly reacted around this region. As long as BTC continues to hold above this zone, the bullish structure remains intact.
A successful retest followed by bullish momentum could provide the next opportunity for continuation toward the resistance.
🟢 Strong Demand Zone — 75,000
75,000 is the major demand zone.
If BTC experiences a deeper correction and loses 77,000 temporarily, this is the next important area where buyers could potentially step in.
A sustained break below 75,000 would significantly weaken the current bullish setup.
🔴 Major Resistance — 80,500
80,500 is the key resistance zone.
BTC has repeatedly struggled around the 80K–80.5K region, making this the critical breakout level.
A strong 1H close above 80,500, followed by a successful retest, would provide much stronger confirmation of the bullish continuation.
🎯 Bullish Target — 85,000
If BTC breaks and holds above 80,500, the next major objective shown on the chart is:
🎯 85,000
The projected path is:
79,000 → 80,500 breakout → 82,000+ → 85,000
🔥 Overall Bias
🟢 BULLISH ABOVE 77,000
The preferred scenario is a continuation higher as long as the 77,000 support zone remains protected. The major trigger is a confirmed breakout above 80,500.
Bullish invalidation: sustained weakness below 75,000. Long 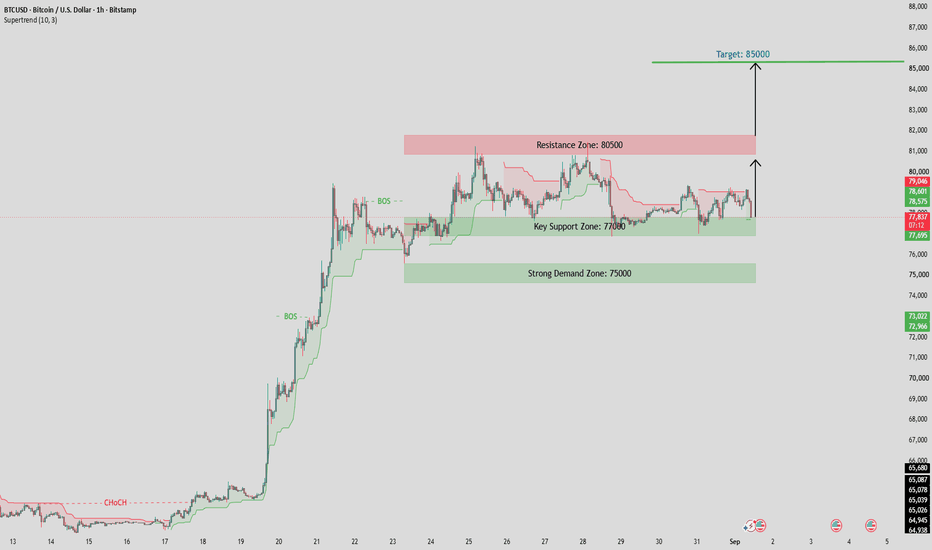
Long 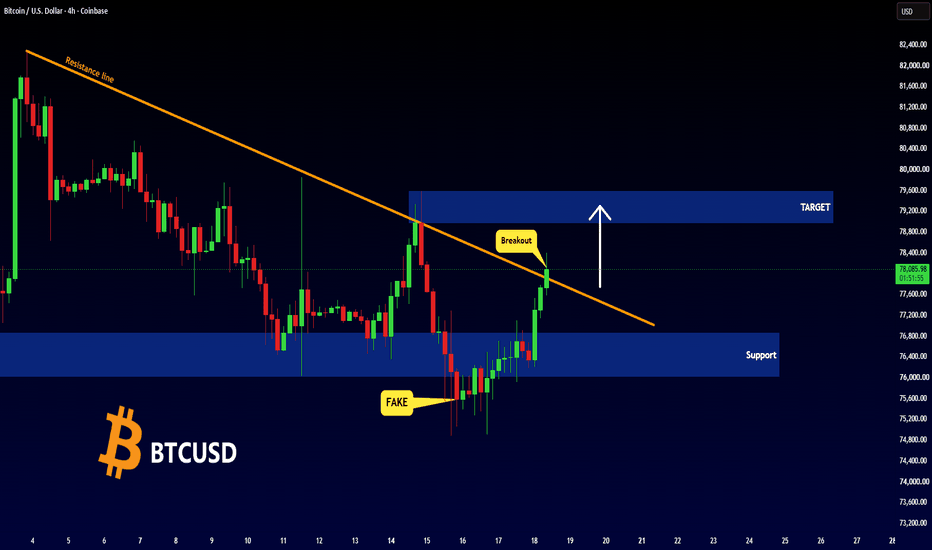
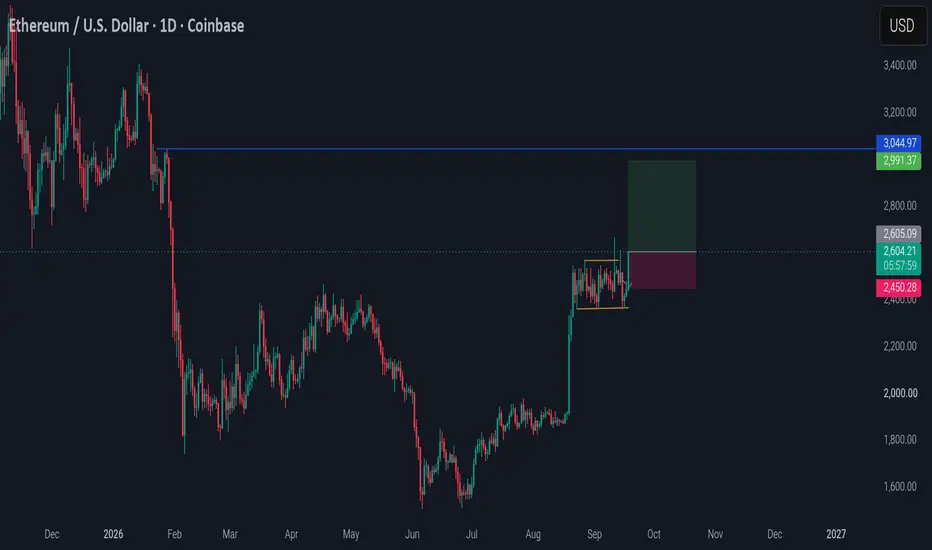
ETH JUST BROKE FREE — $3K NEXT?Hey Traders!
If you’re finding value in this analysis, smash that 👍 and hit Follow for high-accuracy trade setups that actually deliver!
Ethereum has been consolidating inside a well-defined range for nearly a month, with price repeatedly respecting the range boundaries.
Now, ETH has finally pushed above the range resistance around $2,550–$2,580, signaling a potential bullish breakout.
🔥 WHY THIS SETUP IS INTERESTING
The breakout comes after a prolonged period of sideways accumulation, where buyers repeatedly defended the lower range around $2,350–$2,400.
A sustained breakout above the $2,550–$2,580 resistance zone could open the door for a larger continuation move.
The measured move of the previous structure also points toward significantly higher levels.
TRADE PLAN
🟢 Entry Zone: $2,540 – $2,580
🎯 TP1: $2,700
🎯 TP2: $2,850
🎯 TP3: $3,000
🎯 TP4: $3,200
🎯 TP5: $3,400+
🛑 Stop Loss: $2,409
⚡ KEY INVALIDATION
The breakout needs to hold.
If ETH gets rejected and moves back below the breakout/range resistance, especially with a strong 12H close back inside the previous range, the bullish setup would weaken and the breakout could turn into a false breakout.
For now, the focus is on breakout continuation + successful retest.
ETH spent weeks building the range.
Now the question is whether it can deliver the expansion.
Not financial advice. Manage risk and avoid chasing the breakout.
Long 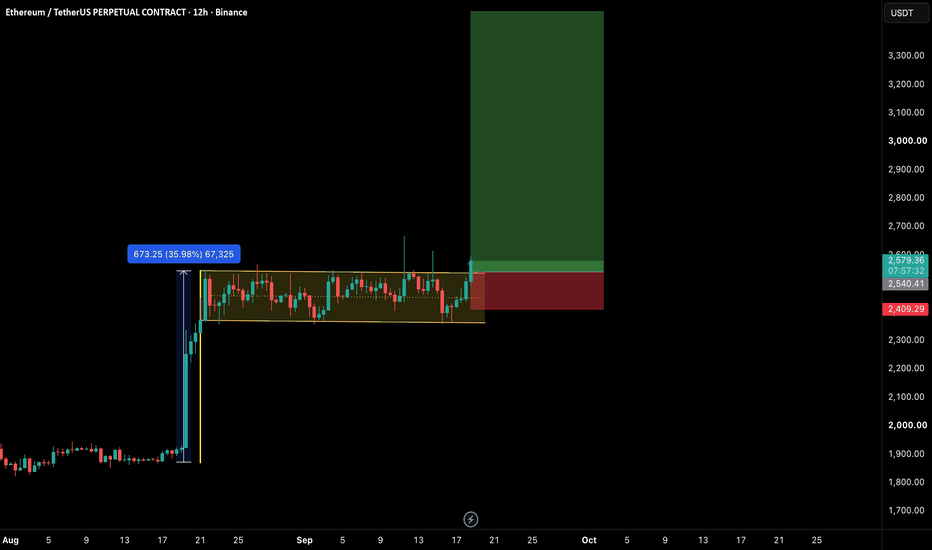
Long 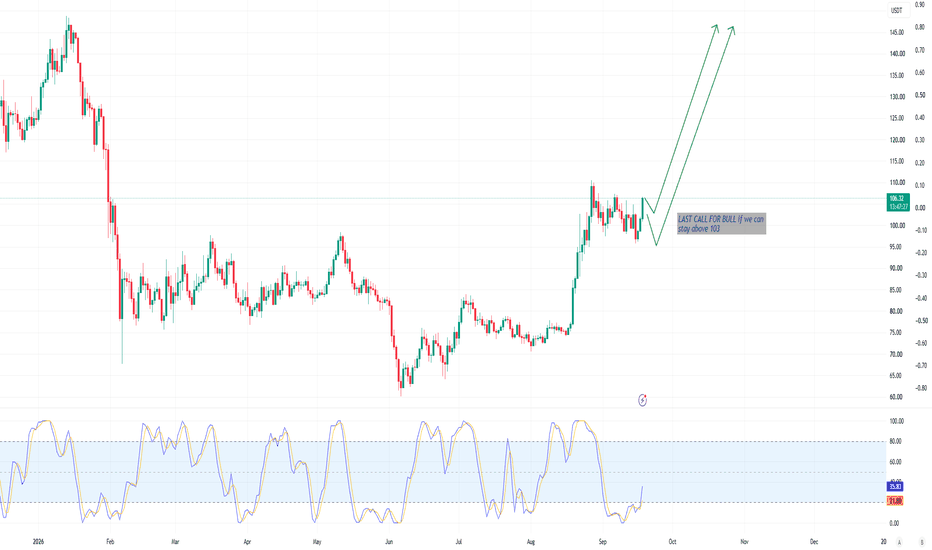
Long 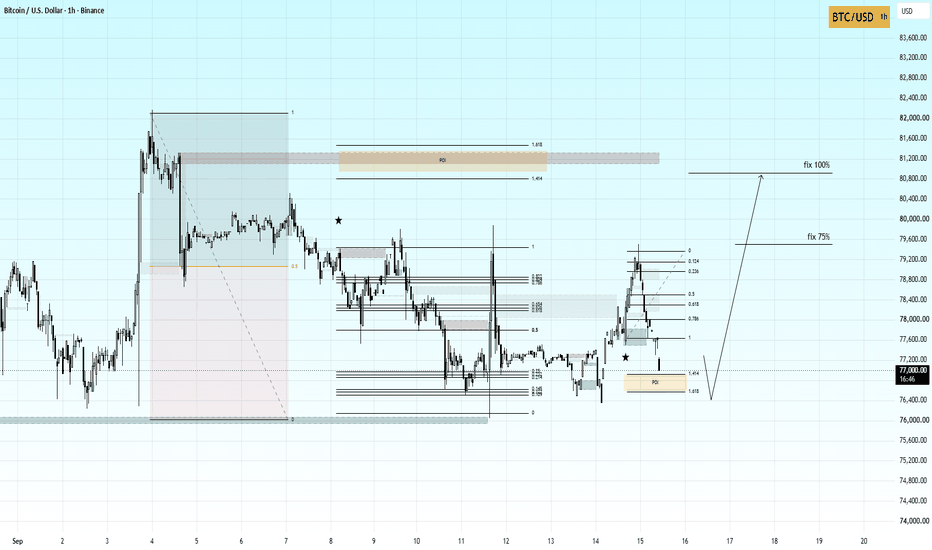
Long 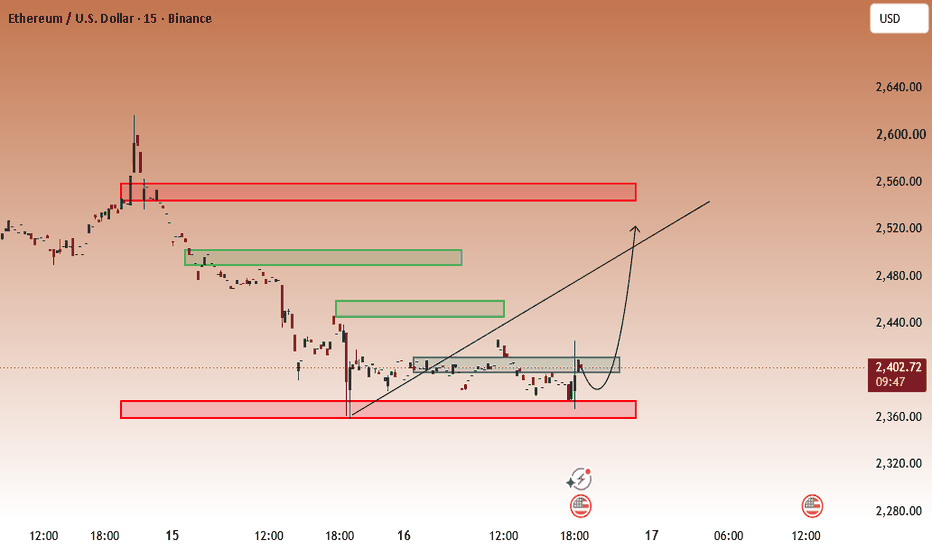
B T C : ($77 214 Buy Stop)BTCUSD — BUY SETUP
Bitcoin is showing a potential bullish opportunity as price holds around the $76,950–$77,000 area after reacting from lower support.
The market has been moving within a broader range, and the recent price action suggests buyers are beginning to step back in. The key now is whether BTC can maintain this area and continue pushing toward the resistance levels above.
Trade Setup
BUY: $76,950–$77,000
STOP LOSS: $75,700
TAKE PROFIT 1: $78,000
TAKE PROFIT 2: $78,600–$78,700
The Idea Behind The Trade
The focus here is on the reaction from support.
Price has already shown that buyers are willing to defend the lower levels. Holding above the entry zone would give the bullish structure more strength and open the way toward $78K.
If $78K is broken with strong momentum, the next area of interest becomes $78.6K–$78.7K, where price could encounter stronger selling pressure.
The setup becomes invalid if BTC loses $75,700 decisively. A break below that level would indicate that the current bullish structure has failed and that price may be preparing for another move lower.
Trade Management
The first objective is $78,000. Once price reaches this area, traders can consider securing partial profits and protecting the position.
If momentum remains strong above $78K, the remaining position can be held toward $78,600–$78,700.
The structure is simple: defend support, reclaim resistance, and follow the move.
BTCUSD — BUY
Entry: $76,950–$77,000
SL: $75,700
TP: $78,000 / $78,600–$78,700
Risk management remains essential. No setup is guaranteed.
Long 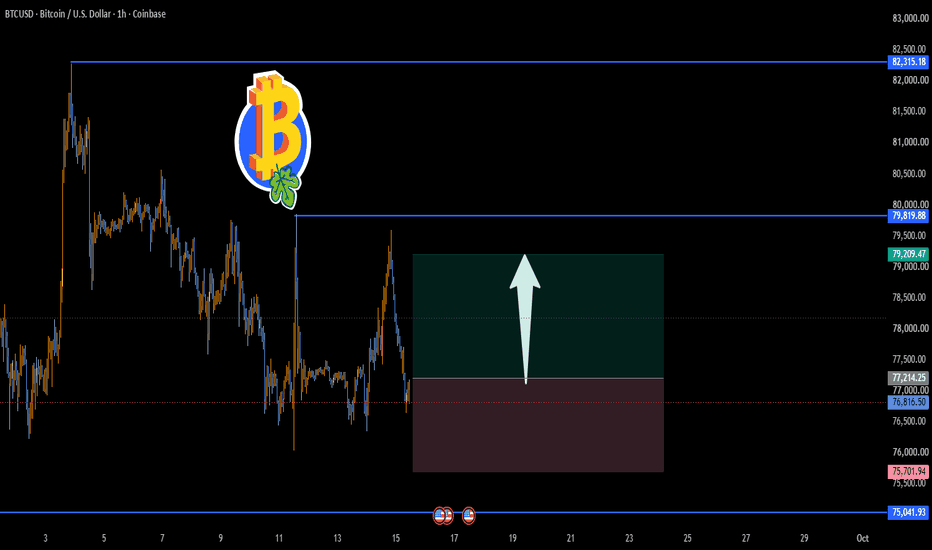
 Long
Long
 Long
Long