BTCUSD Buy Setup – Recovery Toward Resistance BTCUSD is showing a bullish recovery from the **75,100–75,300 support zone**. Price has formed a higher-low structure and is gradually moving upward. The setup targets the marked resistance levels, with **77,945** as the first target and **80,000–80,300** as the extended target if bullish momentum continues.
**🎯 Target 1: 77,945**
**🎯 Target 2: 80,000–80,300**
**📌 Support: 75,100–75,300**
**📈 Bias: Buy**
 Long
Long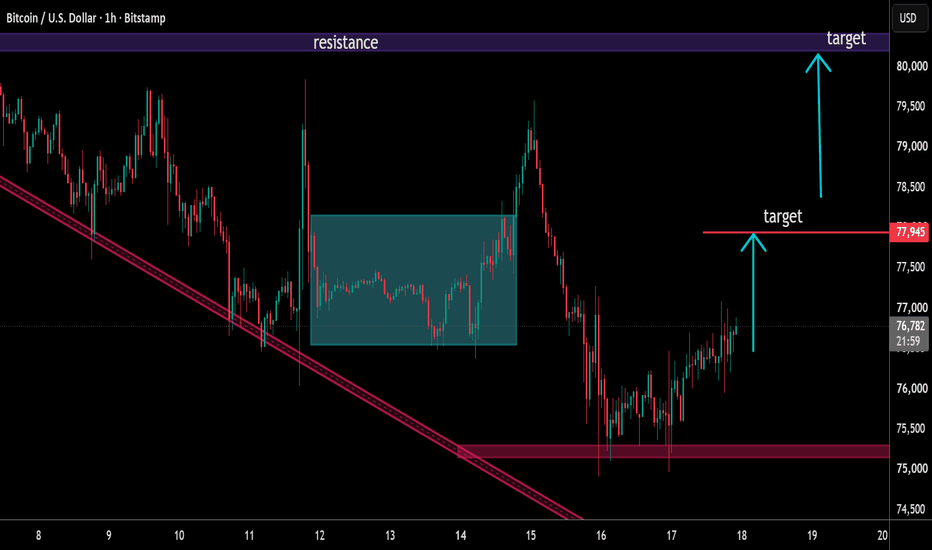
Bitcoin Holds $75K After the Fed — Is $80K Next?Bitcoin ( BINANCE:BTCUSDT ) experienced sharp volatility after the Federal Funds Rate was released at 4.00%, in line with expectations, followed by remarks from Kevin Warsh.
Unlike gold and U.S. stock indices—particularly the S&P 500—Bitcoin has so far managed to hold inside its Support Zone and avoid a similarly sharp decline.
Can BTC defend $75,000 and turn this relative strength into another move toward $80,000?
Macro Outlook
Nearly $1 billion in long positions could be liquidated around $74,860, making this an important downside liquidity area to monitor.
Bitcoin could also remain sensitive to developments in the Middle East, movements in the S&P 500, and gold price action.
Technical Analysis
Bitcoin is currently trading inside the Support Zone and near Cumulative Long Liquidation Leverage($74,680-$73,800).
A valid Golden Cross has also formed between the 50_SMA(Daily) and 200_SMA(Daily), which could support the broader bullish structure.
💡 Educational Note: A Golden Cross forms when a shorter-term moving average crosses above a longer-term moving average and is generally considered a bullish trend signal, although price confirmation remains important.
From an Elliott Wave perspective, Bitcoin’s structure over the past 12 days appears more corrective than impulsively bearish, suggesting that another bullish move could develop.
I expect Bitcoin to move higher over the coming hours.
If BTC breaks above the key trading level of $77,280, further upside could develop toward $78,370 and eventually the Cumulative Short Liquidation Leverage.
As long as Bitcoin remains above $73,500, the bullish scenario remains valid.
Trade Setup
First Take Profit(TP): $76,990
Second Take Profit(TP): $78,370
Third Take Profit(TP): Cumulative Short Liquidation Leverage($80,700-$79,800)
Stop Loss(SL): $73,500(Worst)
Key Trading Level: $77,280
New CME Gap: $79,270-$79,110
Do you think Bitcoin can hold above $75,000?
🟢 Yes
🔴 No
📌 Bitcoin Analysis(BTCUSDT), 1-hour time frame.
🛑 Always use proper risk management and set a Stop Loss(SL) for every position.
🚀 If this analysis helps your trading plan, a BOOST would help more traders discover it. Long 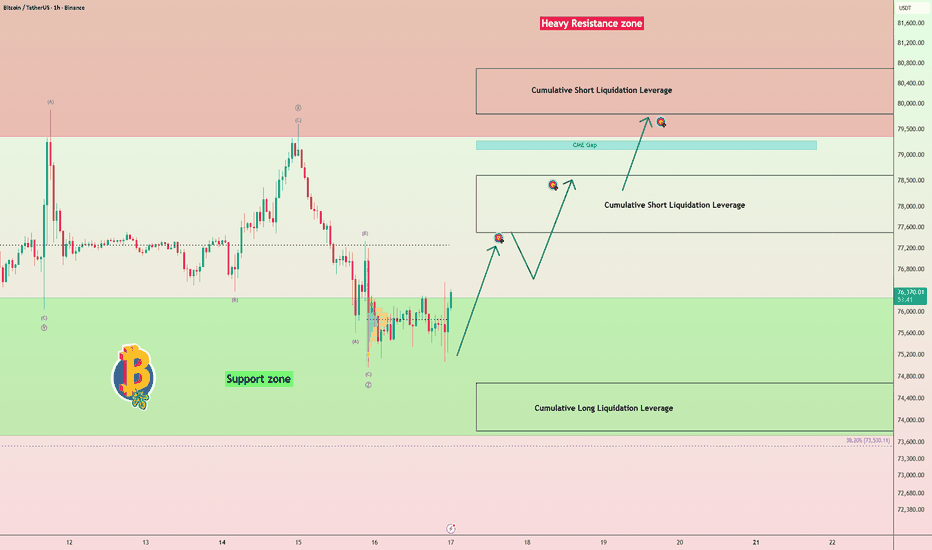
Long 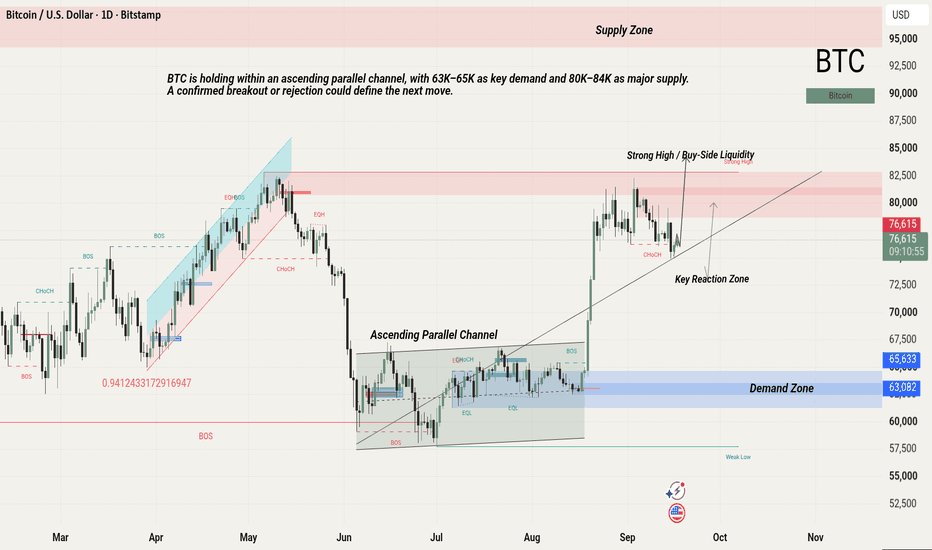
 Long
Long
TradeCityPro | Bitcoin Daily Analysis #369👋 Welcome to TradeCity Pro!
Let’s take a look at Bitcoin. The bullish move in the market has started!
⌛️ 1H Timeframe
Yesterday, Bitcoin managed to establish a close above 76,793 and started a bullish move.
🔔 This move is still ongoing, and price has even broken above 79,274.
📊 Buying volume has increased significantly, while RSI has also established above 70 and entered the overbought zone.
✨ If you already have a long position, I suggest keeping it open as long as RSI remains in the overbought zone, and taking profit once RSI exits the overbought zone.
💡 There is an important resistance zone between 81,289 and 82,561, and there is a high probability of price being rejected from this zone. However, if price maintains its momentum and manages to break through this zone, a very sharp move could begin.
✔️ For a new position, we currently don’t have a trigger. I’ll personally wait for a proper structure to form before opening a position.
❌ Disclaimer ❌
Trading futures is highly risky and dangerous. If you're not an expert, these triggers may not be suitable for you. You should first learn risk and capital management. You can also use the educational content from this channel.
Finally, these triggers reflect my personal opinions on price action, and the market may move completely against this analysis. So, do your own research before opening any position.  Short
Short
Bitcoin: Weekly Support HoldsGood afternoon my dear reader, it is such a pleasure to get a chance to write for you today, great news is all I have to share.
Bitcoin! Wow, Bitcoin!
Isn't this the best possible ever?
Technical analysis
Five weeks total. This is the most important data point available on the chart. We can make a whole analysis based on this number, the last five candles.
On the first candle, BTCUSDT weekly opens below MA200. The same week, we end up with the biggest candle in years. MA200 has been confirmed as long-term support.
The bullish jump went beyond the April 2025 low around $74,500, a major level that produced a rejection in April-May this year.
So Bitcoin managed to break this resistance while confirming the bear market bottom being a price range around the MA200 indicator. Now we have four weeks of sideways action above support. This support level is being confirmed this week.
This week, Bitcoin starts red. The bottom comes up at $74,973, right above the $74,500 from April 2025. Now BTCUSDT is full green and about to hit the highest price of 2026. With this milestone being reached, a new bullish cycle is confirmed.
What to expect
The action this week, Bitcoin retracing just to recover back above $80,000, is a major development. It means so much for Bitcoin and the Altcoins market, Cryptocurrency.
The bear market will now be over even for the bears. This is great, we can now all get on the bullish train.
Next comes the altcoins market and this is where all the entertainment, excitement and fun will happen. This is where thousands of millionaires will be made. The altcoins market is about to produce one of the strongest bullish cycle in its history, supported by Bitcoin rising long-term.
An early end to the bear market means hyper-bullish.
Thank you for reading.
Namaste. Long 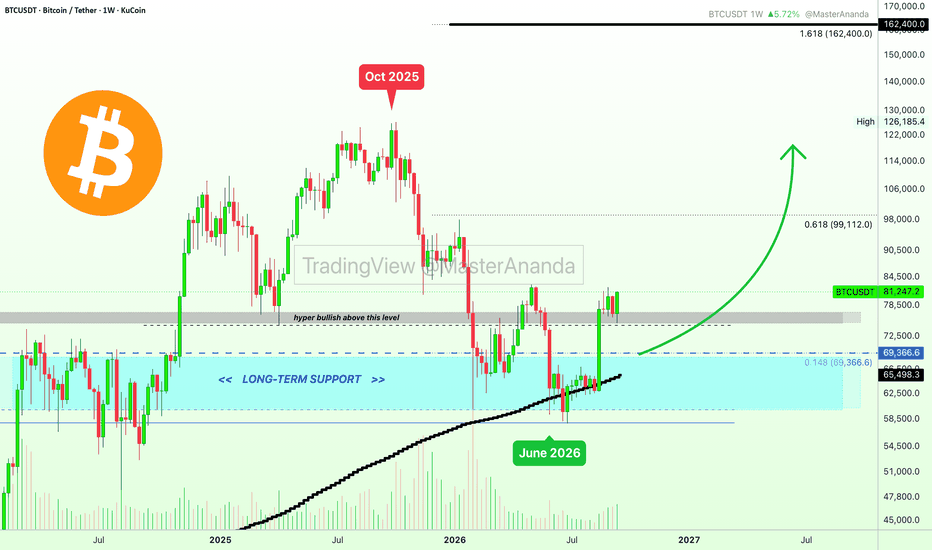
Short 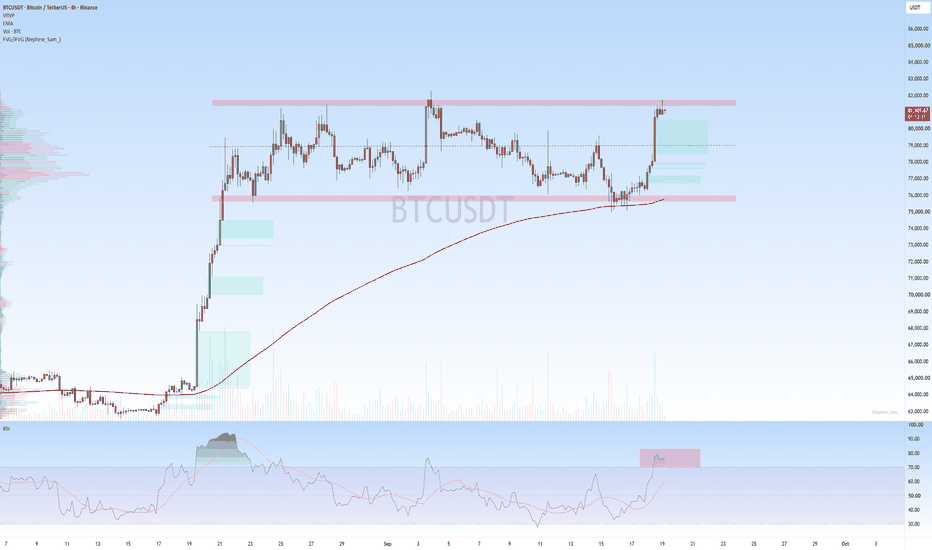
Bitcoin: $99,000 or $100,000?Resistance is being challenged right now; a very, very strong resistance range has been activated, this is where Bitcoin found support last year to end wave A (of the ABC correction) of the bearish cycle—around $80,600. The low happened at $80,600 on a wick while the session closed at $84,700 (November 2025).
Last year a three months long relief rally happened above $80,000 and then we have the peak from May 2026. Bitcoin has been challenging again the same resistance zone since 21-August, almost a month ago.
The more often a resistance level gets challenged, the weaker it becomes.
We do have a lower low on the lower end of the chart, support. That is, $60,000 FEB2026 vs $57,800 JULY2026. But this is technically a double-bottom.
Now Bitcoin is challenging resistance and so far we have a lower high. Volume is rising and higher now on this rise compared to the last drop.
We know for sure the market is headed higher because it is already happening. It was written all over the place and the confirmation is in based on price action.
Only one question remains:
Will Bitcoin peak the first wave at $99,000 or $100,000?
Leave a comment with your answer and then I will give you mine.
Thank you for reading.
Namaste. Long 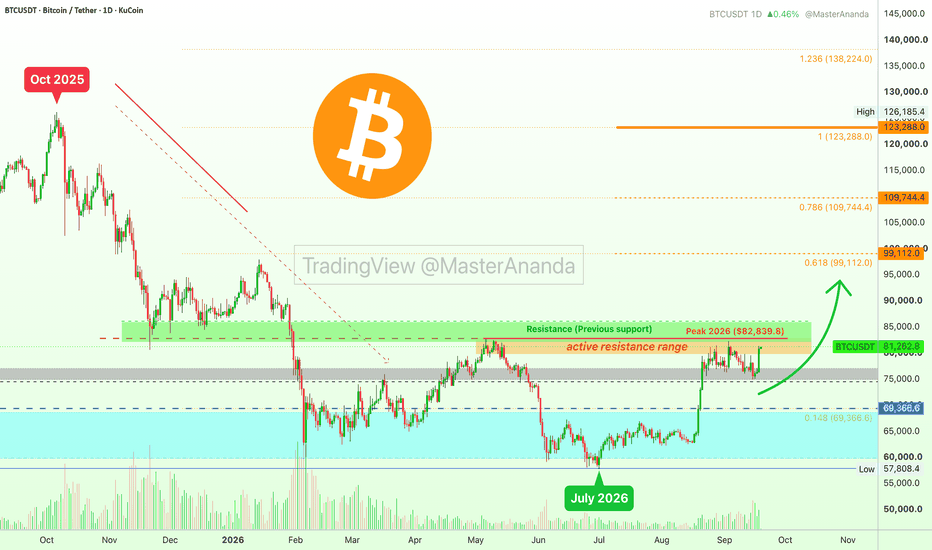
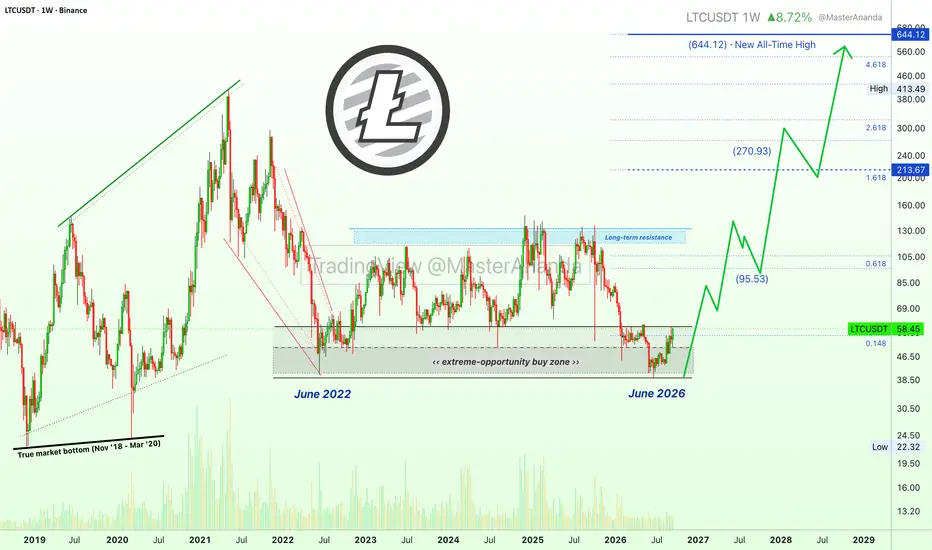
(LTC) Final call to get Litecoin below $60 (Crypto is going up!)This seems to be the last time we will see Litecoin (LTCUSDT) trading below $60 in 2026. This seems to be the last chance to buy Litecoin within the opportunity buy-zone, within long-term support, at bottom prices.
The bottom process in 2026, is a perfect replica of 2022. After the 2022 bottom the market grew for years. After the June 2026 bottom, LTCUSDT will grow for years to come.
Litecoin technical analysis
The chart is showing, on the right side—starting Dec 2024, a very strong decline that found support at the same level as in the previous bear market.
Current price action indicates the bottom is in and Litecoin is set to grow. This is both based on the stop-loss hunt event and the cyclical nature of the market. After a bearish cycle we get a bullish cycle. We just went through a very strong bear market, bullish goes next. Litecoin has been rising for almost three months.
The weekly RSI reads 56, which is really good. The MACD hit bottom June 2022, February 2026 produced a very strong higher low—bullish divergence vs LTCUSDT. The weekly MACD is still moving below zero, which means that plenty of room is available for a full blown long-term bull market.
There is one final barrier to break for full confirmation on the chart. When Litecoin moves and closes weekly above $61, you got it and this can happen within days.
You know, I know, we all already know. The market can be shy today, some growth here some growth there but growth nonetheless.
The market will not give time to react; the market gave dozens of chances to secure a great entry price.
The market will not make a pause and isn't likely to produce any significant price retrace once it starts to go.
This is the final call... Crypto is going up.
Namaste.  Long
Long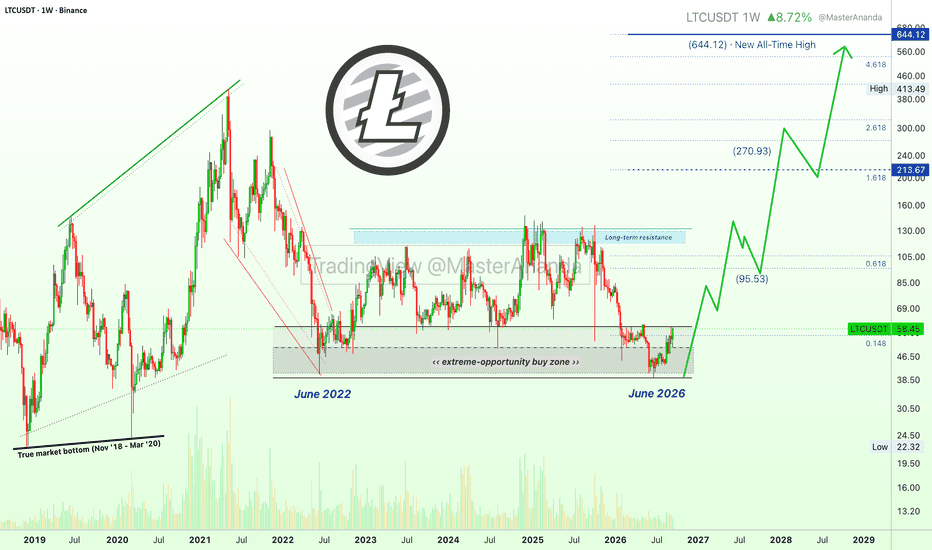
Long 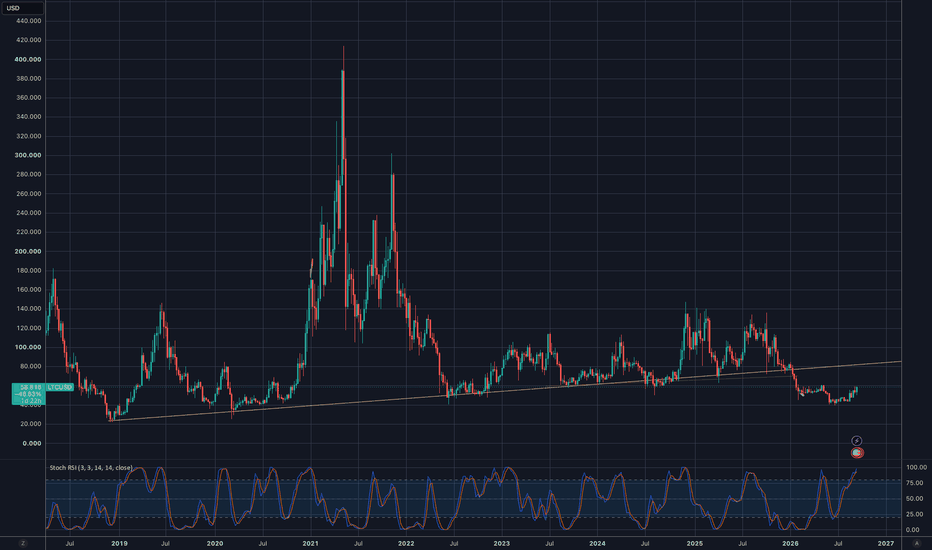
 Long
Long
Short 
BTC Just Swept Liquidity — What Comes Next?• Trend: Bullish on the 1H chart
• Structure: Clear HH/HL progression after the 75.5K–76K low
• BOS: Bullish break above the previous 79K area
• CHoCH: Earlier momentum shift from bearish to bullish structure
• Momentum: Strong impulsive buying, supported by increased volume
• Price Action: BTC has aggressively pushed into the 81K resistance/liquidity zone
🔑 KEY LEVELS:
• Resistance / Liquidity: 81,000–81,100
• Major upside level: 82,000
• Near-term breakout/retest area: 80,000–80,400
• Demand / Order Block: 76,000–77,000
• Major previous low: ~75,500
• Liquidity: Recent highs around 81K have just been swept
🎯 TRADE SETUP — LONG ON CONFIRMATION:
Entry: 80,200–80,400 after a confirmed retest/hold
Stop Loss: 79,700
TP1: 81,000–81,100
TP2: 82,000
TP3: 82,000+ only after a confirmed breakout
Risk/Reward: Approximately 1:2+ depending on entry and execution
🚀 POSSIBLE NEXT MOVE:
🟢 Bullish scenario:
If BTC holds above the 80K breakout area and reclaims 81K with strong candle closes, continuation toward 82K becomes the next technical area.
🔴 Bearish scenario:
If price rejects 81K and loses 80K, the breakout could turn into a liquidity sweep. A deeper pullback toward the 78K–77K region would then become possible.
Confirmation: Watch for a clean retest, rejection, and bullish close above the breakout zone before considering continuation.
⚠️ INVALIDATION:
A sustained 1H close below 79.7K would invalidate this specific bullish continuation setup. Long 
Short 
BTCUSD INTRADAY 2H CHART ON THE LEFT . CHART DAILY ON THE RIGHT BTCUSD: You really had to follow the intraday price action closely, and it’s clear we could escape a nasty whipsaw today! The daily T2 bearish target was not reached, and the trade was stopped out!
On the intraday chart, we have S1 & S2 and T2 at 82,559 and 81,220 acting as support; on the daily, we have S1 and target 2 (T2) at 85,100.
The daily support sits at 78,185; we also have a daily Pn target at 85,406, which is rare. However, on the daily timeframe, we'll need to wait for the candle close to confirm an S2 that strengthens the move! Long 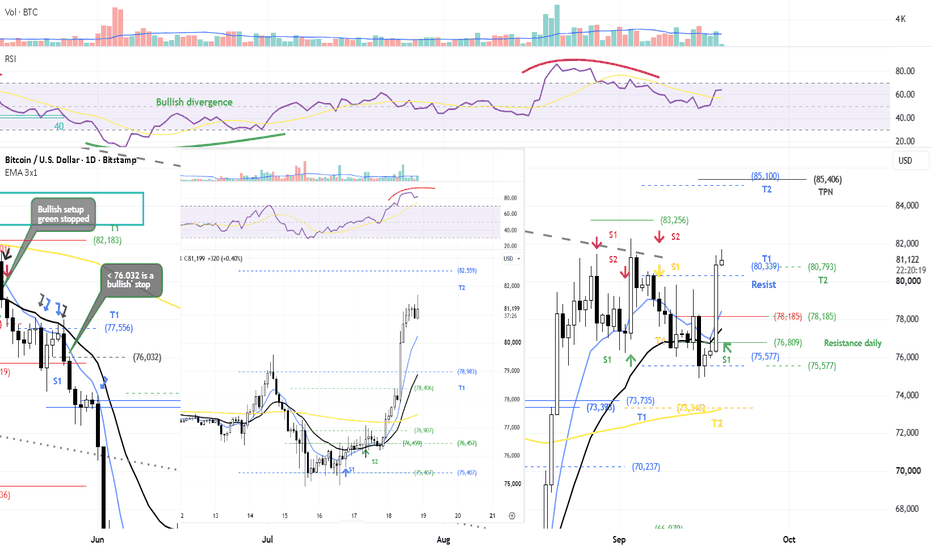
Short 
ETHEREUM at a critical zone — 2,350 holds or Bears Take Control!Current Price: ~2,400
Timeframe: 4H
Market Structure: Bullish recovery setup, but confirmation is still important.
🟢 Market Structure
ETHUSD has previously produced a CHoCH (Change of Character) followed by a BOS (Break of Structure), showing a shift from the earlier bearish structure toward a more bullish phase.
Price has now pulled back toward the 2,380–2,350 support zone, making this an important area to watch for a potential bullish reaction.
🟢 Key Support Zone — 2,380–2,350
This is the primary support area marked on the chart.
If buyers defend this zone and price starts forming higher lows, it could provide the foundation for another upward move.
🟢 Major Demand Zone — 2,100
The 2,100 demand zone is the deeper structural support area.
A significant decline toward this region would bring the broader bullish thesis under pressure, while a strong reaction from it could represent a larger-term demand response.
🎯 Potential Upside Levels
If ETH holds the 2,350–2,380 support area and bullish structure develops:
2,400 → 2,450 → 2,500 → 2,600–2,650
The 2,600–2,650 zone is marked as the major resistance area and could become a significant supply region.
🔴 Major Resistance — 2,600–2,650
This is the most important resistance zone on the chart.
Price has previously shown strong volatility around this region. A sustained breakout above it would be needed to establish a stronger continuation structure.
📈 SMC Flow
CHoCH → BOS → Bullish Structure → Pullback → Support Reaction → Potential Continuation
The current pullback toward support is therefore an important area for monitoring price action rather than assuming continuation automatically.
🚨 Invalidation / Risk Area
A decisive break below 2,350 would weaken the immediate bullish setup. Further weakness could expose the 2,100 demand zone.
📌 Key Levels
🟢 Support: 2,380–2,350
🟢 Major Demand: 2,100
🎯 First upside area: 2,450–2,500
🔴 Major Resistance: 2,600–2,650
📊 Structure: CHoCH + BOS
📈 Bullish confirmation: Strong reaction from support + new BOS
Bottom line: ETHUSD is sitting near a significant support region. The bullish scenario depends on buyers defending 2,350–2,380 and subsequently producing a confirmed bullish structure. The major upside obstacle remains 2,600–2,650. Long 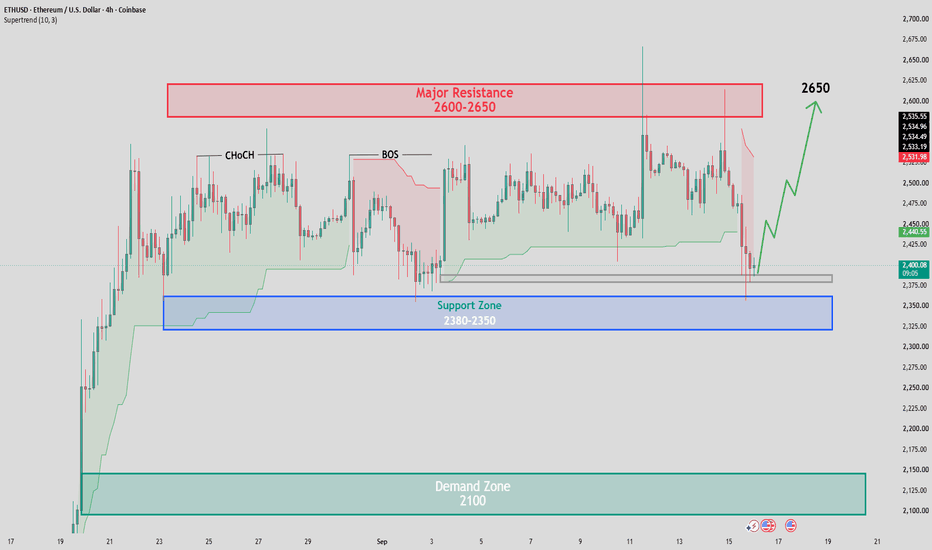
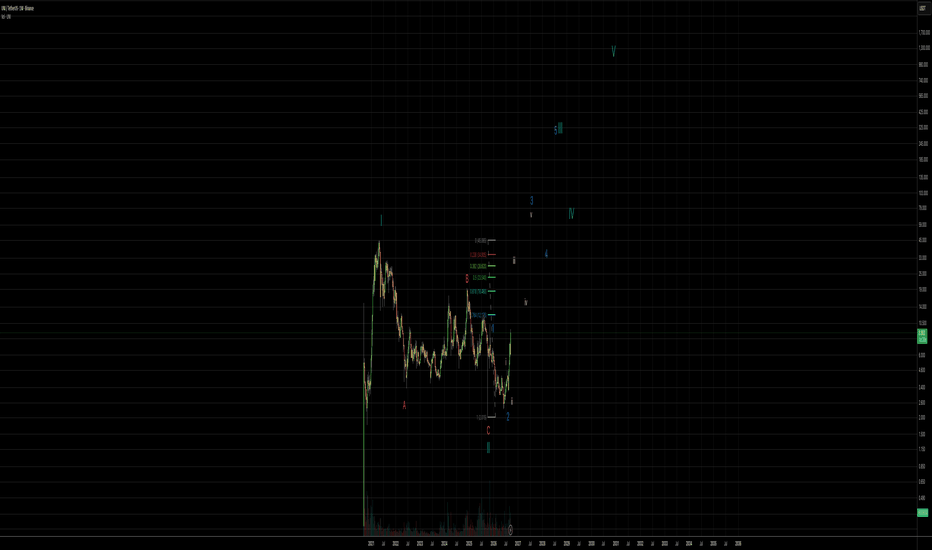
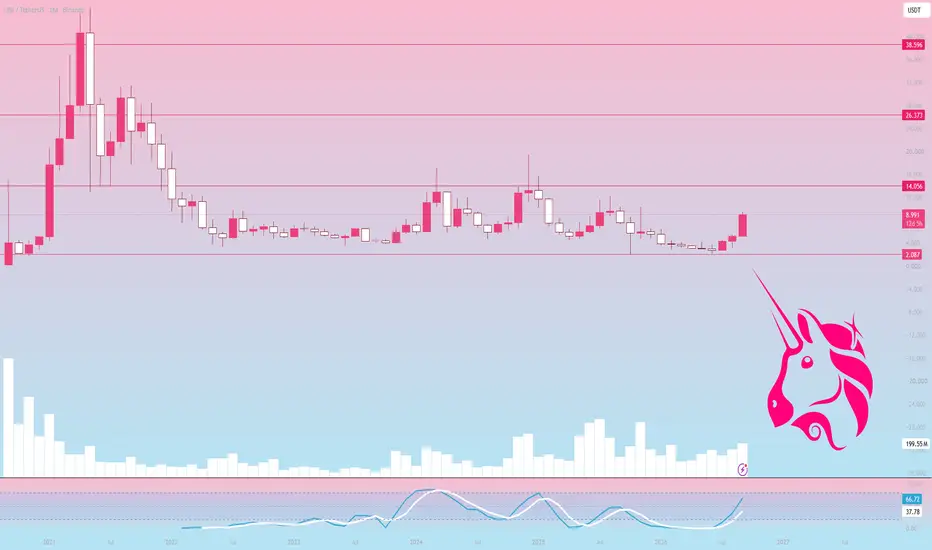
UNI | Why Is Uniswap Up 150% and Still Mooning?Uniswap just delivered a serious breakout, with the token surgin sharply as traders reacted to a new regulatory development around tokenized stocks
But this move is not purely hype, the rally is being supported by stronger tradin activity, exchange outflows, and a growin narrative that Uniswap could become an important piece of the infrastructure connecting traditional assets with onchain markets
🏛️ SEC Relief Changes the Narrative
The biggest catalyst came from the U.S SEC’s September 17 Innovation Exemption. The SEC granted temporary, conditional relief for certain Tokenized Securities Venues to trade tokenized U.S stocks through permissioned automated market makers and liquidity pools. The SEC did not specifically name Uniswap, but the structure immediately caught traders’ attention because Uniswap v4 already has Permissioned Pools designed to let regulated assets trade through AMMs while enforcing issuer restrictions onchain. In other words, the market suddenly found a regulatory framework that looks surprisingly compatible with infrastructure Uniswap has already been building
💰 $8M UNI Leaves Exchanges
That connection became a major catalyst for UNI. 17% daily rally, with trading volume jumping 67% to roughly $2 billion. UNI pushed through the $7.5 bullish Break of Structure after bouncing from around $5.9, before reaching an intraday high near $8.8. More interestingly, two newly created wallets withdrew approximately 1.1 million UNI worth about $8.4 million from Binance, Bybit, and OKX.. That does not guarantee another leg higher, but removing that much supply from centralized exchanges while price is breaking out adds another layer to the demand story
🌐 Uniswap Is Building the Tokenization Stack
What makes this move more interesting is that Uniswap has been building the tokenization story for months, rather than suddenly jumping onto the narrative. In June, Uniswap made tokenized securities such as SpaceX, Apple, Tesla, and NVIDIA available through its Web App, Wallet, and API, while reporting more than $9.1 billion of swaps in real world asset pools across over 2.6 million transactions and 140,000 plus wallets
In July and August, Uniswap introduced and expanded Permissioned Pools for regulated assets, while this week it also went live on Circle’s Arc network.. These developments give UNI a much broader narrative than simply being the token of a decentralized exchange
⚠️ The Real Test Comes After the Pump
There is still an important distinction between the narrative and what is actually confirmed. The SEC exemption is temporary and conditional, and it creates a pathway for qualifying permissioned venues rather than giving Uniswap blanket regulatory approval. At the same time, Uniswap’s continued expansion into tokenized assets, stablecoin infrastructure, permissioned liquidity, and new chains gives the market more reasons to treat UNI as a bet on the growth of onchain financial infrastructure
The next test is whether the current breakout can hold after the initial excitement fades
UNI has gone from a DeFi comeback trade to a tokenization infrastructure narrative in a matter of days. Now bulls ready to hit 10 , 12 and 14$ targets , are you READY ?  Long
Long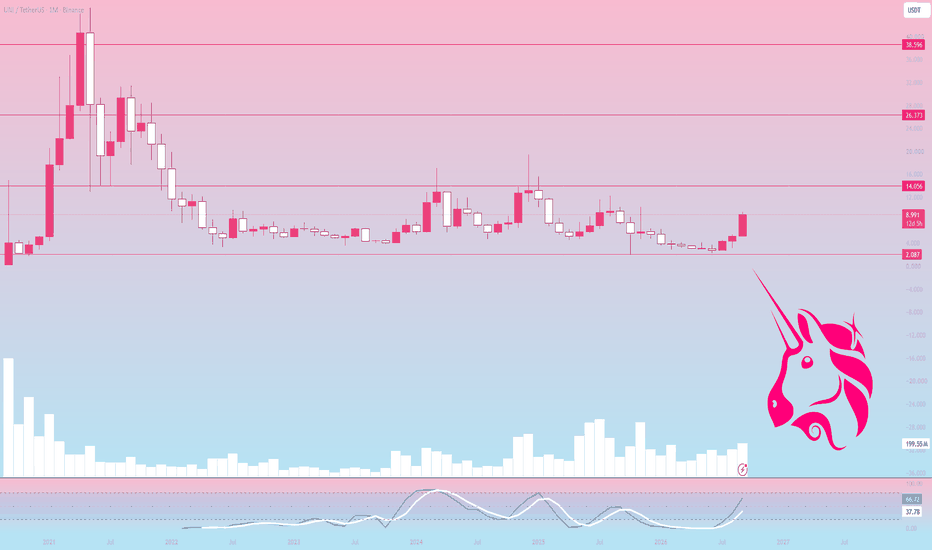
Long