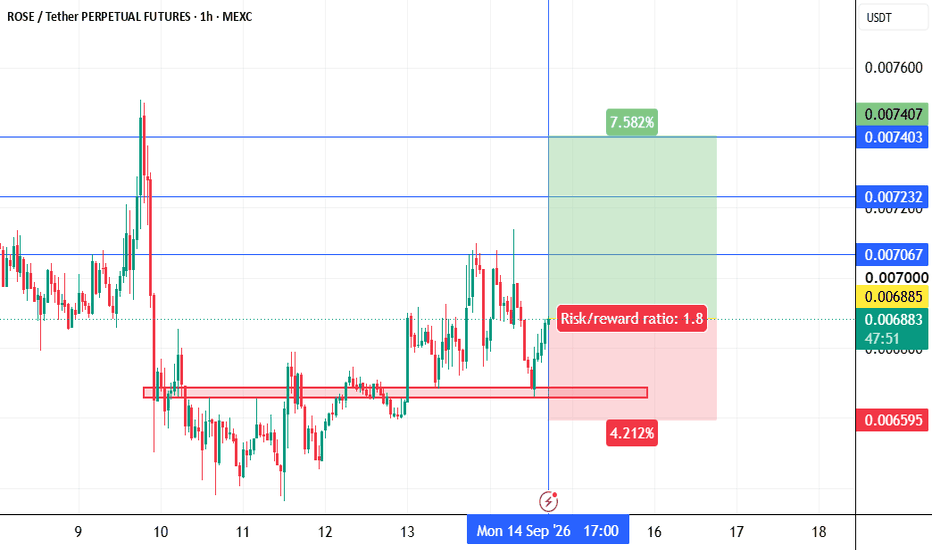
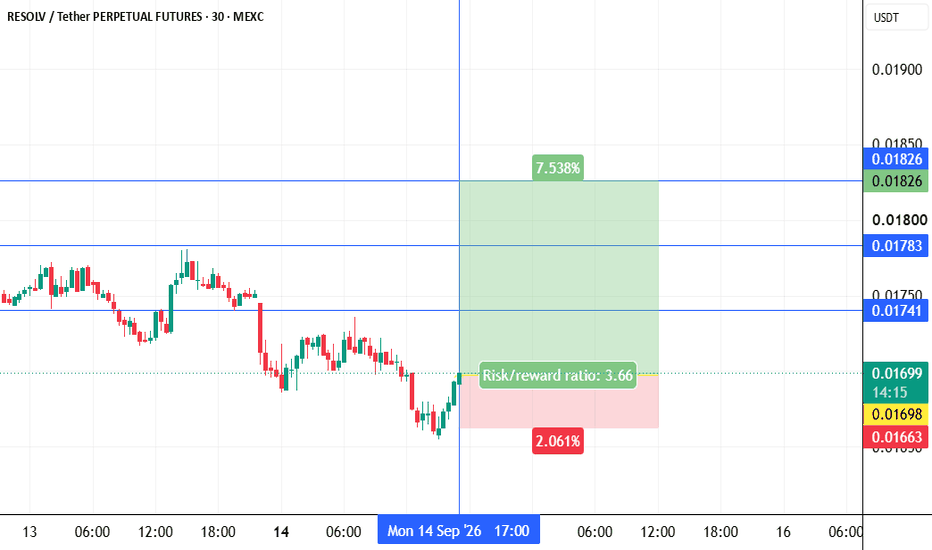
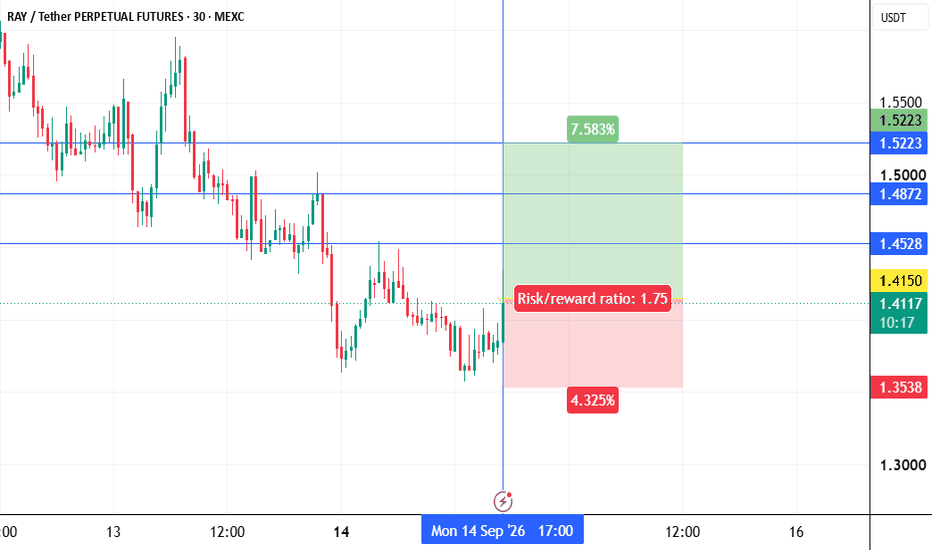
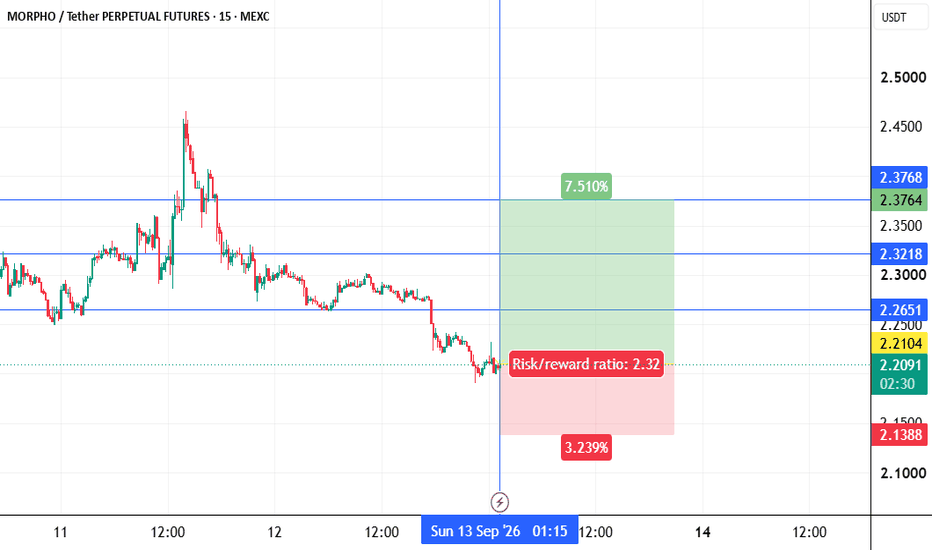
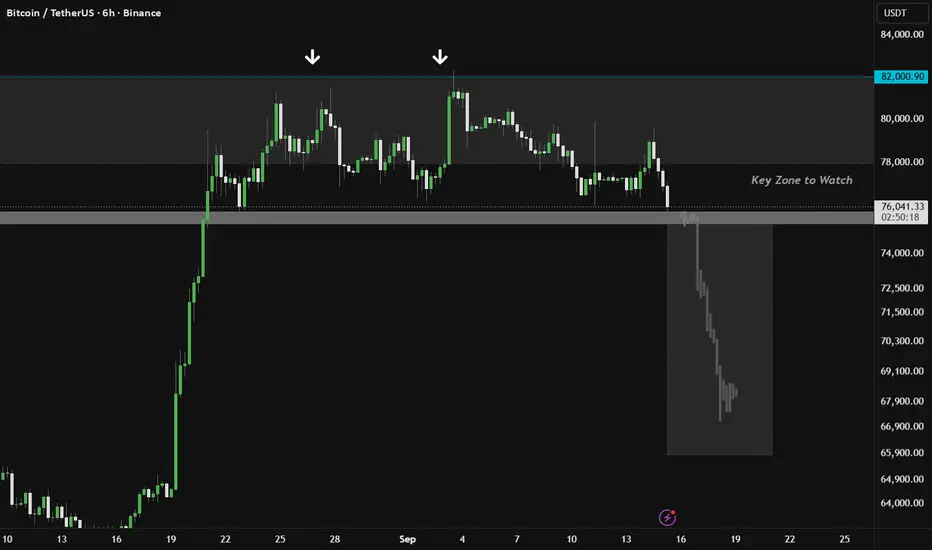
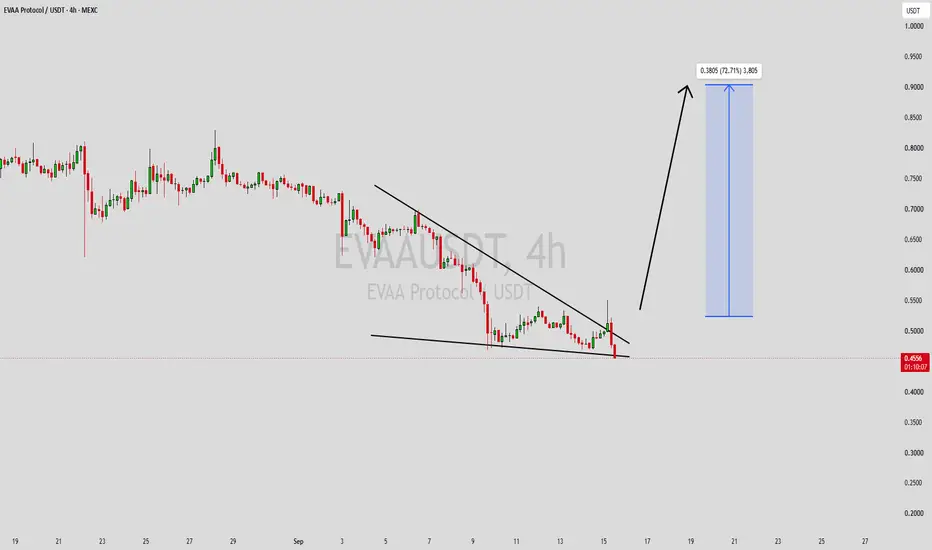
PENGU / PENGUUSDT Long Setup | Breaker Block ReclaimMARKET ANALYSIS
PENGU is currently reacting from a key technical area highlighted on the chart.
As long as the protected support zone remains intact, the bullish market structure remains valid and higher liquidity targets may continue to attract price action.
A breakdown below the invalidation level would weaken the current bullish scenario and require a reassessment of market conditions.
📍 Entry, Stop Loss and Take Profit levels are marked directly on the chart.
━━━━━━━━━━━━━━
⚠️ DISCLAIMER
This publication is provided solely for educational and market observation purposes.
Nothing contained in this analysis should be considered financial advice, investment advice, or a recommendation to buy or sell any financial instrument.
All trading and investment decisions remain solely the responsibility of the individual trader.
Always conduct your own research and apply proper risk management before entering any position.
━━━━━━━━━━━━━━
🎯 PARALOG
▪️Crypto Market Analysis
▪️BTC Futures Signals
▪️Bitcoin & Altcoin Market Analysis
Precision • Momentum • Timing
━━━━━━━━━━━━━━
Exchange: #MEXC Futures
#bitcoin #btc #crypto #futures #technicalanalysis
Crypto market
$BTC Is Setting Up the Next Big Short !CRYPTOCAP:BTC Is Setting Up the Next Big Short🚨
The 1D trend is still bearish. We already have a clear lower high and lower low, so right now I'm only looking for the next high-probability short setup.
I'm not interested in shorting at the current price. I want BTC to retrace into the 0.5–0.618 Fibonacci zone first. That's the area where I'll start watching closely.
But I won't enter just because price touches the zone. I need to see:
✅ Price reaches the 0.5–0.618 zone.
✅ Liquidity sweep happens.
✅ Bearish rejection or bearish engulfing candle.
✅ Market structure turns bearish (MSS).
✅ High selling volume.
If these confirmations appear together, I'll look for a short.
TRX: Bulls Lose Momentum at ResistanceResistance Continues to Hold
TRON has once again failed to break above the key $0.3341 resistance area, with sellers stepping in at almost the same level as the previous swing high. Repeated rejections suggest this remains the level the bulls must overcome to regain momentum.
Momentum Begins to Fade
RSI has slipped back below 50 while the StochRSI continues to weaken, pointing to fading bullish momentum. Although selling volume remains relatively neutral, the indicators currently favour the bears.
EMAs Losing Strength
The 100/50-day EMAs remain bullishly crossed, but both averages have started to flatten. That suggests the previous uptrend is losing momentum, with neither side yet taking decisive control.
Support Under Pressure
Initial support remains around $0.3108, where buyers have stepped in previously. A break below this level would weaken the current structure and increase the probability of a deeper correction.
In Summary
TRON continues to struggle beneath the key $0.3341 resistance zone, with momentum indicators beginning to soften and the bullish EMA structure losing strength. While the broader trend has not fully turned bearish, bulls need to reclaim resistance to regain control. Failure to do so keeps the focus on the $0.3108 support, where a breakdown would strengthen the bearish case.
BITCOIN - A false breakout of resistance in a bear market BINANCE:BTCUSDT.P is forming a retest of the key 64,500 resistance level as part of a countertrend correction, trapping late buyers while the market remains in a liquidity sweep phase
The broader trend remains bearish. Unstable ETF flows, the lack of meaningful fundamental support, and ongoing geopolitical uncertainty continue to weigh on the market.
Within the broader bear market, the market maker has swept liquidity above 64,500 before pushing price back into the trading range. Bitcoin remains in a 62,000–65,000 consolidation zone, while the higher-timeframe trend continues to point lower. A short squeeze into the resistance area could trigger another sell-off toward the 60K–50K region
Resistance levels: 64,450, 64,700, 65,600
Support levels: 62,750, 61,300
A retest of the liquidity pool above 64,450 may attract renewed selling pressure. If bears successfully defend this key resistance zone, it would further confirm the prevailing bearish market structure and increase the probability of a decline toward 62,750 and 61,300
Best regards,
R. Linda
Bitcoin weekly turns green: Market behavior explainedGood afternoon brother, how are you feeling in this wonderful day?
Hi ladies... I hope you are having a nice summer.
It has been shown over and over, sustained bullish action becomes possible when Bitcoin closes three consecutive weeks green. We have mainly two bullish periods since 2025. After the April 2025 low and recently, March 2026. In both instances, as Bitcoin closed three consecutive weeks green, a full bullish wave developed.
During the decline, downtrend, corrections and drops, never Bitcoin closed more than two weeks green. This is the third week and all that is required for this signal to be fulfilled, thus a very strong bullish confirmation for $85,000+, is a close on Sunday—BTCUSDT—above $63,800, that's all.
Perfectly fine and this is great, exactly where we are headed. Bitcoin is looking awesome on the weekly timeframe—slow growth can be sustained. A slow recovery leads to long-term bullish action. A prolonged bearish period is followed by a multiple years long bull market.
Are we looking at the same chart, brothers and sisters? You bet!
Are we on the same page? Probabilities are extremely high we are because the majority of the market is already on the LONG side of the Bitcoin trade.
Market behavior based on my 13+ years of experience
Everything can change in a flash. Most market participants are reactionary traders. Most traders are experienced players. Trades don't wait for months. They track the market, they know exactly what is happening and what to expect. They do not take action though unless the confirmation is in, when a certain price is reached. So, we see Bitcoin rising for weeks and yet, no major moves nor any strong action; here everything changes in a flash.
Once Bitcoin reaches a certain price, everybody jumps in at once and this produces the first major advance. Then many people return from vacation ready for work. The market turning green is appealing and they want to join the action; these are only a few of the factors that will work as fuel for the next bullish market phase.
Three weeks green now. Very good momentum can start to develop as soon as Bitcoin closes above $68,000. Below $70,000, Bitcoin is a great buy regardless of your strategy and plan. Bitcoin is set to grow beyond $200,000 in the coming years.
After $68,000 the market will respond but cautious. After $80,000, we will start to see the first signs of excitement and this leads to erratic behavior. Then the market will grow for months. After months of sustained growth, maximum hype and momentum, expect a new correction ending in a higher low.
We are green now... This is only the start. Expect green July, August, September & likely October 2026. This is the minimum. October and September can be doubted but not the previous two months.
Do you agree with this assessment?
Thanks a lot for your continued support.
Namaste.
BTCDisclaimer: This analysis is for informational purposes only and represents a personal point of view; it is not financial or investment advice. I am not responsible for any investment decisions or trades made based on this content. Trading in financial markets involves high risk; please always perform your own due diligence before making any decisions.
Analysis of the attached BTC/USDT Chart — Elliott Wave — 1day — Long-term Trade
The Professor X (Spot)
Pair: BTC/USDT
Timeframe: 1day (Primary) — 4H (Confirmatory)
Date: 16/07/2026 — 21:27 (CET)
Market Outlook: The general trend is bearish in the medium term, but there are initial signals of a new bullish wave (Wave C) forming within a major correction according to Elliott Wave theory.
Confidence Level: 57%
Adopted Analysis Method: Elliott Wave — The end of a bearish wave (B) and the potential start of a bullish wave (C) have been identified, supported by historically strong support zones.
Important Order Flow Zones:
Nearest Support Zone (Buyers Cluster): 64192 (Volume 5.077)
Nearest Resistance Zone (Sellers Cluster): 64201.2 (Volume 3.116)
Most Likely Reversal Zone: The support at 64192 is closest to the current price, with clear buying pressure from DOM data, reinforcing the probability of a bullish rebound from this area.
Trade Details:
Current Price: 64192.0 (Binance)
Trade Type: Buy
Entry: 64192.0
Target 1: 84500.0 (+31.65%)
Target 2: 108000.0 (+68.32%)
Danger Zone / Stop Loss (SL): 53800.0 (-16.21%)
Rationale:
Visual analysis indicates the completion of a bearish wave (B) within a complex correction, and the beginning of a bullish wave (C) according to Elliott Wave labeling on the chart. The price is currently at a historically strong support zone, with evident buying pressure from market flow (DOM/Footprint). Targets are based on Fibonacci extensions for Wave C, taking previous peaks into account. The stop loss is placed below the last support zone and does not exceed the first target percentage-wise.
Note:
Despite strong bullish signals, price action on smaller timeframes should be monitored to confirm the continuation of the bullish wave and ensure the main support is not broken.
BTC Crypto Analysis (Spot) | The Professor X
Pair: BTC/USDT 🌍
Timeframe: 1day (Main) + 4H (Confirmation) — Manual 📊
Date & Time: 16/07/2026 — 21:11 (CET) 🕒
🧭 Market Outlook:
Price is currently forming a new time bottom after a strong downward wave, marking the start of a bullish time cycle according to the Gann Time Cycle model shown on the chart. There is a clear bounce from a major bottom, and price is moving above an ascending trendline drawn from the recent low.
🎯 Confidence Level: 58%
📚 Analysis Methodology: Time Cycle Analysis — Based on Gann time lines and cycle intervals, monitoring the start of a new bullish cycle from the recent bottom.
🗺️ Key Order Flow Zones:
🟢 Nearest Support (Buy Wall): 64280.6
🔴 Nearest Resistance (Sell Wall): 64280.6
🔄 Most Likely Reversal Zone: Support at 64280.6 is the closest to the current price and is likely to be a strong bounce point due to its alignment with the start of the bullish time cycle.
💼 Trade Details:
🔍 Current Price: 64280.62 (Binance)
✅ Trade Type: Buy
📍 Entry: 64280.62
🎯 Target 1: 74200 (+15.4%)
🎯 Target 2: 82000 (+27.6%)
⚠️ Danger Zone / Re-entry (SL): 59800 (-7.0%)
🧠 Reasoning:
Time Cycle Analysis indicates the beginning of a new bullish cycle from a clear bottom, with price action aligning with Gann time lines. Price is trading above an ascending trendline, and there is a strong bounce from a major support area. Order flow shows a balance with a slight bullish bias, supporting a gradual upward scenario over the coming weeks. Targets were determined based on Gann time levels and historical resistances.
Disclaimer: This analysis is for informational purposes only and represents a personal point of view; it is not financial or investment advice. I am not responsible for any investment decisions or trades made based on this content. Trading in financial markets involves high risk; please always perform your own due diligence before making any decisions.
Bitcoin Price Update – Clean & Clear ExplanationBitcoin has reacted strongly from the 61,500–62,000 demand zone, where buyers stepped in and pushed the market sharply higher. This bullish momentum indicates that market sentiment remains positive, supported by continued institutional interest, ETF inflows, and improving overall crypto confidence.
Price is now testing the 64,500–65,000 key resistance zone, an area where sellers have previously defended aggressively. This is a critical decision point for the market. If buyers manage to secure a strong breakout with increasing volume, Bitcoin could continue its rally toward the 66,000–67,000 liquidity and resistance zone, confirming the next leg of the bullish trend.
However, if price fails to break above this resistance, a short-term correction is likely as traders take profits near the highs. In that scenario, Bitcoin could retrace toward the 63,500–63,700 support, with a deeper pullback potentially reaching the 62,800–63,000 demand area. As long as price remains above the major support zone around 61,500–62,000, the overall market structure remains bullish and any pullback may simply provide a better opportunity for buyers.
Overall Outlook: Bitcoin remains in a bullish market structure, but the current resistance zone will determine the next major move. A confirmed breakout favors further upside, while rejection could lead to a healthy correction before the longer-term uptrend resumes.
This analysis is shared for educational purposes only and should not be considered financial advice.
USDT.D - Mixed Signal One idea that is contrary to my most recent BTC post is what I am currently seeing with Tether dominance. To understand what I mean, it is important to go back to my past two USDT.D posts:
I was predicting a local high forming around the 9.25% level, followed by a rejection from overbought conditions that would flip trend momentum to the downside and signal cash re-deploying back into the crypto markets.
This is exactly what played out. The high came in on June 25th at 9.35%, with all subsequent daily candle bodies closing below my yellow ray. Trend momentum began shifting on June 26th right from overbought conditions, confirming the rejection I was predicting. Since then, Tether dominance has declined over 1% as cash has been redeployed into the market, driving crypto prices higher.
Dominance has now reached a very interesting level, the 8.25% level I have outlined with a blue ray and labeled "Key Level." Even before dominance reached this level following the breakout, I had already been outlining this as a key future level to watch. You can view that past idea here:
This is now the second time dominance is attempting to form a low at this exact level, which is why it stands contrary to my bullish outlook for Bitcoin outlined in this recent idea:
If USDT.D forms a low here and begins rising, that would signal a risk-off shift for the rest of the crypto market, causing prices to decline as participants exit crypto assets and convert back to cash, which would not support the continued move to the upside I have been outlining.
Yesterday, USDT.D formed a daily reversal doji that has started pushing dominance higher and crypto prices lower. This also coincides with a double bottom forming right around the 8.25% key level. Adding to this, a hidden bullish divergence is forming on the RSI, a higher low or double bottom on dominance paired with a lower low on the RSI.
Because of this, it is imperative that we see dominance fail to climb and instead close below the key level with a confirmed daily close, in order for Bitcoin to break higher and dominance to fall back toward the top of the parallel channel.
This could actually be aligning with a rejection from the level that was previously holding dominance to the upside. As long as daily candle bodies continue closing below this trendline, the entire contrary idea just laid out is invalidated, and BTC should continue to the upside while dominance continues to decline:
I am sticking to my primary thesis that crypto is still likely to climb, which would mean dominance should start rolling over again from here. But given the early developments I just outlined, I wanted to flag this contrary signal so we are prepared in case this does turn out to be a local low forming for Tether dominance.
XAUT - 4H - 16.07.2026The major support psychological floor at $4,000 has snapped. Heavy selling volume is driving price action through a structural void, targeting the lower demand clusters near $3,910 and $3,850.Sitting out until the flush completes.
Macro Technical Analysis for XAUt
The Breakout Failure:
XAUt had been aggressively fighting to hold a floor above $4,000. The pink zone around $4,017 – $4,040 was acting as the line in the sand for buyers.
The Present Drop:
Slicing beneath $4,000 marks a heavy bearish shift. Price action is cascading downward through a structural imbalance zone with very little immediate history to hold it up.
The Gold Catchment Targets:
The first minor stabilisation floor rests near $3,910. The ultimate institutional accumulation block sits lower down between $3,845 and $3,860.
ETH/USD (4H) Technical Analysis Ethereum is forming a Cup & Handle pattern on the 4H timeframe and is currently consolidating below the $1,850 neckline.
A strong 4H close above $1,850 could confirm the breakout and open the way toward $1,989, with an extended target of $2,157.
Key Levels:
🟢 Breakout: $1,850
🎯 Targets: $1,989 & $2,157
🔴 Support: $1,707
⚠️ Wait for a confirmed breakout or a successful retest before considering a long position.
💬 If you found this analysis helpful, please support me by liking this post and sharing your thoughts in the comments below. Your support is truly appreciated! 🙌
ONDO IS FUTURE OF TOKENIZATIONONDO Is Pumping Hard Following DTCC Pilot
CRYPTOCAP:ONDO is future of Tokenization
The token has surged nearly 20% in the past 24 hours after becoming the first to launch DTCC backed tokenized stocks.
The protocol completed the first tokenized stock issuances using the DTCC tokenization service, recording digital representations of DTC-held securities, including Circle NYSE:CRCL Stock.
With over $2.5B in TVL, Ondo is building a foundation for the future of finance.
Bitcoin Holding Demand – Smart Money Targets 67,000# BTCUSD Bullish SMC Analysis (4H)
BTCUSD is currently retracing into a key 4-hour demand zone after rejecting a major sell-side liquidity area near 64,000–65,000. The overall market structure remains bullish, with price respecting institutional demand and maintaining higher lows. This pullback appears to be a potential accumulation phase before another move toward higher liquidity.
# Smart Money Concepts (SMC) Overview
🟢 Market Structure
* CHoCH (Change of Character): A bullish CHoCH near the recent swing low signaled the transition from bearish to bullish order flow.
* Bullish BOS (Break of Structure): Multiple BOS confirmations validate the continuation of the uptrend and indicate institutional buying interest.
* Higher Lows: Price continues to establish higher lows, keeping the bullish structure intact.
🟢 Demand Zones
* Primary Demand Zone (58,000–58,500): Strong institutional accumulation area that initiated the current rally.
* Current Support (61,600–62,000): Price is retracing into a short-term support region, offering a potential bullish reaction zone.
🔴 Supply & Liquidity
* Sell-Side Liquidity / Psychological Resistance (64,000–65,000): Price has repeatedly reacted from this area, making it the nearest obstacle.
* Higher-Timeframe Supply Zone (65,500–67,000): Major liquidity pool where institutions may look to take profits after a breakout.
🟣 Fair Value Gap (FVG)
* The highlighted FVG has already contributed to the bullish continuation, suggesting previous market inefficiencies have largely been balanced.
# Bullish Outlook
As long as BTCUSD remains above the 61,600 support and the broader 58,000 demand zone, the bullish market structure remains valid. A successful defense of current support could provide the momentum needed to break above the 64,000–65,000 liquidity zone.
# Bullish Targets
🎯 Target 1: 64,000 – Retest of the current liquidity barrier.
🎯 Target 2: 65,500 – Breakout above the psychological resistance.
🎯 Target 3: 67,000 – Major buy-side liquidity and higher-timeframe objective.
# Overall Bias: Bullish 📈
Trading Plan: Watch for bullish confirmation (such as a lower-timeframe CHoCH or BOS) from the 61,600–62,000 support area. If buyers regain control, the path toward 64,000 → 65,500 → 67,000 becomes increasingly likely, with 67,000 remaining the primary liquidity target.
ETH Bulls Take Control | SMC Points to $2,050ETHUSD 4H Bullish SMC Analysis | Smart Money Eyes 2,050 Liquidity
ETHUSD has confirmed a bullish Change of Character (CHoCH) after sweeping liquidity beneath the recent lows and establishing a strong reversal from the 1,500–1,550 demand zone. The sharp impulsive rally and subsequent Break of Structure (BOS) indicate that buyers have regained control and market structure has shifted in favor of the bulls.
The Fair Value Gap (FVG) around 1,630–1,650 has acted as an institutional rebalancing zone, supporting continued upside. As long as price remains above this area, the bullish momentum is likely to remain intact.
The first key resistance lies at the 1,850–1,875 supply zone, where previous equal highs (SSL) and resting liquidity may attract profit-taking. A decisive breakout above this region would likely trigger a liquidity run toward the higher-timeframe sell-side liquidity between 2,035 and 2,050.
#SMC Bullish Summary
✅ CHoCH confirms a bullish shift in market structure.
✅ BOS validates continuation of the uptrend.
✅ FVG is acting as a strong bullish support zone.
✅ Higher-timeframe demand at 1,500–1,550 remains the key institutional buying area.
🎯 Target 1: 1,850–1,875 (Supply / Sell-Side Liquidity)
🎯 Target 2: 2,050 (Major liquidity objective)
$LTC: Bears Continue to Defend Initial ResistanceInitial Resistance Still Holding
Litecoin has pushed back into the $46.00 resistance area, but sellers continue to defend it. Price is also testing the 50-day EMA, adding further confluence to this zone.
Bulls Need a Clear Breakout
A convincing move above $46.00 would improve the short-term structure and shift attention towards the next resistance zone around $50.00-$50.50. Until then, the recent recovery remains vulnerable to another rejection.
Support Remains Important
The first key support sits around $42.90, where buyers recently stepped in. Holding this level would keep the short-term range intact and give bulls another opportunity to challenge resistance.
Downside Risk Remains
A break below $42.90 would weaken the current recovery and increase the likelihood of a move back towards the recent lows around $39.30. The preceding downtrend means the bears still retain a slight technical advantage.
Momentum Offers Little Clarity
RSI remains close to 50, showing neither side has established clear control. StochRSI is approaching overbought territory, which may make an immediate breakout more difficult without stronger buying pressure.
In Summary
Litecoin continues to test the $46.00 resistance area, but sellers remain in control of this level for now. A breakout would shift attention towards $50.00-$50.50, while rejection keeps $42.90 in focus as the first support. With momentum largely neutral and the preceding trend still down, bulls need a convincing move above resistance before the short-term picture begins to improve.
ONDO: Launching From Major SupportONDO: Launching From Major Support – Optimal Strategy to Target a High-RR Long Setup
ONDO has officially confirmed a powerful bullish breakout after clearing a pivotal dynamic barrier. Following a tight sideways consolidation phase that lasted over three weeks, a sudden surge in buying momentum successfully propelled the price action above the MA100 trend moving average line. This technical trigger materialized immediately after the price completed its third successful retest of the long-term ascending support trendline, signaling a highly promising new growth cycle.
Looking back at the historical data displayed on chart , the cyclical behavior of this asset is functioning exceptionally well. At the first trendline touch, the price rallied by 48%; at the second touch, the explosive expansion reached 103%. Currently, the third touch has officially initiated an upward push, aiming for a primary target back toward the previous major peak near the $1
.00 psychological round number.
To map out this setup, we can evaluate two entry approaches. Executing a direct buy (Long) at current market prices, with a secure stop-loss positioned below the ascending trendline, yields an attractive risk-to-reward (RR) ratio greater than 5. However, exercising patience to wait for a technical pullback to retest the dynamic MA100 line below will provide a much stronger edge, optimizing the setup with an outstanding RR ratio greater than 8.
Disclaimer: This is not financial advice, DYOR.
XRP PERPETUAL TRADE SELL SETUP Short from $1.1050XRP PERPETUAL TRADE
SELL SETUP
Short from $1.1050
Currently $1.1050
Targeting $1.0860 or Down
(Trading plan IF XRP go up to $1.15
will add more shorts)
Follow the notes for updates
In the event of an early exit,
this analysis will be updated.
Its not a Financial advice
*ONDO/USDT Bullish Breakout Eyes Major Resistance**
ONDO/USDT has confirmed a strong bullish breakout after reversing from a prolonged descending channel and building a solid consolidation base. Price has broken above the recent range with strong momentum, signaling increasing buying pressure. As long as the breakout structure remains intact, the next key objective is the upper resistance zone around **0.41–0.42 USDT**, which is marked as the target. A healthy pullback toward the breakout area could provide additional confirmation before another move higher.
**🎯 Target:** **0.4100 – 0.4200 USDT**
Solana (15 Minute)The first thing that stands out is the violent downside displacement that swept liquidity and immediately found buyers.
After the flush, Solana stopped making lower lows and began compressing.
That's usually the first clue that sellers are losing control.
The area I've marked near 76.80 to 76.90 is the obvious magnet because it represents the breakdown origin.
Current structure:
Immediate support: 75.80 to 75.90
Resistance: 76.80 to 76.90
As long as Solana remains above the morning low, the recovery scenario remains intact.
Loss of the recent low invalidates the setup.
Most traders see the breakdown and assume continuation lower.
What interests me is that the breakdown failed to attract aggressive follow through selling.
Instead, buyers immediately stepped in.
Failed breakdowns often become fuel for moves back into the originating liquidity zone.
ARXUSDT.P: short setup from support at 0.1631BINANCE:ARXUSDT.P is in a downtrend and doesn't even react to Bitcoin's growth. The support level, which is the all-time low (ATL), has already been tested today, and we can now see a formed pre-breakout base. In my opinion, all that's left is to wait for an entry point according to the strategy to catch a likely good short.
LEVEL PROFILE:
Name: ATL
Price: 0.1631
Timeframe: D1
Level validations:
exact price taps (pixel-perfect)
impulse halt at the level WHAT I WANT TO SEE:
trend alignment
clear path beyond level
price compression (squeeze)
volatility contraction on approach
close retest Do you see this setup differently? Let me know your thoughts in the comments.
If this logic aligns with your trading plan, support the idea with a boost!
Disclaimer: This publication is part of my public trading journal. The material is strictly for educational purposes, reflects my market perspective, and is not financial advice. Trading facts, not expectations.
AShort