Crypto market
TSMC rallied on good news, then sold off just as hard on bad newrTSM’s Good News Pumped the Stock. Its Bad News Sold It Off Just as Hard.
TSMC beat Q2 badly, $40.2B revenue, up 33.7% YoY, record margins across the board. The stock popped back above $410 within a day of the earnings flush. Then it rolled right back over, down to $398.37 with a day low of $386.02, once investors actually sat with the capex guidance: heavier spending, tighter near-term margins.
Context: This is a two-part story in one week. First the market panicked on a clean beat (classic sell-the-news), then it reclaimed the loss, then it sold off again for a completely different reason once the guidance sank in. Two separate reactions, two separate pieces of information, both showing up cleanly in the price.
The trade: What I actually paid attention to here wasn’t the direction, it was that rTSM moved through both legs exactly in step with the real stock, the earnings flush to $397, the reclaim to $421.50, the rollover back to $398. No lag, no divergence, no weird gap where the token did its own thing. That’s not an accident, the price isn’t pegged to TSM, it’s routed straight into the actual order book.
If it were priced off an oracle or a thin token pool instead, a two-reversal week like this is exactly where you’d start seeing daylight between the token and the stock. There wasn’t any.
Risk view: Susquehanna’s at $600, the street average is north of $520, but the near-term story right now is margin pressure from the 2nm ramp, not the AI demand story. A close below $382 says this second flush isn’t done.
Conclusion: Watching $386–$400 for a reaction on Bitget. Reclaiming $410 confirms the bounce; $440 is next if it holds. Below $382, the flush continues.
Did you catch both legs of this move, or just the first one?
RLong
MCADE looking desperate MCADE is still in a broader downtrend, but the daily chart is beginning to show signs of stabilization after an extended sell-off.
Price is building a base inside a high-volume support zone, while repeated lower wicks suggest buyers are absorbing liquidity near the range lows. The major challenge remains the red resistance level, which marks the previous breakdown area and a heavy zone of trapped supply.
The Synergy Signal is showing improving underlying momentum, with the purple trend line rising toward bullish territory. However, the faster orange signal has rejected from overbought conditions, suggesting short-term consolidation may be needed.
A higher low followed by a strong breakout through resistance would confirm a more meaningful trend reversal. Until then, CRYPTOCAP:MCADE remains a potential accumulation setup rather than a confirmed bullish breakout.
ETH Ripped From $1,560 to Near $1,940. Then Iran Happened.Ethereum’s had a real month, climbing from a late-June low near $1,560 up to roughly $1,938 by mid-July. Friday it opened down 2.8% at $1,863.16 as US strikes on Iran escalated, dipped toward the 50-day EMA near $1,820, and has spent the weekend consolidating around $1,866.
Context: This isn’t a broken rally, it’s a real one getting tested by something that has nothing to do with crypto fundamentals. The 50-day EMA at roughly $1,801 has acted as the line separating “still recovering” from “starting to roll over” for weeks now, and price found buyers right around there again on Friday’s dip.
The trade: I’ve got ETHUSDT up on Bitget watching this exact zone , $1,800–$1,850. It’s the same level that’s held on every real test since the recovery started.
The 100-day EMA near $1,943 is the resistance that actually matters next; a clean reclaim there is what opens the door toward $2,000, not just a green candle on light volume.
Risk view: Geopolitical headlines don’t respect technical levels, if the Iran situation escalates further over the weekend, this support zone can give way on a gap, not a slow grind. A close below $1,750 would say the recovery structure is actually breaking, not just pausing.
Conclusion: Watching $1,800–$1,850 for support. Reclaiming $1,943 opens room toward $2,000; below $1,750 says the recovery’s in real trouble.
Are you still trusting this recovery through the geopolitical noise, or is the Iran headline enough to make you step back?
WLFI 8H – Triangle Breakout Attempt at Upper TrendlineWLFI on the 8H timeframe is currently trading around 0.0616 after the symmetrical triangle that had compressed price into its apex has now broken to the upside, with price pushing through the descending upper trendline and pressing directly into the 0.0600–0.0610 resistance zone for the first confirmed test above the structure.
The chart shows the same symmetrical triangle visible across the prior two ideas on this coin, with the descending upper trendline now clearly being tested from above following a break through it near 0.0598–0.0600. The rising lower trendline connects the May low near 0.0513 through the July lows near 0.0556–0.0565 and continues to climb into the 0.0570–0.0572 area currently, now acting as support beneath the breakout. The horizontal pivot near 0.0570–0.0575 has been the centerline of the compression throughout and is now sitting as the first reference below on any pullback. Price has pushed through the upper trendline and is currently consolidating just above it near 0.0600–0.0616, which is the exact zone that has defined the upper boundary for the entire duration of the triangle.
The breakout from a triangle that spent over two months compressing on the daily timeframe carries significant structural weight, and the key question now is whether price can hold above the broken trendline on a confirmed close and build on the move.
Key Levels To Watch
→ 0.0820–0.0840 – April high, major resistance above
→ 0.0740–0.0760 – Prior recovery high, resistance
→ 0.0640–0.0660 – First significant resistance above breakout
→ 0.0620–0.0630 – Minor resistance, immediate overhead
→ 0.0598–0.0610 – Broken upper trendline, now support (dynamic)
→ 0.0570–0.0575 – Horizontal pivot, secondary support
→ 0.0556–0.0565 – Rising lower trendline, dynamic support (climbing)
A confirmed 8H close above the broken upper trendline near 0.0598–0.0610 and follow-through above 0.0620–0.0630 would confirm the breakout as structural, opening a move toward 0.0640–0.0660 and potentially 0.0740–0.0760 on continuation as the full triangle target.
A rejection back below the broken trendline near 0.0598–0.0600 and a loss of the 0.0570–0.0575 horizontal would suggest the breakout was a false move, pulling price back into the compression zone and reopening the risk of a bearish resolution toward the lower trendline near 0.0556–0.0565.
Triangle breakout attempt after months of compression, confirmation needed on close. Hold above 0.0598–0.0610 → breakout confirmed, eyes on 0.0640–0.0760. Lose 0.0598 and 0.0570 → false breakout, back into compression. Bias cautiously bullish above broken trendline. Shift only on confirmed close back below 0.0598–0.0600.
BTC Terlihat Bullish... Tapi tunggu dulu Bitcoin has successfully defended the 64,000 demand zone, but in my opinion, the bullish move is not confirmed yet.
As long as the descending resistance remains intact and the breakout isn't supported by convincing volume, I still consider the current price action to be part of an accumulation phase.
📈 If the breakout is confirmed:
🎯 65,000 → 65,800 → 66,700+
📉 However...
If BTC loses the 64,000 support zone, the current bullish outlook will need to be reassessed, as the market structure could shift back in favor of the bears.
What do you think?
Is this the beginning of a new impulsive move, or just another fake breakout before the next leg down?
💬 Share your thoughts below—I’d love to hear your perspective.
MYX Appears Ready for a Bullish Move (4H)This coin appears to be forming a large Diametric correction, with wave D having recently been completed.
We are now in wave E of this larger Diametric, which itself appears to be developing as a Double Combination. At the moment, the market seems to be in the first correction of this Double Combination, taking the form of a Diametric.
Price now appears to be in wave F of this Diametric. Once wave G is completed, the market could form an upward X wave.
The highlighted green zone offers a potential area to look for buy/long positions.
The targets are marked on the chart.
A daily candle close below the invalidation level will invalidate this analysis.
If you have a symbol you want analyzed, first hit the like button and then comment its name so I can review it for you.
Do you also think MYX is bullish?
JTO has completed a bullish pattern (4H)JTO has entered a bullish cycle from the point where we placed the green arrow on the chart. This cycle has formed as a Diametric pattern, and its final wave, wave G, has also been completed.
We expect JTO to enter a bearish wave or pattern of the same degree as the previous pattern. If a pullback occurs into the red zone, it will present a sell/short opportunity.
A daily candle close above the invalidation level will invalidate this analysis.
If you have a coin or altcoin you want analyzed, first hit the like button and then comment its name so I can review it for you.
What do you think? Is JTO bearish?
With rToken: Owning US stocks becomes simple.You can access over 500 US stocks and ETFs using USDT—without needing a US brokerage account, converting to USD, or dealing with paperwork.
This is ideal for anyone unable to open a US brokerage account directly—or simply those who prefer not to.
- rToken offers full access to the US stock market entirely within the crypto ecosystem.
I noticed this weekend that AAPL hit a new all-time high; you don't need a US brokerage account to trade it. Instead, you can capitalize on this upward momentum by trading rAAPL against USDT directly on your Bitget account.
Have you checked out rToken yet? Let's share our thoughts.
Ethereum (ETH/USD) Primed for a Major Move!🚀 🚀A textbook setup is unfolding on the 4-hour chart, presenting an incredible high-probability opportunity:
🔹 The Setup: Price is testing the 4h bullish order block perfectly, aligned with strong ascending trendline support.
🔹 Entry Point: Executing precisely at 1,859.08.
🔹 Take Profit (TP): Eyeing the major resistance zone at 1,977.65.
🔹 Stop Loss (SL): Risk is strictly managed at 1,776.08, safely tucked below the Daily Order Block.
Consistency and disciplined risk management are what separate successful traders from the rest. The market rewards those who analyze patiently and execute flawlessly!
📈💼What are your thoughts on this ETH setup? Drop your predictions in the comments! 👇#Trading #Ethereum #ETHUSD #TechnicalAnalysis #CryptoTrading #OrderBlock #PriceAction
$VANRY is finally showing some strength after spending days tradCRYPTOCAP:VANRY is finally showing some strength after spending days trading under the descending trendline.
The breakout looks promising, but now the important part is holding above it. If buyers can defend this level and keep the momentum going, there's a good chance we'll see another leg higher.
For now, the bulls are in control, but the next few 4H candles will tell us whether this breakout has enough strength to continue.
B T C : ($64 181 Take Profit)The (Scalp Trade) towards the (Upside Direction) has held very well and managed to hit the (Take Profit) as we were simply just (Capitalizing) on the(1H Time Frame) while using the momentum provided by the (Bulls)
The (Entry Price) was ($64 181) and the (Stop Loss) price is ($63 221) with a (Take Profit) of ($65 205) this is because we already had a trade taken below at a (Lower Price) of ($62 907) and it was then decided it would be best to take another (Buy Scalp Trade) towards the (Upside Direction)
Carrying on with the (Long Term Trend Direction) a (Scalp Trade) was (Executed Flawlessly) and it hit (Take Profit) with a very little amount of (Drawdown) as mentioned all done on the (1H Time Frame) and also the trade didn't need any requirements to be made like (Adjustments) of moving the (Stop) to (Entry) or closing (Partial Profits)
The trade signal provided from before will be attached below so it can make it easier to understand and find out what happened, we've managed to hit (2 Take Profits) with the first trade from ($62 907) and the (Scalp Trade) at the price of ($64 181) , so we followed one single (Trend Direction) and one (Market Price Bias) which gave (2 Buy Trade Opportunities) and they both hit (Take Profit)
⬇️ Pervious Trade Below ⬇️
⬇️ Scalp Trade Below ⬇️
ETH Could Be Setting Up for Its Next Major RallyCRYPTOCAP:ETH monthly frame of view is easy to understand.
ETH is consolidating within a larger range of $1,000-4,500. The price is hovering around a support area right now and there is possibility of further price crash down to the $1,500 level.
Here is likely gonna be a nice push to the upside if we are able to see any bullish confirmation there, if not, then nothing to worry about, have the macro in your vision, and wait for a high probability trade to appear.
DYOR, NFA
BINANCE:ETHUSD
VANRYUSDT: Ready for a Potential 50% PumpVANRY is showing signs of bullish momentum and may be preparing for a strong breakout. A confirmed move above the current resistance zone, supported by volume, could open the path toward a potential 50% upside move.
Watch for a clean breakout and successful retest before expecting continuation. Manage risk—this is a market idea, not financial advice.
$SUI is still holding its support zone, which is a good sign. EvCRYPTOCAP:SUI is still holding its support zone, which is a good sign. Even after the recent pullbacks, buyers haven't let the price lose this area.
Right now, the biggest challenge is the 50 EMA, with the 99 EMA just above it. If SUI can push through both and hold a daily close above them, it could be the start of a much stronger recovery.
For now, nothing has changed. As long as support holds, the setup remains bullish. The next step is reclaiming the EMAs and turning them back into support.
RToken – Optimizing trading with traditional stocksTypically, traditional stock trading is limited to the Monday-through-Friday work week.
In contrast, rToken products allow for trading during standard U.S. market hours—five days a week, 24 hours a day—as well as during pre-market, after-hours, and overnight sessions. Furthermore, the 20 most actively traded assets (such as rNVDA, rAAPL, and rTSLA) trade around the clock, including weekends, reflecting Friday's closing prices, market maker quotes, and current market expectations.
In practical terms, this means that when macroeconomic news breaks or a market-moving event occurs over the weekend, investors in traditional stocks are forced to wait on the sidelines until the market reopens on Monday.
rToken holders can react to news and trade instantly to minimize risk, while also avoiding missed opportunities arising from positive stock news over the weekend.
This is how I capitalized on the weekend price drop of rNVDA to open a buy position. With Bitget, you can purchase rTokens at any time—all through a single account.
Ethereum (ETHUSDT) | Long Setup from Key SupportEthereum is holding above a strong support zone after a sharp pullback, showing signs of stabilization. The 1840–1850 area is a key demand zone where buyers may step in if the price continues to respect support.
As long as price remains above the invalidation level, I expect a recovery toward the marked resistance levels.
Trade Plan:
Entry: 1840–1850
Stop Loss: 1830
TP1: 1879
TP2: 1892
TP3: 1928
A break below 1830 would invalidate this bullish setup. Risk management is essential, and waiting for confirmation before entering the trade is recommended.
This is my personal market analysis and not financial advice.
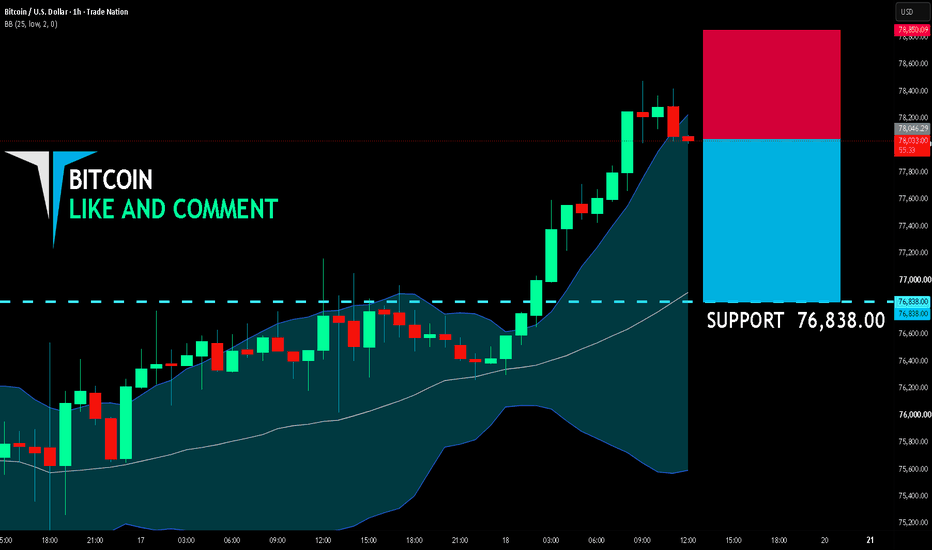
BTCUSD: Bearish Continuation & Short Signal
BTCUSD
- Classic bearish setup
- Our team expects bearish continuation
SUGGESTED TRADE:
Swing Trade
Short BTCUSD
Entry Point - 64161
Stop Loss - 64519
Take Profit - 63518
Our Risk - 1%
Start protection of your profits from lower levels
Disclosure: I am part of Trade Nation's Influencer program and receive a monthly fee for using their TradingView charts in my analysis.
❤️ Please, support our work with like & comment! ❤️
Bitcoin Weekly Market Structure
## BTC Stabilized, But The Market Has Not Recovered Yet
**Week Ending July 19, 2026**
Bitcoin had a quiet week on the surface.
BTC moved from **$64.0K to $64.4K**, gaining only **0.5%** week over week.
But the path was much more volatile:
* Weekly low: **$61.8K**
* Weekly high: **$65.6K**
* Total range: **6.1%**
The key takeaway:
> **Bitcoin stabilized. The broader market did not confirm the recovery.**
---
## BTC: Recovery Within A Range
Bitcoin recovered from the early-week selloff and tested the $65.6K area.
However, price remains inside the weekly range rather than establishing a new expansion phase.
For market structure to improve, BTC needs:
* Hold above recent resistance
* Sustained buying momentum
* Confirmation from other major crypto assets
BTC is showing resilience, but the market has not yet confirmed a broader recovery.
---
## Breadth Remains The Missing Piece
The biggest weakness remains market participation.
Only **27% of tracked altcoins are currently above their 200-day moving average**, down from **31% last week**.
Some assets are showing relative strength, but the recovery remains concentrated.
Current environment:
* A few leaders are outperforming
* Most assets remain below stronger trend levels
* Broad risk appetite has not returned
A healthy crypto expansion usually requires participation beyond Bitcoin.
---
## Market Conditions: Less Panic, Still Fragile
The market environment has improved from recent stress levels, but conditions remain fragile.
Current observations:
* Macro pressure remains relatively contained
* Crypto participation remains weak
* Positioning has become more active, but price strength has not broadened across the market
The message is simple:
> Less fear does not automatically mean a confirmed recovery.
---
## Relative Strength: Selective Opportunities
Strength remains concentrated in a small number of assets.
Current leaders:
**NEAR**
**RENDER**
Meanwhile, several major assets continue to lag, including:
* ETH
* SOL
* XRP
The current environment favors selective opportunities rather than broad market exposure.
---
## What To Watch Next Week
### Bullish Confirmation
The market improves if:
* BTC breaks and holds above **$65.6K**
* More assets recover together
* Market breadth expands
### Risk Signals
Caution increases if:
* BTC loses **$61.8K**
* Breadth continues weakening
* Leverage increases without broader participation
---
# Bottom Line
Bitcoin has stabilized, but stabilization is not the same as recovery.
The next important signal is not only where BTC trades.
It is whether the rest of the market starts to follow.
**Price leads. Breadth confirms.**
---
*Educational content only. Not financial advice.*
---