SOL/FDUSD: Dual Scenario Analysis — Wave B Top vs. Wave (5) PushHello Traders! 👋
Here is an updated technical outlook for SOL/FDUSD on the 1H timeframe under our Posibility 2 macro structure.
Macro Wave Context:
Looking at the larger structure, the current price action aligns closely with a corrective green Wave B rather than a primary impulse Wave 5. There ar
Compare with SOL / FDUSD
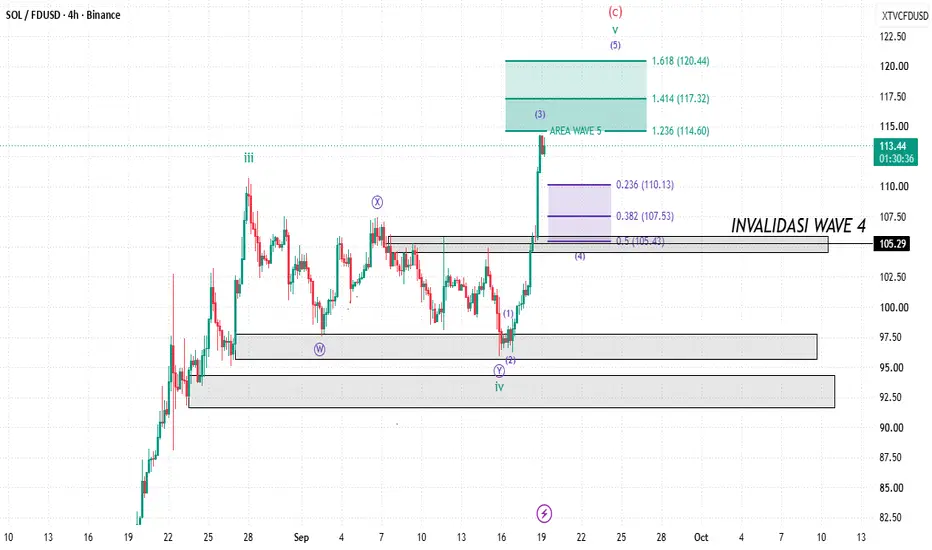
SOLANA UPDATESolana is showing strong impulsive momentum again after successfully breaking above local resistance levels. Looking at it through the Elliott Wave framework, this sharp rally towards the 114,xx mark likely signals the completion of Wave (3).
Key technical observations:
Wave (4) Retracement Zone
SOL/FDUSD ANALYSISCRYPTOCAP:SOL is currently showing a strong Elliott Wave structure (Posibility 2). Here is the breakdown of what to expect next!
💡 Market Overview & Strategy:
We have two potential paths moving forward:
1️⃣ Direct Pump: Price continues its upward momentum straight towards the major target zone at
H1 SOLFDUSD UPDATE 1H chart shows an Elliot Wave structure (1-2-3-4-5 pink). I'm currently holding NO POSITION due to a potential Wave 3 extension to Fib 2.618 ($92.52).
🎯 Trading Plan:
Watching $97.41 - $98.57 (Fib 1.38-1.618). A strong rejection confirms a Wave 4 bounce to $100 - $101. If it breaks, wait for the $9
SOL/FDUSD: (Wave) B Expansion Target $108 - $113Hello Traders! 👋
On the 4H SOL/FDUSD chart, price action is currently respecting the Posibility 2 scenario, indicating the completion of a Wave b corrective structure (Expanded/Flat Correction).
Technical Analysis & Elliott Wave:
Wave b Structure: The bullish momentum from $97.00 is expected to c
SOL 4H Analysis: Possibility 2 — Deeper Corrective Wave Ahead?Solana ( CRYPTOCAP:SOL ) has tapped into our targeted resistance zone on the 4H timeframe, completing Wave b of its ongoing corrective pattern. We are now monitoring a potential impulse drop in Wave c / Wave iv before the larger macro rally resumes! 📊
🔍 Technical Structure Breakdown
Wave b Completi
SOLFDUSD - Bearish Scenario (Possibility 2)Here is a detailed look at SOL/FDUSD on the 4H timeframe following Elliott Wave structure:
Current Wave Structure: We are completing Wave 5 of a larger corrective leg (Wave a) down into the primary demand box.
Key Support Cluster: Wave 3/5 targets align closely around $94.20 (1.618 Fib) down to $9
SOL/FDUSD: Wave ii Top Confirmed – Preparing for Sub-Wave BreakdOverview
Solana (SOL) has successfully printed the expected corrective Wave ii (green) after completing an A-B-C pullback around the $102.50 – $103.00 zone. The current 1H chart shows early signs of rejection from the top, indicating that the impulse wave down is commencing.
Elliott Wave Structure
SOL/FDUSD: Impulsive Wave 1 (Green) Completed?Preparing for Wave 2 (Green) Rebound
The minor impulsive structure appears to have completed its 5-Wave (Purple) cycle right at the Demand Zone ($94.00 - $94.50). This impulsive decline marks the completion of Wave 1 (Green) (or sub-wave A of a larger correction).
Currently, we are anticipating an
SOL/FDUSD Technical Update: Is Wave 5 Already Complete?Date: August 25, 2026
Timeframe: 1-Hour (1H)
Pair: SOL/FDUSD (Binance)
Solana ( CRYPTOCAP:SOL ) is testing critical resistance! While our initial minimum target for Wave 5 (Green) of Wave (C) Red was set at $103.45 (0.618 Fib), current price action suggests Wave 5 might have already topped out
See all ideas
Summarizing what the indicators are suggesting.
Oscillators
Neutral
SellBuy
Strong sellStrong buy
Strong sellSellNeutralBuyStrong buy
Oscillators
Neutral
SellBuy
Strong sellStrong buy
Strong sellSellNeutralBuyStrong buy
Summary
Neutral
SellBuy
Strong sellStrong buy
Strong sellSellNeutralBuyStrong buy
Summary
Neutral
SellBuy
Strong sellStrong buy
Strong sellSellNeutralBuyStrong buy
Summary
Neutral
SellBuy
Strong sellStrong buy
Strong sellSellNeutralBuyStrong buy
Moving Averages
Neutral
SellBuy
Strong sellStrong buy
Strong sellSellNeutralBuyStrong buy
Moving Averages
Neutral
SellBuy
Strong sellStrong buy
Strong sellSellNeutralBuyStrong buy
Displays a symbol's price movements over previous years to identify recurring trends.