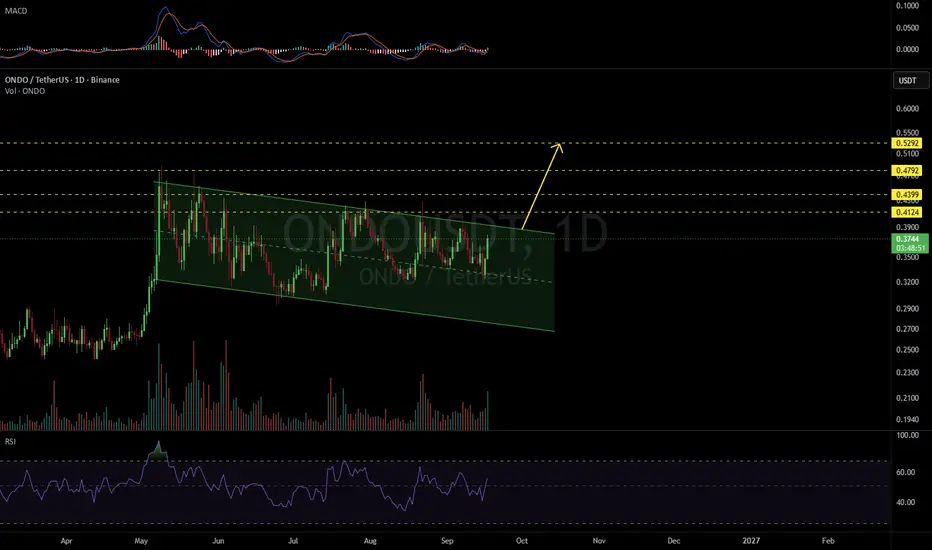
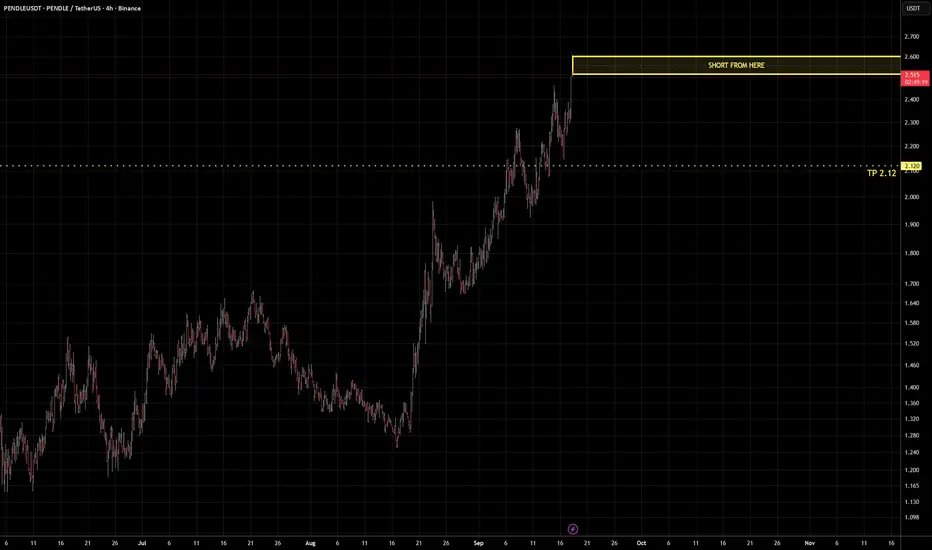
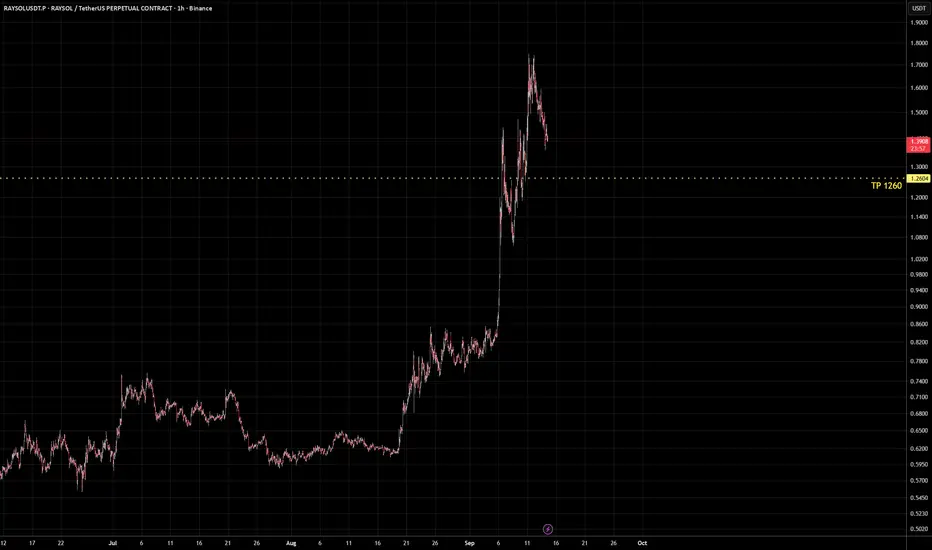
Long
Long
ARB: Is History About to Repeat? +120% SetupARB | Daily
I’ve been looking at ARB and the current structure is getting very interesting.
1. Descending channel
ARB has been moving inside a very clear descending channel, which has been remarkably consistent.
2. 2023 price pattern
I took the price action pattern from 2023 and projected it onto the current structure. The match with the previous movement is surprisingly close.
3. RSI
RSI is now sitting at almost exactly the same levels as it was back in 2023.
4. Open Interest
OI is slightly lower, but that’s not surprising after such a long bearish period. More importantly, we’re starting to see OI increase, just like in 2023.
5. VDS
I pushed VDS to its maximum sensitivity to find the strongest historical entries. Over the last few months, it has now triggered its **4th BUY**.
Price bounced after each signal, then moved lower again. But the declines are becoming relatively minor.
That tells me something important:
ARB doesn’t seem particularly interested in falling further.
### The setup
A pullback toward $0.088 , followed by a move toward the upper boundary of the channel around $0.19 .
That would be roughly +120% .
Of course, there are major risks.
The broader bearish market structure is still intact, and ARB has essentially been trading in a downtrend throughout its history.
So for now, the trend still gives shorts the priority .
But when the price pattern, RSI, OI and VDS start telling a very similar story…
What if the next move is simply history repeating itself?
 Long
Long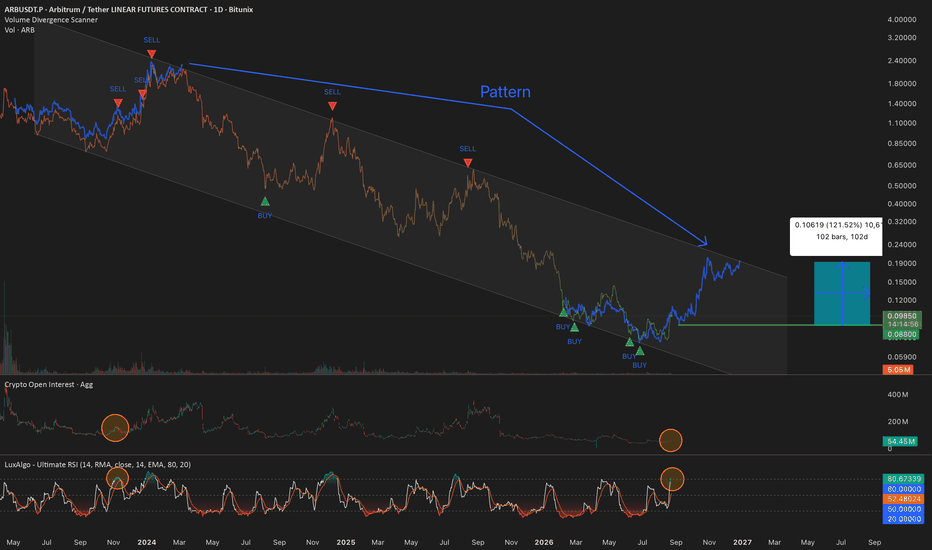
Long 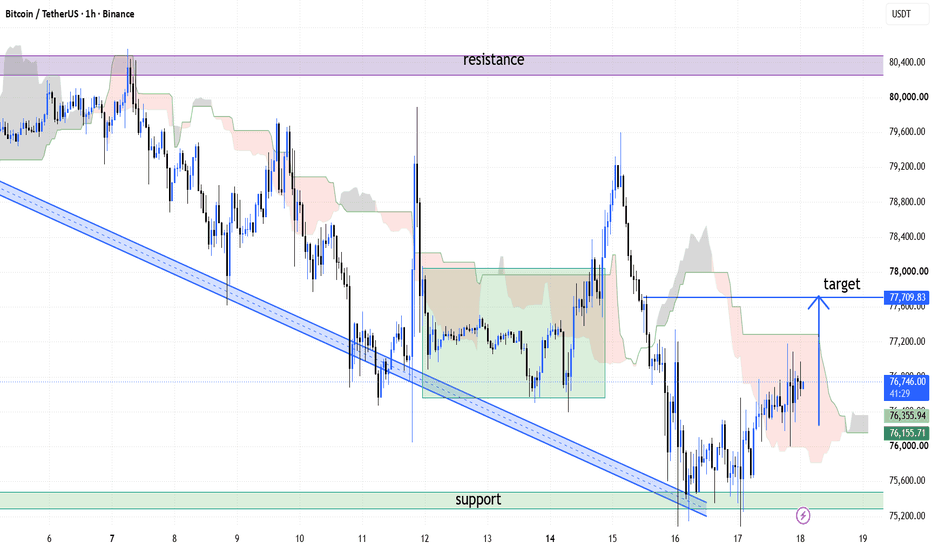
OTHERS - ALL altcoins (excluded top 10) 3d timeframe So, hello everyone who’s still here and to those dropping by looking for ideas)
I previously did an analysis of this same idea on the **weekly chart**, but now I decided to come back to it and take a more detailed look using a lower timeframe. I think it’s time to add a few clarifications and take a deeper look at the current structure.
Overall, we can see a **global ascending channel** and a **local descending channel**. At the moment, within the global channel, we’re mainly interested in its **midline — the zone of uncertainty — and the bottom**. There’s no point talking about the highs yet. We’ll be able to consider them no earlier than after New Year, and only once the price has broken through the middle of the global channel.
Right now, we can see that price has reached the top of the descending channel. Considering this is already the third attempt, as we can see on the chart, I doubt we’ll break through it immediately.
The market maker needs to keep everyone in uncertainty for as long as possible and wait until enough liquidity builds up on both sides.
So, what do we have right now?
A **W-pattern — double bottom** — has formed, with targets extending beyond the boundaries of the descending channel. That’s a bullish signal and potentially the beginning of the long-awaited bull market.
We can also see what looks like a **Bullish Pennant** forming. The boundary of this pattern could essentially become a retest of our W-pattern. At this point, these patterns can be redrawn in a hundred different ways — that’s not the important part.
What matters right now is that **the market is pointing upward**.
The indicators are currently overheated, which creates a strong temptation for traders to start shorting. But I wouldn’t rush into it, unless you want to become liquidity and fuel for the next move.
And one more thing to keep in mind:
**Indicators can cool down through sideways price action.**
The price doesn’t necessarily have to dump to the bottom just to push indicators into oversold territory. The market can simply move sideways while the indicators gradually “cool off.”
Keep that in mind.
**DYOR and all the other trendy words.**
HYPEUSDT Breaks the High Again - Is $107 Still in Play?Hyperliquid has developed into a Layer 1 ecosystem focused heavily on on-chain trading, with HyperCore powering its core trading infrastructure and HyperEVM expanding its broader ecosystem. HYPE is the native token of the Hyperliquid network.
A while ago, I shared a technical analysis of #HYPEUSDT, and so far, the price action has been following the scenario I discussed.
HYPE has now broken above its previous high once again. In my previous analysis, I identified a Cup & Handle pattern and projected a potential target around $107.
So, what's next?
For those who missed the breakout, I would be watching the previous broken resistance for a potential pullback. If that level turns into support, it could provide an interesting area to watch for the continuation of the move.
Another point worth noting: RSI on the Daily timeframe is still below 70, meaning it has not yet entered the traditionally overbought zone.
Suggested maximum leverage:
Daily: 2x
4H: 4x
1H: 1x
This is a technical analysis, not financial advice. Manage your risk and avoid excessive leverage.
Trade smart, stay disciplined, and keep learning.
Profitable trades and all the best! 📈  Long
Long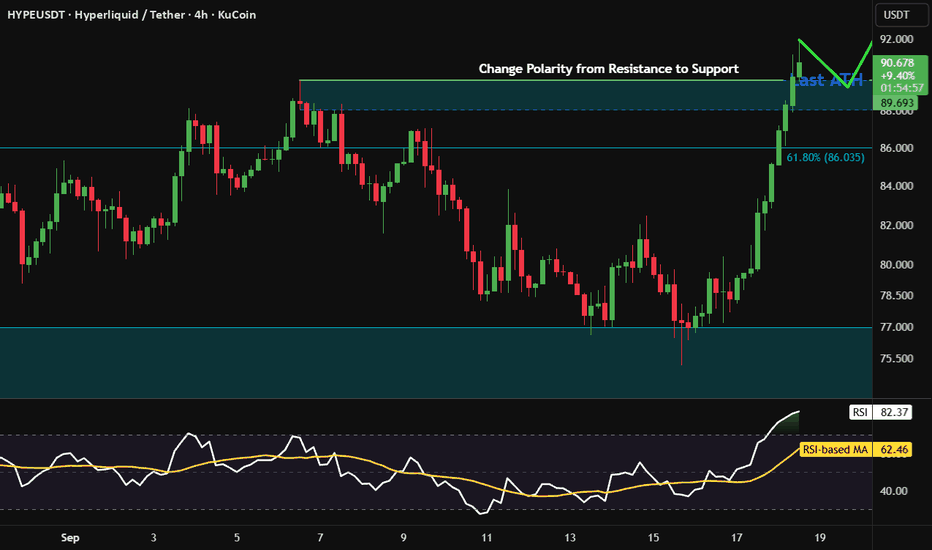
ETH | 4H — Range Resistance Under Pressure: Now or NeverEthereum has been trading inside a clearly defined range, with **$2,388** acting as the major support and **$2,532–$2,540** serving as the key resistance area.
After repeatedly testing the upper boundary and being rejected, price has once again returned to this level. The latest move shows **strong bullish momentum**, with ETH currently pushing slightly above the range resistance.
However, the important question is not simply whether price trades above $2,532 — it is whether buyers can **secure acceptance above the range**.
**🟢 Bullish Scenario:**
A strong 4H close above **$2,532–$2,540**, followed by sustained trading above the level, would provide stronger confirmation that the range is breaking to the upside. In that case, the former resistance could potentially become new support.
**🔴 Bearish Scenario:**
If price fails to hold above the resistance and produces a strong rejection, the move could develop into a **false breakout**, bringing price back toward the range midpoint and potentially **$2,388 support**.
**📌 Price Action Perspective:**
This is a classic **decision point**. After multiple interactions with the same resistance, I’m more interested in how price behaves *after* the breakout than in the breakout itself.
**Breakout + acceptance = confirmation.**
**Breakout + rejection = potential liquidity grab.**
The next few 4H candles should reveal which side is actually taking control.
#UncleHamid #ETH #ETHUSD #Ethereum #CryptoTrading #PriceAction #TechnicalAnalysis #MarketStructure #SupplyAndDemand #TradingView
 Short
Short
 Short
Short
Short 
Bitcoin's point of control sits at 78,162 and the push stoppedBITSTAMP:BTCUSD — US session read from my KenKem Master Volume Profile (MVP) indicator & strategy.
CONTEXT
Price is trading around 78,020, above VWAP at 77,553 and above every M15 moving average, and it has accepted well above the wider master value area. The near-term picture is softer than the structure: the value-area high at 78,396 was tagged and sold, price has slipped back under the fast M5 average, and the net-volume read is buy-side on the M15 window but sell-side on the M5 window, on thin participation into the US open. That split is the whole story here: an uptrend taking a breath, not a turn.
KEY ZONES
• Resistance / supply: 78,162 (point of control), then 78,396 (value-area high)
• Support / demand: 77,871, then 77,555 (value-area low, sitting on VWAP)
• Point of Control (volume magnet): 78,162
• Wider master value-area high beneath the market: 77,417
SCENARIOS (to watch - NOT signals)
📈 Bullish: reclaim 78,162 on a closing basis and 78,396 comes back into play (the point of control is the only supply between price and the high).
📉 Bearish: lose 77,871 and 77,555 becomes the magnet, where the value-area low and VWAP sit on top of each other.
↔️ Range/unclear: stuck between 77,871 and 78,162 into the session open, stand aside until a decisive close picks a side.
⛔ Invalidation: a close below 77,555 voids this map and opens the 77,417 master value-area high.
WHAT THE MVP TOOL IS SHOWING
The Master Volume Profile plots rolling value areas (VAH/VAL), the Point of Control, and a net-volume pressure read to locate where volume is building or drying up. Here it is flagging the point of control overhead as still defended by buyers, which is why the first touch matters more than the level itself. This idea is the qualitative output of that tool; the strategy's internal thresholds, gating and entry/exit logic are not disclosed.
Built with the KenKem Master Volume Profile indicator & strategy.
Technical analysis only, by KenKem's algorithm - NOT financial advice. Trade your own plan and manage your risk.
Long 
 Long
Long
 Long
Long
 Short
Short
Bitcoin Rises — But Bulls Still Have Work to DoShort-Term Recovery Continues
Bitcoin continues its short-term recovery after dropping below $75,000, with price now pushing back towards its recent lower highs.
Medium-Term Structure Still Down
The bigger picture hasn't really changed for me. Bitcoin continues to produce a series of lower highs and lower lows from the $82,300 peak.
0.618 Fib Comes Into Play
Price is now approaching the 0.618 Fib around $77,830. This could provide the first real test of the strength behind the latest move higher.
Volume Fading on the Rise
Volume has been decreasing as Bitcoin moves higher, which is something to watch. If buyers are serious about extending this recovery, I would like to see buying volume begin to pick up.
Moving Averages Remain Unconvincing
The 100/50-period EMAs have recently crossed bullishly, but both averages have flattened and are contracting again. This reflects the uncertainty still surrounding the medium-term trend.
Bulls Still Have Two Big Tests
A break above $80,000 would give Bitcoin a bullish change of character and improve the medium-term structure. For me, however, the bigger structural test remains the significant $82,300 high.
In Summary
Bitcoin continues to recover from below $75,000, but the broader 4-hour structure remains a series of lower highs and lower lows. Price is approaching the 0.618 Fib around $77,830 while volume fades on the rise, so buyers still have something to prove. A break above $80,000 would give Bitcoin a bullish change of character, but the more significant structural test remains the $82,300 high. Bitcoin price says one thing, time says anotherBitcoin: price says one thing, time says another
I have said this many times.
Bitcoin is not like any other asset.
The reason is simple. Every four years the halving cuts the new supply in half. That single rule gives Bitcoin something no stock has, a clock. And when you put the halvings on the chart, the cycles are easy to see.
I measure each cycle from its top, in weeks, not in dollars.
In the three completed cycles we have (2014, 2018 and 2022), the correction phase lasted about 60 weeks each time. Three cases is a small sample, I know. But three out of three is not nothing.
Now look at where we are. The low of this cycle, for now, sits at week 40. We are at week 50 today.
But so many people said the low is in, the correction is over. Maybe. But a low at week 40 would be the earliest of any cycle so far, by a wide margin. History says this phase is not usually finished by now. So the time window I watch runs about ten more weeks. Not a target. A clock.
Let me tell you what I do with this. In the past cycles, this part of the clock was where the risk was smallest compared to the reward . Price was already far below the top, and time was running out for the sellers. That is where I did my buying. I cannot tell you where price goes from here. Nobody can. What I can tell you is that the poker player does not play every hand. He waits for the moment when the odds are on his side, and this is the moment the clock points at.
Most people only look at price. But the market has two axes, and the horizontal one counts too. Long 
Education 
APE Bulls Running Out of Time?Yello, Paradisers! Are #APEUSDT bulls about to get trapped right below a major resistance zone before the market delivers the pullback most traders are not prepared for?
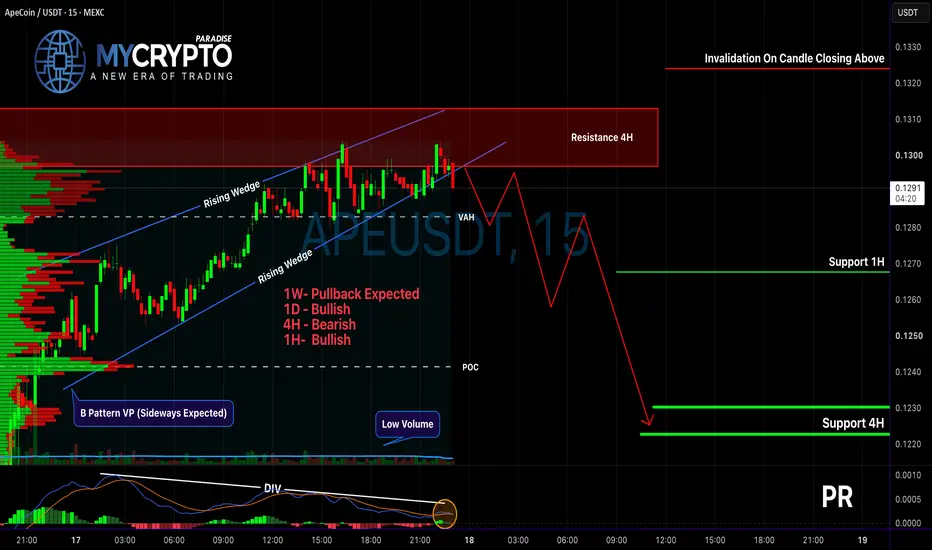
💎#APEUSDT is currently trading around $0.1296 after pushing directly into an important 4H resistance area around $0.1297-$0.1313. At the same time, the price continues to respect a rising wedge structure on the 15-minute timeframe, which puts the market in a very sensitive position.
💎The short-term structure remains bullish while #APE holds the lower boundary of this wedge. However, the bigger picture is much less straightforward. Our 1D structure remains bullish, while the 4H structure is bearish, and on the 1W timeframe we are still expecting a pullback. This timeframe conflict is exactly why aggressively chasing the current move would carry unnecessary risk.
💎Another important factor is volume. The latest upside movement has developed on relatively low volume while APE is approaching resistance. This tells us that buyers have pushed the price higher, but the move is not showing particularly strong participation. We can also see weakening momentum around the highs, adding further caution while the price trades directly underneath resistance.
💎The volume profile strengthens this scenario. APE is currently trading above the Value Area High around $0.1282, while the Point of Control sits considerably lower around $0.1241. When price stretches above an important value area without strong continuation volume, a rotation back toward lower liquidity levels can become increasingly relevant.
💎As long as APE remains underneath the 4H resistance zone, we are watching for the possibility of rejection and a breakdown from the rising wedge. The first important downside area is the 1H support around $0.1268. If sellers manage to break that level with confirmation, attention can shift toward the major support and liquidity area around $0.1223-$0.1230.
💎However, we are not blindly bearish. A confirmed candle close above approximately $0.1324 would invalidate this bearish scenario and show that buyers have successfully absorbed the resistance.
💎This is exactly the type of market structure where patience becomes more valuable than prediction. APE is sitting between short-term bullish momentum and higher-timeframe resistance, meaning the next confirmed breakout or breakdown can provide much cleaner information than trying to anticipate every small move inside the current range.
Strive for consistency, not quick profits. Treat the market as a businessman, not as a gambler. Wait for confirmation, respect invalidation, and protect your capital because disciplined execution is what keeps traders inside the winner circle.
MyCryptoParadise
iFeel the success🌴  Short
Short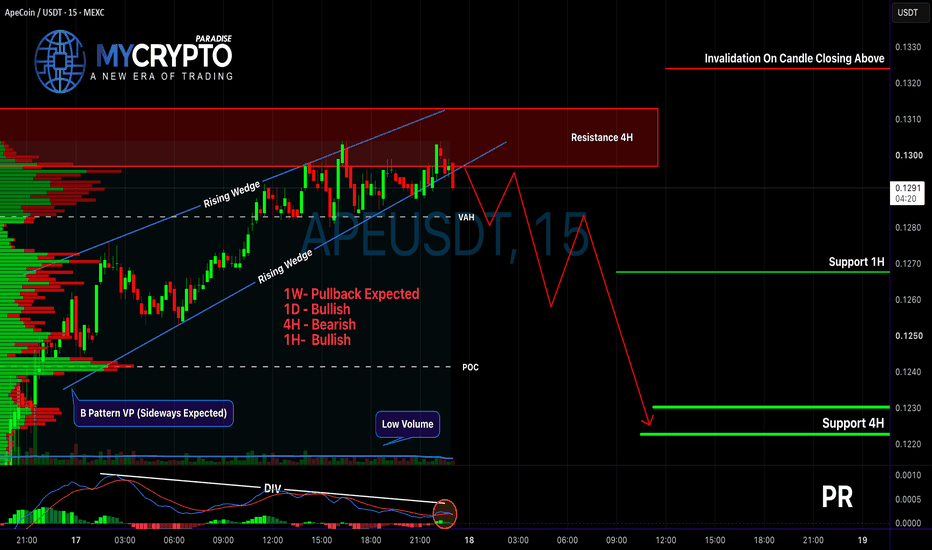
silverusdt longInstructions:
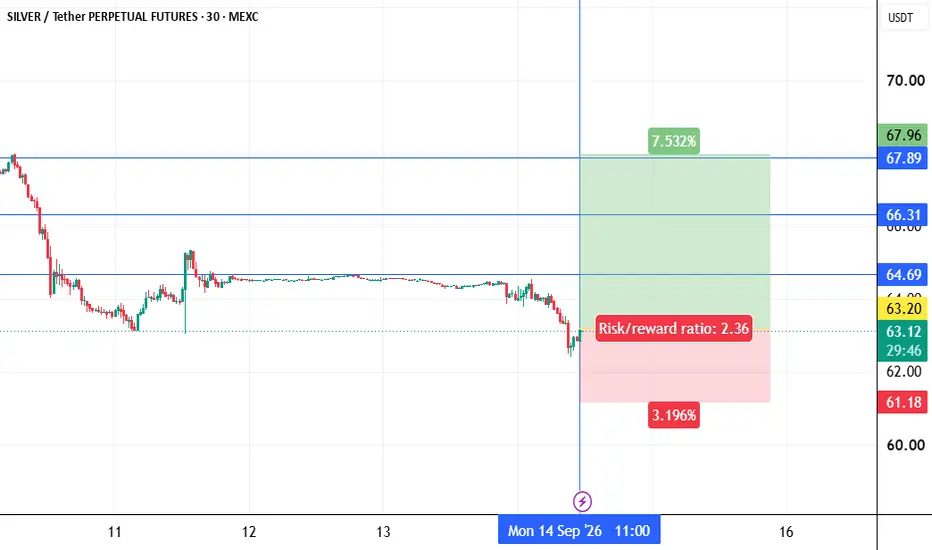
Entry point: yellow
Stop loss: red
Take profit: green or blue
👉Leverage x 5-10-20 for crypto
👉Leverage x 20-50-100 for commodities, stocks, indices, and forex
👉Margin 1-5% max.
Always practice risk and money management.
Invest a maximum of 5% on any trade or across all your trades.
Invest only what you can afford to lose, as no one is in control of the market.
👉Our analyses are primarily based on:
breakouts: two trend lines (ascending and descending) and a line indicating a horizontal breakout.
chart patterns: shoulders and head, triangle parttern, elliott impulse, etc etc.
We don't always have the time to track them at all times or to represent them visibly, given the numerous signals, the number of channels to manage, and especially because of the often rapid pace of market movements.
indicators: We associate at least two indicators with this technique.
👉Depending on the circumstances, we use specific indicators, often setting 3 or more take profit levels.
👉Indeed, there are good days in trading and also bad days. No one can promise to win every trade, and like all traders worldwide, we also experience stop-loss orders. However, we win more than we lose and remain positive.
👉You can close the position before or after the take profit orders indicated by the green lines if you are personally satisfied; the same applies to stop loss orders.
👉We must stay positive, clear-headed, and humble.
we cannot provide all instructions or all trades here on this channel.
Good luck to us all, and may God guide us. Amen.