Long
Long
 Long
Long
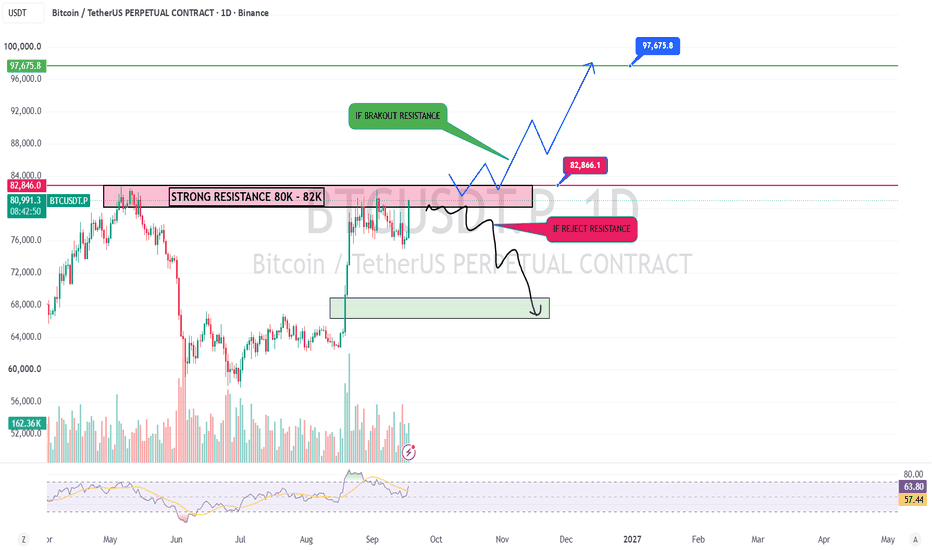
BTCUSDT: Breakout Wave, Bulls Head Up!BTCUSDT is trading around 76,740 USDT, maintaining the 75,000–76,500 support zone on the 8-hour (H8) chart. Although the price remains within a descending channel, buying interest near the EMA89 (around 75,900) indicates that sellers have been unable to extend the downward move.
The 78,000–79,000 zone currently acts as a critical hurdle. If BTC holds the "Buy Zone," breaks out of the channel's upper boundary, and reclaims this area, I lean towards a scenario where the price returns to the 80,000–82,000 range before extending toward the primary target near 84,400 USDT.
The macroeconomic backdrop supports a recovery, as the 10-year Treasury yield has eased to approximately 4.94%, Brent crude prices have fallen, and US/Asian stock markets have rebounded, helping to stabilize "risk-on" sentiment.
The bullish scenario would be invalidated if BTC decisively loses the 75,000–75,500 zone.  Long
Long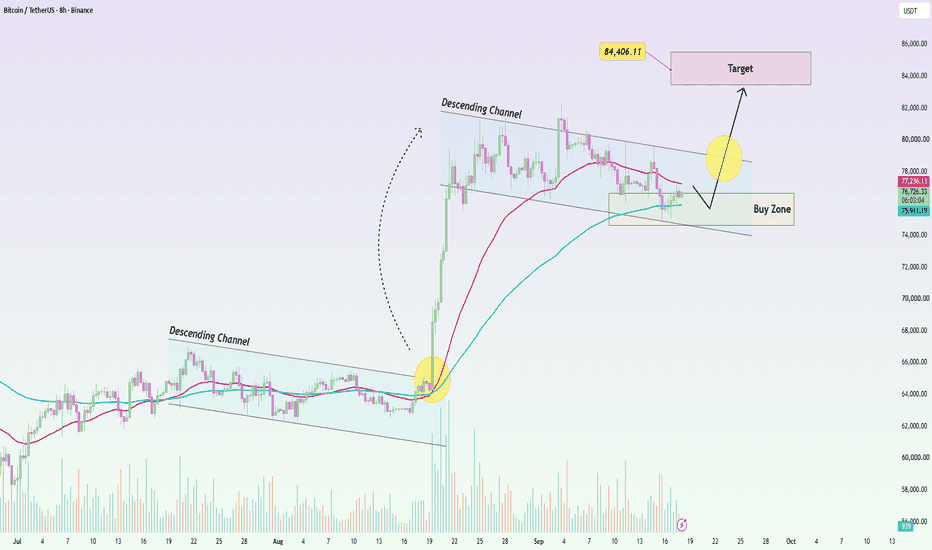
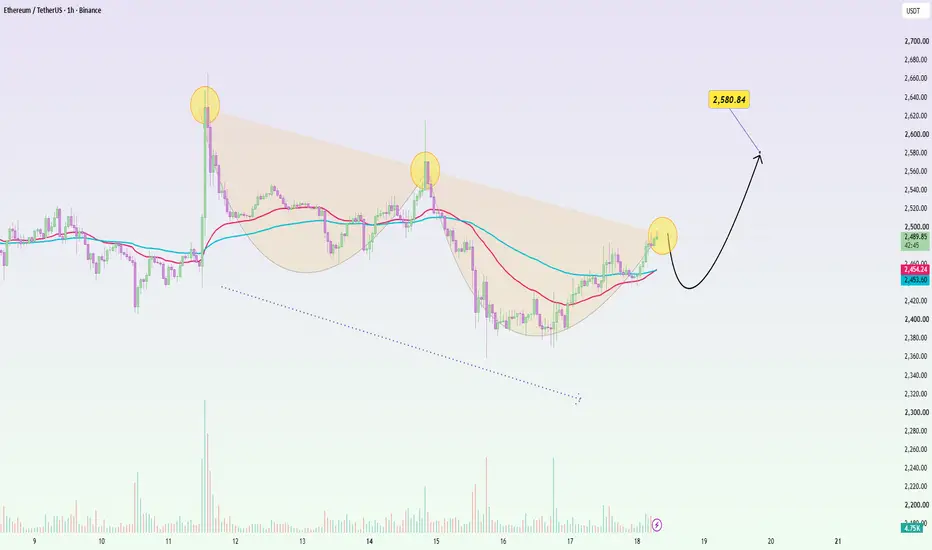
ETHUSDT: Bottom Structure, Recovery PhaseETHUSDT is trading around 2,492 USDT following a strong recovery from the 2,380–2,400 zone. The price has now reclaimed both the EMA34 and EMA89 (around 2,454), while the short-term structure is forming a distinct rounded bottom.
The 2,450–2,470 range is the area I am watching should a pullback occur. If the price holds above the EMA cluster and establishes a "higher low" here, the likelihood of breaking out past the 2,500–2,520 zone increases. In that event, the next target could extend to 2,550, followed by the key level around 2,580 USDT.
Macro factors today are providing mild support for this recovery: the 10-year Treasury yield has eased to approximately 4.94%, oil prices continue to fall, and the Nasdaq has risen nearly 1.7%, helping to improve risk-on sentiment.
The bullish scenario would weaken if ETH loses the 2,440–2,450 zone.
Will ETH retest the EMA cluster before continuing toward 2,580? Long 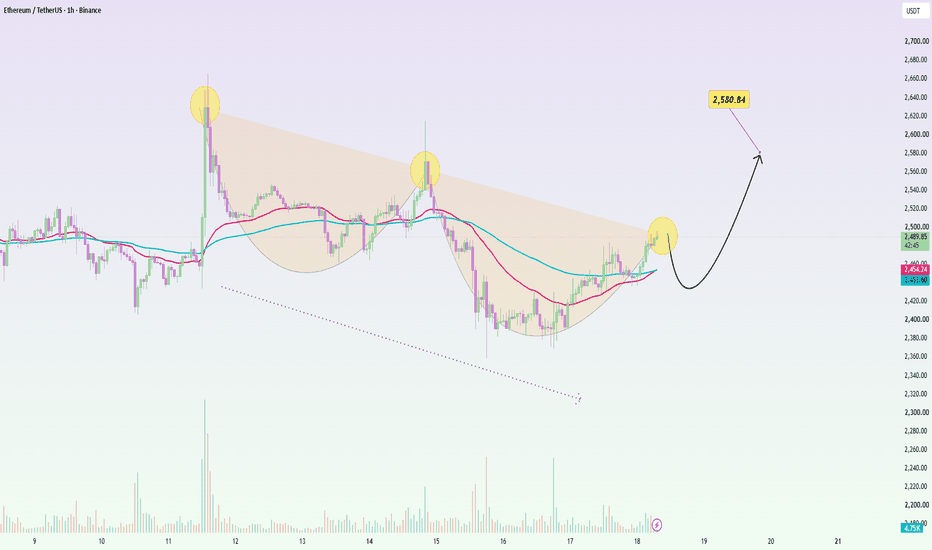
 Long
Long
 Long
Long
 Long
Long
 Long
Long
 Long
Long

Long 
 Long
Long
BEAMX Descending Trendline, Breakout or Rejection?📊 Technical Analysis
💵 Pair: BEAMX/USDT
⏳ Time Frame: 4D
📉 Pattern: Descending Trendline
📍 Condition: Price is still under pressure from the descending trendline.
The chart shows a Descending Trendline formed by a series of lower highs since the peak around 0.041090 USDT. The yellow trendline has repeatedly acted as dynamic resistance and kept the overall price structure bearish.
However, price has now moved closer to the lower section of the trendline and is beginning to show a consolidation phase. This makes the trendline increasingly important because a breakout could potentially signal a significant structural change.
---
📉🔻 Descending Trendline Structure
🔸 Dynamic Resistance: The yellow trendline is the main barrier preventing further upside.
🔸 Lower Highs: Previous rebounds have generally failed to form higher highs, meaning the bearish structure remains visible.
🔸 Consolidation: Recent price movement appears narrower than the previous decline, indicating a temporary balance between buyers and sellers.
🔸 Breakout Pressure: The closer price gets to the trendline, the more important the 4D candle reaction to this resistance becomes.
---
🟢📈 Bullish Scenario — Descending Trendline Breakout
If BEAMX manages to break through and achieve a valid 4D close above the Descending Trendline, the long-term bearish structure could receive an initial reversal confirmation.
🎯 Resistance Target 1: 0.002078 USDT
🎯 Resistance Target 2: 0.002621 USDT
🎯 Resistance Target 3: 0.003132 USDT
🎯 Resistance Target 4: 0.004612 USDT
🎯 Resistance Target 5: 0.009113 USDT
📈 After the breakout, the trendline that previously acted as resistance could potentially turn into support if a retest occurs and buyers are able to defend it.
🔥 If breakout momentum becomes stronger, the higher resistance levels could become the next areas of interest.
⚠️ Bullish confirmation should not be based solely on a breakout wick. A 4D candle close above the trendline followed by a successful retest would provide stronger structural confirmation.
---
🔴📉 Bearish Scenario — Trendline Rejection
If price receives a strong rejection from the Descending Trendline, the bearish structure remains valid.
🔻 Failure to break out could cause price to return toward the nearest support area.
📉 If support fails to hold, selling pressure could continue toward the previous low area.
🧱 Major Support: Around 0.001211 USDT.
⚠️ As long as price has not successfully broken and maintained a position above the trendline, the Descending Trendline remains the main resistance.
---
🔎 Key Areas to Watch
🟡 0.002078 — Initial resistance
🟡 0.002621 — Next resistance
🟡 0.003132 — Important resistance
🟡 0.004612 — Major resistance
🟡 0.009113 — Long-term resistance
🔵 0.001839 — Price area shown on the chart
🔴 0.001211 — Major low/support
---
🧠 Conclusion
📉 BEAMX/USDT remains within a long-term Descending Trendline structure.
However, the price moving increasingly close to the trendline makes the reaction to this resistance extremely important.
🟢 Breakout + 4D close above the trendline → Opens the possibility of a bullish structure and a test of resistance at 0.002078 → 0.002621 → 0.003132 → 0.004612 → 0.009113.
🔴 Rejection + support breakdown → Maintains the bearish structure and opens the possibility of a retest of the previous low.
🎯 The key level on this chart is the Descending Trendline. The next move will largely depend on whether buyers can break through the dynamic resistance or sellers manage to defend it again.
#BEAMX #BEAMXUSDT #Crypto  Long
Long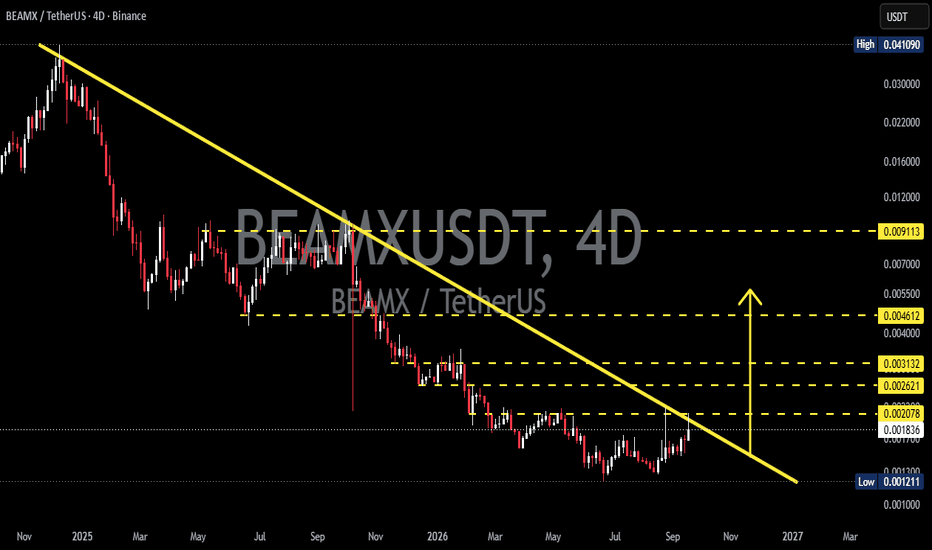
Long 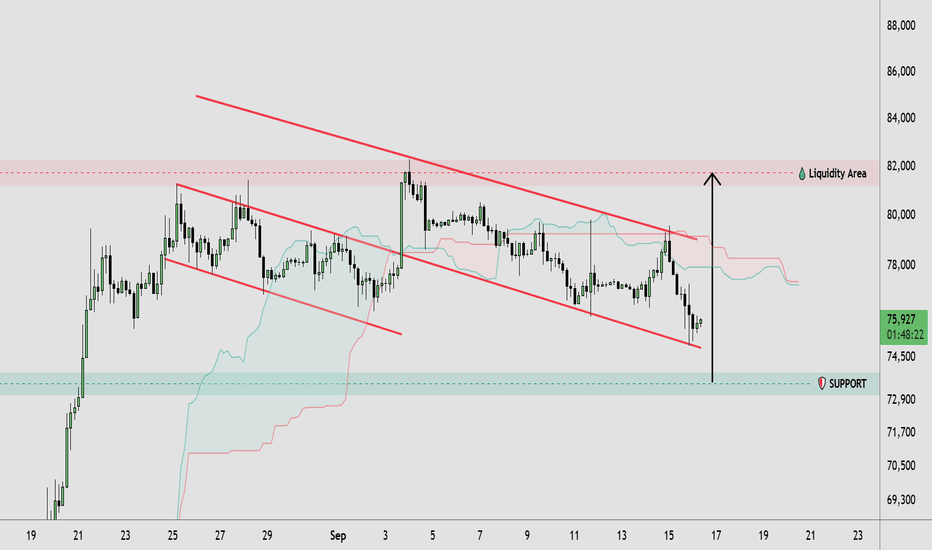
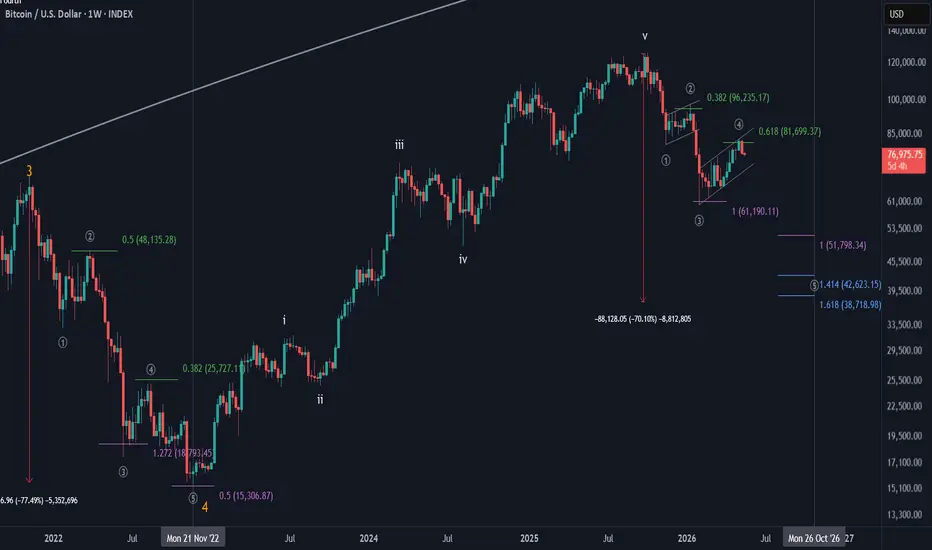
How much more Bitcoin can go down?How much more Bitcoin can go down?
This is a billion-dollar question. To answer it, a simple look at the previous correction phase can shed some light to the unknown future. Let’s dig in.
As can be seen in the chart, waves 2 and 4 in the previous correction phase retraced up to the 0.5 and 0.382 Fib levels, respectively. Interestingly, the waves 3 and 5 went down to the 1.272 and 0.5 Fib extension levels, respectively. This means the wave 3, which was the extended wave among waves 1, 3 and 5, had a deeper correction (wave 2) before going down. On the other hand, the weaker correction (wave 4) led to wave 5 going down only to the 0.5 Fib extension level.
Now, let’s see how the current correction phase has behaved so far. It can be seen that the wave 2 retraced up to the 0.382 Fib level; a weak retracement. Consequently, wave 3 went down to the Fib extension level equal to the wave 1. That means, in this scenario, the wave 3 is not the extended wave. On the other hand, wave 4 retraced up to the 0.618 Fib level; a strong retracement. This can only mean that wave 5 could be the extended wave and go down much more than wave 3 has went; at least to the Fib extension level 1. Therefore, guessing that wave 5 could go down to the area around 1.414 and 1.618 Fib extension levels is not farfetched. Let's see what happens.
Short 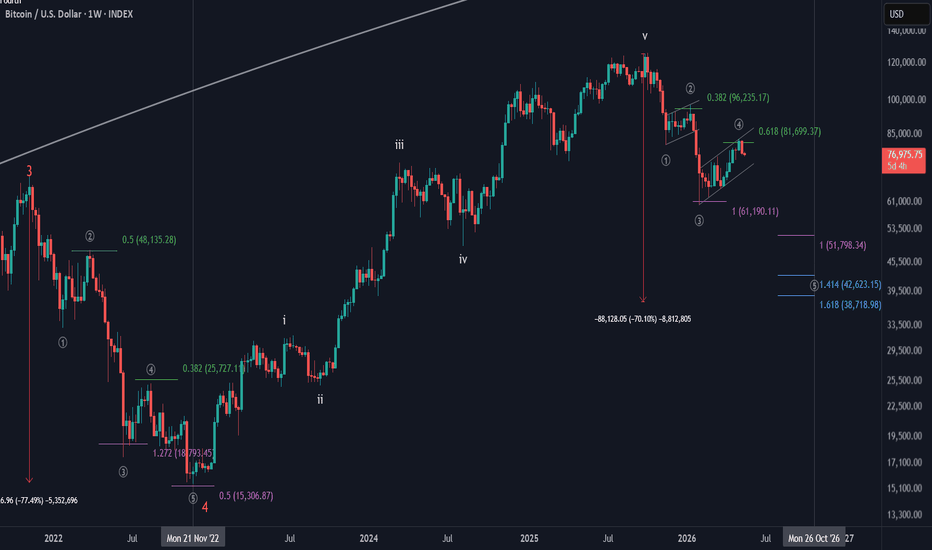
Hyperliquid (HYPE): Is Another Major Cycle Still Ahead?Hyperliquid is one of the few crypto projects where I believe the technical structure and the underlying protocol economics are worth studying together.
On the daily logarithmic chart, HYPE appears to be moving inside a clearly defined long-term ascending channel.
The structure has respected this channel through multiple major market phases, and the current price action is again approaching the upper half of that structure.
I will also publish the same chart in regular scale, because I don't want the logarithmic view alone to influence the interpretation.
HYPE / BTC Daily TimeFrem TA..! Link
Could NASDAQ:PURR Hyperliquid be entering another multi-month bullish cycle?
There is no guarantee that such a cycle exists.
The market may simply be forming another temporary expansion before a deeper correction.
But if another major cycle is developing, the potential upside becomes considerably more interesting.
The Technical Structure
On the logarithmic daily chart, HYPE has formed a relatively clear ascending channel over the longer term.
The previous major correction respected the lower portion of this structure, followed by a strong recovery and a breakout from the intermediate bearish structure.
The current price is around the $89 area, while the broader structure suggests that the market could potentially develop another long-term expansion.
My main accumulation area is:
$76 – $63
This is the zone I would be much more interested in for building exposure rather than chasing vertical candles.
Key levels
Accumulation Zone: $76 – $63
Invalidation: $54
Normal Cycle Target: ~$160
Major Cycle Target: ~$210
The $54 level is important because a sustained move below this area would significantly damage the long-term structure I'm watching.
The Cycle Scenario
If another major bullish cycle develops, I would consider $160 a relatively normal extension for HYPE rather than an extreme target.
The more ambitious objective is around: $210
But I don't expect the market to move there in a straight line.
Crypto cycles rarely work that way.
There can be violent corrections, extended consolidations, liquidity sweeps and periods where the market makes traders question the entire thesis.
That is precisely why I would rather define the structure now than try to predict every short-term move.
Why Hyperliquid Is Fundamentally Interesting
The biggest strength of Hyperliquid is that it is not simply another token trying to create a narrative around an ecosystem.
It has a functioning financial infrastructure underneath it.
CRYPTO:HYPEHUSD Hyperliquid has developed an on-chain trading ecosystem centered around perpetual futures and spot markets, while expanding into HyperEVM and additional financial applications.
Its economic activity is also significant.
DefiLlama currently reports roughly $6.8B TVL, around $71M in fees over the last 30 days, more than $55M in 30-day revenue, and cumulative fees above $1.5B.
More importantly, the protocol has created a mechanism that directly connects trading activity with HYPE demand.
According to Hyperliquid's documentation, trading fees are directed to the Assistance Fund, which automatically converts fees into HYPE and burns the acquired tokens.
That creates an interesting economic loop: More trading activity → more fees → HYPE purchases → HYPE removed from supply
This is fundamentally different from a token whose value depends almost entirely on speculation.
HYPE Utility & Ecosystem
HYPE is deeply integrated into the Hyperliquid ecosystem.
It is used for:
Network security and staking
HyperEVM gas
Governance
Trading-fee discounts
DeFi collateral
Ecosystem participation
Hyperliquid's own documentation describes the network as infrastructure on which independent applications, wallets, trading interfaces and other financial products can be built.
It also reports more than $1B in annualized fees being directed toward programmatic HYPE buybacks and more than $45M generated by independent builders through builder codes.
That matters because the long-term value of HYPE ultimately depends on something much bigger than the token itself:
How large can the Hyperliquid financial ecosystem become?
If Hyperliquid continues capturing trading activity, liquidity, developers and financial applications, HYPE has a stronger fundamental foundation than a token whose only use case is speculation.
The Positive Side
There are several things I consider structurally attractive:
1. Real product-market fit
Hyperliquid is already processing substantial trading activity rather than waiting for future adoption.
2. Strong liquidity infrastructure
The protocol has positioned itself as infrastructure for on-chain financial applications, not merely a perpetual exchange.
3. Token utility
HYPE has actual functions across the network: staking, gas, governance, fee discounts and DeFi.
4. Fee-driven buybacks
The Assistance Fund creates systematic HYPE demand from protocol activity.
5. Deflationary mechanics
HYPE acquired through the Assistance Fund is burned, while HyperEVM transaction fees also have burn mechanics.
But There Are Risks
This is where I would be careful.
A strong protocol does not automatically mean the token must go higher.
Hyperliquid still faces:
Regulatory uncertainty
Competition from centralized and decentralized exchanges
Dependence on sustained trading activity
Smart-contract and infrastructure risks
Ecosystem competition
Token unlock/emission pressure
Extreme crypto-market volatility
And perhaps the most important risk: Valuation.
A great project can still become overpriced.
If the market prices several years of future growth into HYPE too quickly, the token can experience a very deep correction even while the underlying protocol continues developing.
So I don't want to confuse:
“I like Hyperliquid fundamentally” with “HYPE can only go up.”
Those are completely different statements.
My Long-Term Plan
I am not interested in chasing HYPE simply because the chart is already moving.
The area I would prefer to watch is: $76 – $63
If price revisits this region and the long-term structure remains healthy, I would consider it a much more interesting risk/reward location.
Invalidation: $54
If the broader cycle develops as expected, the first major objective is:
$160
And the larger cycle objective is:
$210
However, I don't plan to sit through an entire potential cycle without taking profit.
If HYPE eventually reaches the $155–$180 region, I will be watching for a very large expansion candle accompanied by extreme market optimism.
Because that is usually when the psychology changes.
Everyone starts talking about the asset.
Everyone expects another leg higher.
FOMO becomes dominant.
And unfortunately, that is often when liquidity becomes most attractive to larger sellers.
My preference would be to use that type of environment to take profit and look for the next opportunity, rather than becoming emotionally attached to a target.
Final View
I consider HYPE one of the more interesting long-term structures in the market, both technically and fundamentally.
But this is not a quick-profit setup.
The thesis requires patience.
The cycle I'm describing could take several months — or it may never happen.
The market can prove this entire thesis wrong.
For me, the important levels remain simple:
$76–63 → accumulation area
$54 → long-term invalidation
$160 → normal cycle objective
$210 → major cycle objective
I would rather wait for the market to come to my levels than chase it at any price.
And if the market eventually reaches $155–180 with extreme FOMO, I would rather be the person selling into that enthusiasm than the person buying it.
This is an educational market analysis, not financial advice or a guarantee of future performance. Crypto assets are highly volatile and can result in substantial losses. Always define your risk and position size accordingly.  Long
Long
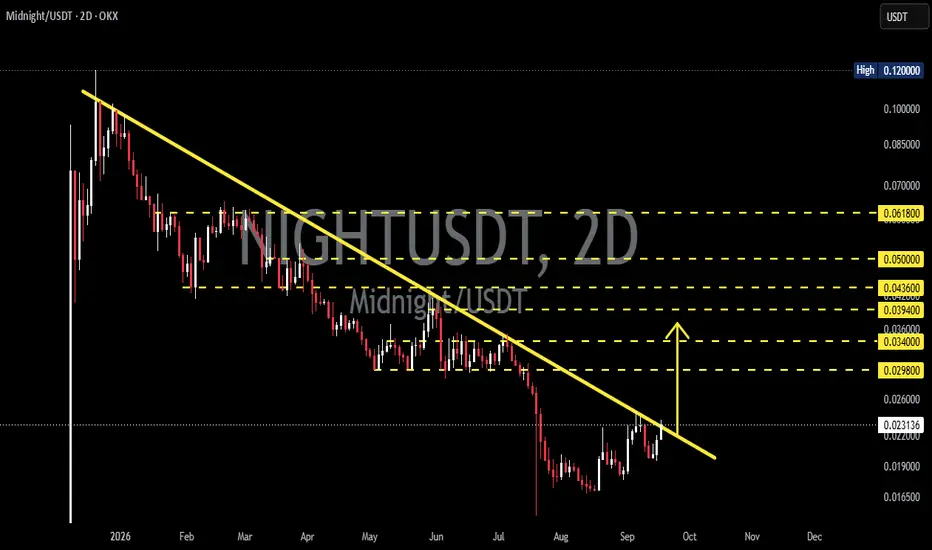
NIGHT at a Critical Resistance — Breakout or Rejection?$NIGHT chart on the 2D timeframe shows a price structure that remains within a downtrend. Since the peak around $0.10–$0.11, price has formed a series of lower highs, which are connected by the yellow Descending TrendLine.
Currently, price is trading around $0.0231 and is approaching the Descending TrendLine, making this an important area to determine whether price can break out or face another rejection.
---
📐 Pattern: Descending TrendLine
🔻 A Descending TrendLine is formed by connecting multiple lower highs during a downtrend.
📉 As long as price remains below the trendline, the technical market structure continues to indicate bearish pressure.
📐 This trendline acts as a dynamic resistance. The more frequently price tests the trendline without successfully breaking above it, the more significant the level becomes in determining the next potential direction.
📌 However, the trendline is not an absolute resistance. Candle-close confirmation and volume are still important to validate a breakout.
---
🟢 Bullish Scenario — Breakout
🚀 The bullish scenario begins to gain confirmation if MIDNIGHT successfully breaks above the Descending TrendLine and closes above it.
📈 Such a breakout could indicate that selling pressure from the trendline is weakening and that the price structure may begin entering a recovery / potential trend-reversal phase.
🎯 If the breakout is confirmed, the next horizontal resistance levels to watch are:
🎯 $0.0298
🎯 $0.0340
🎯 $0.0394
🎯 $0.0436
🎯 $0.0500
🎯 $0.0618
🔥 The $0.0298–$0.0340 area is an important zone to monitor to determine whether the breakout can develop into stronger bullish momentum.
---
🔴 Bearish Scenario — Rejection
⚠️ If price is rejected again by the Descending TrendLine, the bearish structure remains valid.
📉 A rejection from the trendline could indicate that sellers are still defending this dynamic resistance.
🔻 If price subsequently loses the nearby support area and forms another lower low, bearish pressure could continue.
💥 In that scenario, the previous low area around $0.0165–$0.0190 becomes an important zone to monitor on the chart.
---
🧭 Current Market Structure
🔴 Trend: Bearish / Downtrend
📉 Structure: Lower Highs & Lower Lows
📐 Dynamic Resistance: Descending TrendLine
⚔️ Critical Zone: Around $0.023–$0.024
🟢 Bullish Confirmation: Break & close above the trendline
🔴 Bearish Confirmation: Rejection + support breakdown
🎯 Upside Levels: $0.0298 → $0.0340 → $0.0394 → $0.0436 → $0.0500 → $0.0618
📝 Conclusion
MIDNIGHT is currently approaching an important decision point, as price is testing the Descending TrendLine that has been pressuring the price for several months.
🚀 A breakout and close above the trendline could provide an early indication of a structural shift and open the possibility of a move toward the next resistance levels.
🔻 On the other hand, a rejection from the trendline would keep the bearish structure intact and bring the previous low area back into focus.
⏳ Since the chart uses the 2D timeframe, candle-close confirmation carries greater significance than simply relying on an intraday wick or temporary breakout.
#MIDNIGHT #MIDNIGHTUSDT #Crypto  Long
Long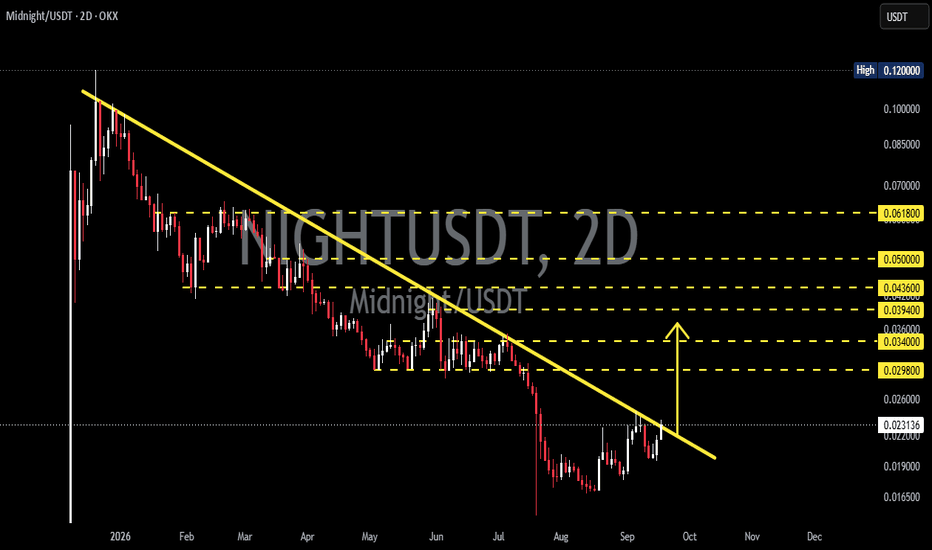
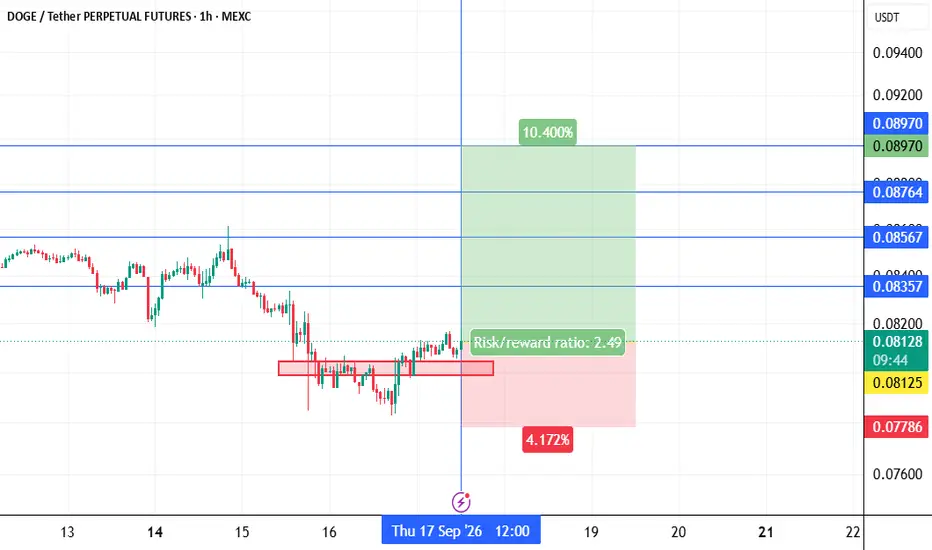
dogeusdt long Roddy01-SIGNALSPROVIDERInstructions:
Entry point: yellow
Stop loss: red
Take profit: green or blue
👉Leverage x 5-10-20 for crypto
👉Leverage x 20-50-100 for commodities, stocks, indices, and forex
👉Margin 1-5% max.
Always practice risk and money management.
Invest a maximum of 5% on any trade or across all your trades.
Invest only what you can afford to lose, as no one is in control of the market.
👉Our analyses are primarily based on:
breakouts: two trend lines (ascending and descending) and a line indicating a horizontal breakout.
chart patterns: shoulders and head, triangle parttern, elliott impulse, etc etc.
We don't always have the time to track them at all times or to represent them visibly, given the numerous signals, the number of channels to manage, and especially because of the often rapid pace of market movements.
indicators: We associate at least two indicators with this technique.
👉Depending on the circumstances, we use specific indicators, often setting 3 or more take profit levels.
👉Indeed, there are good days in trading and also bad days. No one can promise to win every trade, and like all traders worldwide, we also experience stop-loss orders. However, we win more than we lose and remain positive.
👉You can close the position before or after the take profit orders indicated by the green lines if you are personally satisfied; the same applies to stop loss orders.
👉We must stay positive, clear-headed, and humble.
We must stay courageous and, above all, prudent regarding market reversals that no one can control
👉we cannot provide all instructions or all trades here on this channel.
such as:
⚡Move your stoploss
⚡Put B.E (break even)
⚡re-entering the trade at the same entry point or lower.
⚡recovery signals provided in the event of—or following—a stop-loss (SL) hit.
⚡personalized discussions, instructions, and answers.
⚡revealing our high-performance indicators and teaching you how to configure and use them.
Good luck to us all, and may God guide us. Amen.  Long
Long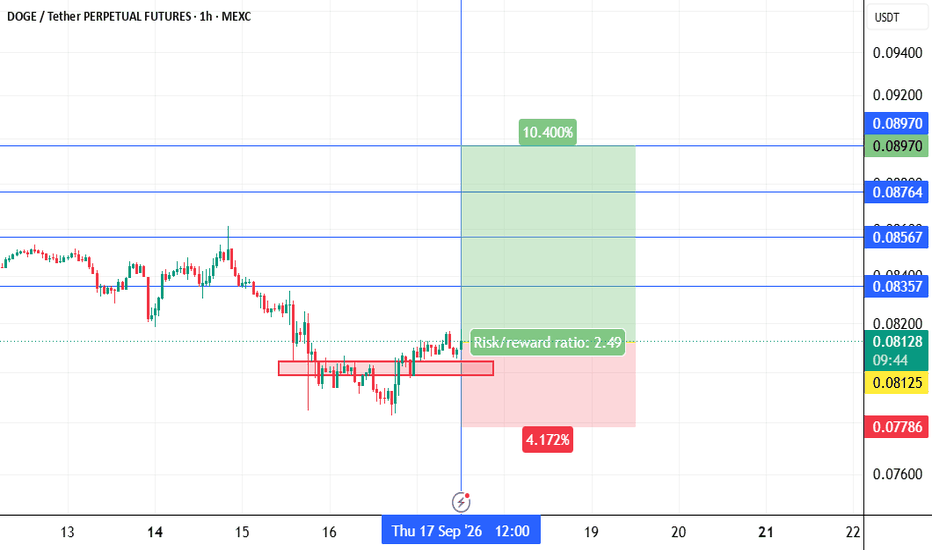
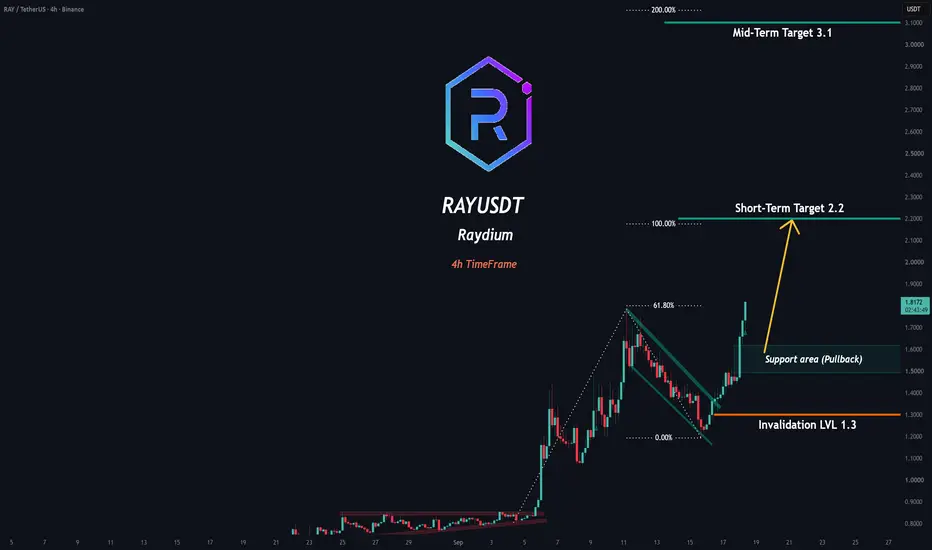
RAY: Correction Finished?CRYPTOCAP:RAY RAY spent the last few days correcting inside the descending channel, but the structure has now changed.
Price broke out of the corrective channel and started moving higher again. What makes this setup interesting is that the current move is following the size and rhythm of the previous bullish waves rather than being a completely new structure.
I’m mainly watching the 1.45–1.55 area as the pullback zone.
If RAY comes back into this area and holds it with a healthy reaction, I would be interested in seeing the bullish structure continue. I don't think chasing the current candle is necessary.
The levels on my chart are:
Pullback zone: 1.45–1.55
Invalidation: 1.30
Short-term target: 2.20
Mid-term target: 3.10
The idea behind the targets is simple: I'm measuring the previous bullish legs and looking at what a similar expansion could produce if the current structure continues.
The important part is the invalidation.
If RAY loses 1.30, the latest bullish wave has failed and the continuation setup is no longer valid. At that point, I would rather step back and wait for a new structure than try to defend the original idea.
Why RAY is worth watching
Raydium is one of the major trading and liquidity protocols in the Solana ecosystem. It provides swaps, liquidity pools, concentrated liquidity, farms and other trading infrastructure, and its newer product stack also includes LaunchLab and perpetuals.
There is also a more interesting part for RAY holders: protocol activity is connected to real trading activity and fees. Current market data shows Raydium continuing to generate significant fee volume, while LaunchLab has also become an important part of the ecosystem.
That doesn't mean protocol activity automatically sends RAY higher. Crypto is still crypto, and RAY remains highly sensitive to Solana liquidity and overall altcoin sentiment.
But when the technical structure improves at the same time that activity across the ecosystem remains meaningful, it is worth keeping the token on the watchlist.
For now, I’m not looking for a complicated trade.
Let the pullback come to us.
If the 1.45–1.55 area holds and the bullish structure remains intact, the next levels I'm watching are 2.20 and then 3.10.
If 1.30 breaks, the idea is off.
That's the whole setup.
Risk Warning: This is market analysis for educational purposes, not financial advice. RAY is a highly volatile crypto asset and can move sharply in either direction. Always define your risk and position size before entering a trade.  Long
Long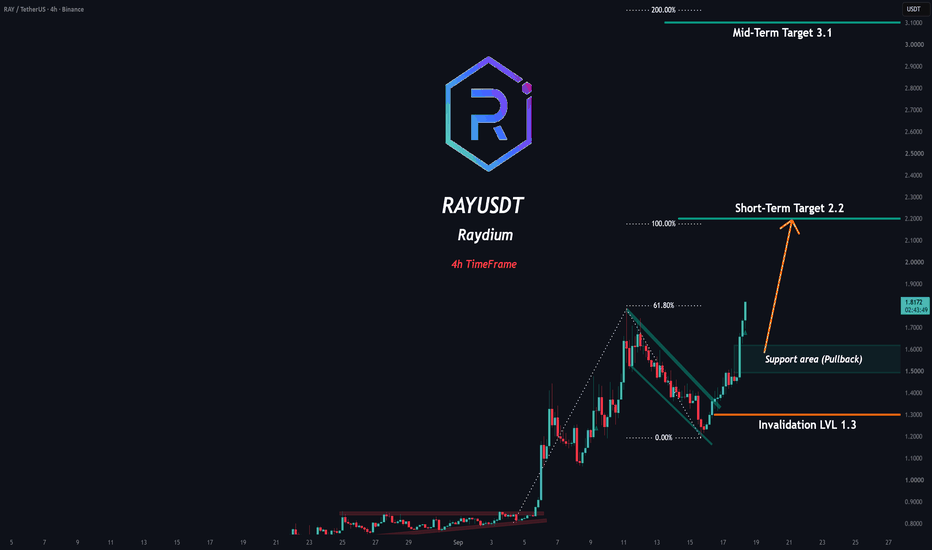
Long