zrxusdt longInstructions:
Entry point: yellow
Stop loss: red
Take profit: green or blue
👉Leverage x 5-10-20 for crypto
👉Leverage x 20-50-100 for commodities, stocks, indices, and forex
👉Margin 1-5% max.
Always practice risk and money management.
Invest a maximum of 5% on any trade or across all your trades.
Invest only what you can afford to lose, as no one is in control of the market.
👉Our analyses are primarily based on:
breakouts: two trend lines (ascending and descending) and a line indicating a horizontal breakout.
chart patterns: shoulders and head, triangle parttern, elliott impulse, etc etc.
We don't always have the time to track them at all times or to represent them visibly, given the numerous signals, the number of channels to manage, and especially because of the often rapid pace of market movements.
indicators: We associate at least two indicators with this technique.
👉Depending on the circumstances, we use specific indicators, often setting 3 or more take profit levels.
👉Indeed, there are good days in trading and also bad days. No one can promise to win every trade, and like all traders worldwide, we also experience stop-loss orders. However, we win more than we lose and remain positive.
👉You can close the position before or after the take profit orders indicated by the green lines if you are personally satisfied; the same applies to stop loss orders.
👉We must stay positive, clear-headed, and humble.
we cannot provide all instructions or all trades here on this channel.
Good luck to us all, and may God guide us. Amen.  Long
Long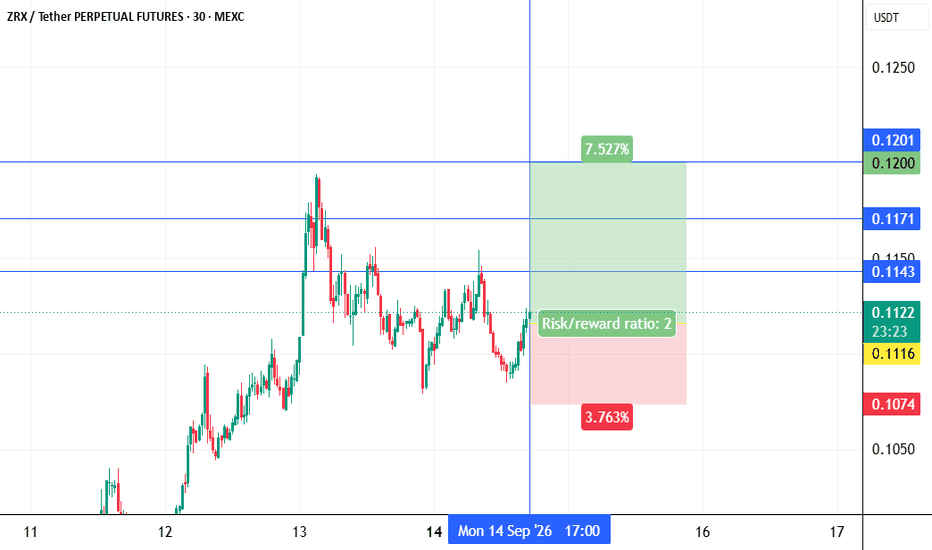
zecusdt shortInstructions:
Entry point: yellow
Stop loss: red
Take profit: green or blue
👉Leverage x 5-10-20 for crypto
👉Leverage x 20-50-100 for commodities, stocks, indices, and forex
👉Margin 1-5% max.
Always practice risk and money management.
Invest a maximum of 5% on any trade or across all your trades.
Invest only what you can afford to lose, as no one is in control of the market.
👉Our analyses are primarily based on:
breakouts: two trend lines (ascending and descending) and a line indicating a horizontal breakout.
chart patterns: shoulders and head, triangle parttern, elliott impulse, etc etc.
We don't always have the time to track them at all times or to represent them visibly, given the numerous signals, the number of channels to manage, and especially because of the often rapid pace of market movements.
indicators: We associate at least two indicators with this technique.
👉Depending on the circumstances, we use specific indicators, often setting 3 or more take profit levels.
👉Indeed, there are good days in trading and also bad days. No one can promise to win every trade, and like all traders worldwide, we also experience stop-loss orders. However, we win more than we lose and remain positive.
👉You can close the position before or after the take profit orders indicated by the green lines if you are personally satisfied; the same applies to stop loss orders.
👉We must stay positive, clear-headed, and humble.
we cannot provide all instructions or all trades here on this channel.
Good luck to us all, and may God guide us. Amen.  Short
Short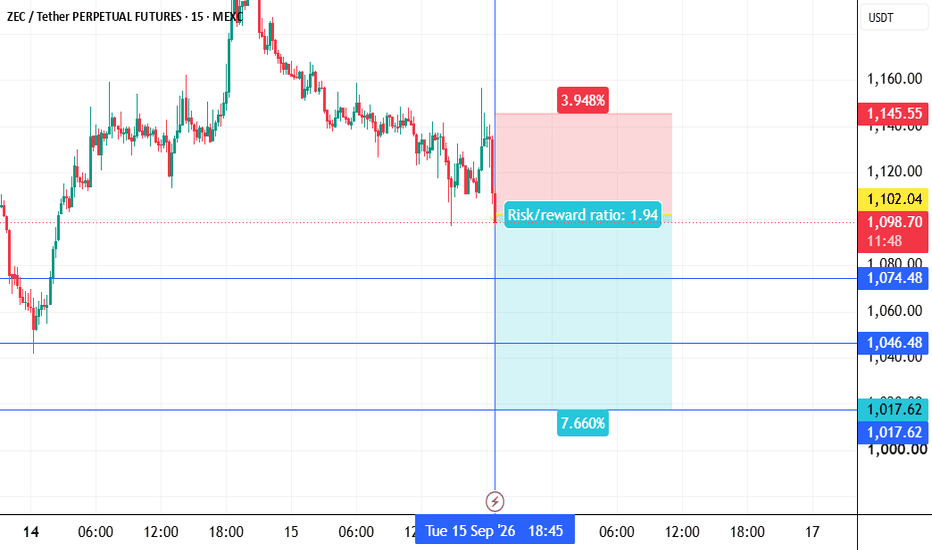
xvgusdt shortInstructions:
Entry point: yellow
Stop loss: red
Take profit: green or blue
👉Leverage x 5-10-20 for crypto
👉Leverage x 20-50-100 for commodities, stocks, indices, and forex
👉Margin 1-5% max.
Always practice risk and money management.
Invest a maximum of 5% on any trade or across all your trades.
Invest only what you can afford to lose, as no one is in control of the market.
👉Our analyses are primarily based on:
breakouts: two trend lines (ascending and descending) and a line indicating a horizontal breakout.
chart patterns: shoulders and head, triangle parttern, elliott impulse, etc etc.
We don't always have the time to track them at all times or to represent them visibly, given the numerous signals, the number of channels to manage, and especially because of the often rapid pace of market movements.
indicators: We associate at least two indicators with this technique.
👉Depending on the circumstances, we use specific indicators, often setting 3 or more take profit levels.
👉Indeed, there are good days in trading and also bad days. No one can promise to win every trade, and like all traders worldwide, we also experience stop-loss orders. However, we win more than we lose and remain positive.
👉You can close the position before or after the take profit orders indicated by the green lines if you are personally satisfied; the same applies to stop loss orders.
👉We must stay positive, clear-headed, and humble.
we cannot provide all instructions or all trades here on this channel.
Good luck to us all, and may God guide us. Amen.  Short
Short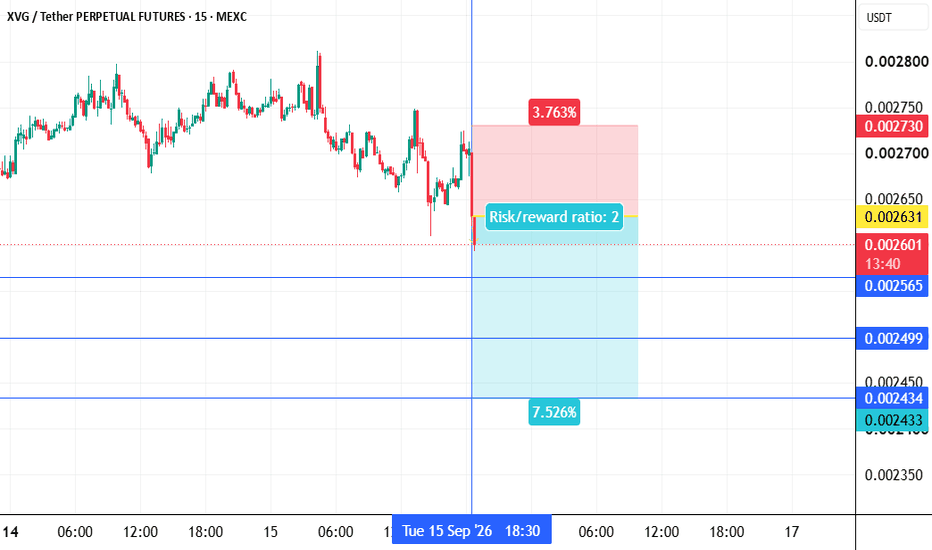
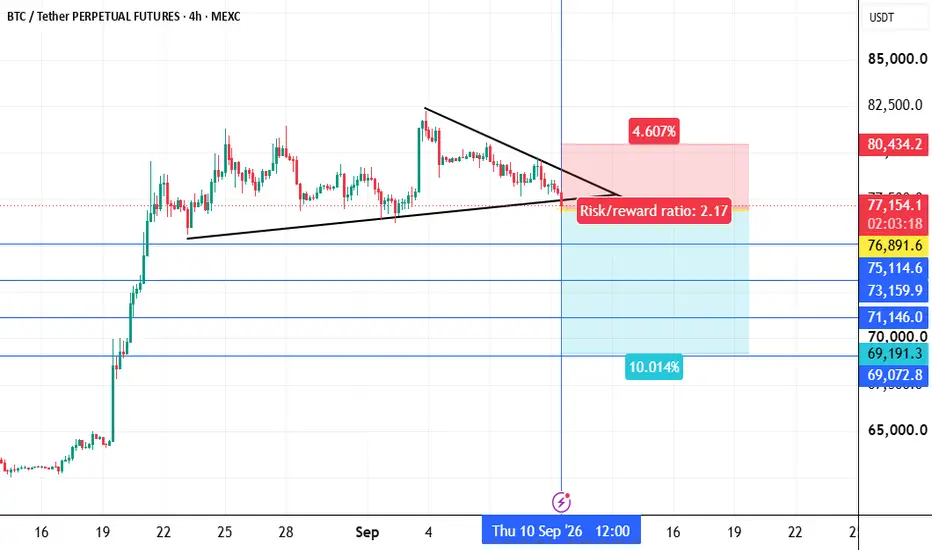
btcusdt shortInstructions:
Entry point: yellow
Stop loss: red
Take profit: green
👉Leverage x 5-10-20 for crypto
👉Leverage x 20-50-100 for commodities, stocks, indices, and forex
👉Margin 1-5% max.
Always practice risk and money management.
Invest a maximum of 5% on any trade or across all your trades.
Invest only what you can afford to lose, as no one is in control of the market.
👉Our analyses are primarily based on:
breakouts: two trend lines (ascending and descending) and a line indicating a horizontal breakout.
chart patterns: shoulders and head, triangle parttern, elliott impulse, etc etc.
We don't always have the time to track them at all times or to represent them visibly, given the numerous signals, the number of channels to manage, and especially because of the often rapid pace of market movements.
indicators: We associate at least two indicators with this technique.
👉Depending on the circumstances, we use specific indicators, often setting 3 or more take profit levels.
👉Indeed, there are good days in trading and also bad days. No one can promise to win every trade, and like all traders worldwide, we also experience stop-loss orders. However, we win more than we lose and remain positive.
👉You can close the position before or after the take profit orders indicated by the green lines if you are personally satisfied; the same applies to stop loss orders.
👉We must stay positive, clear-headed, and humble.
we cannot provide all instructions or all trades here on this channel.
Good luck to us all, and may God guide us. Amen.  Short
Short
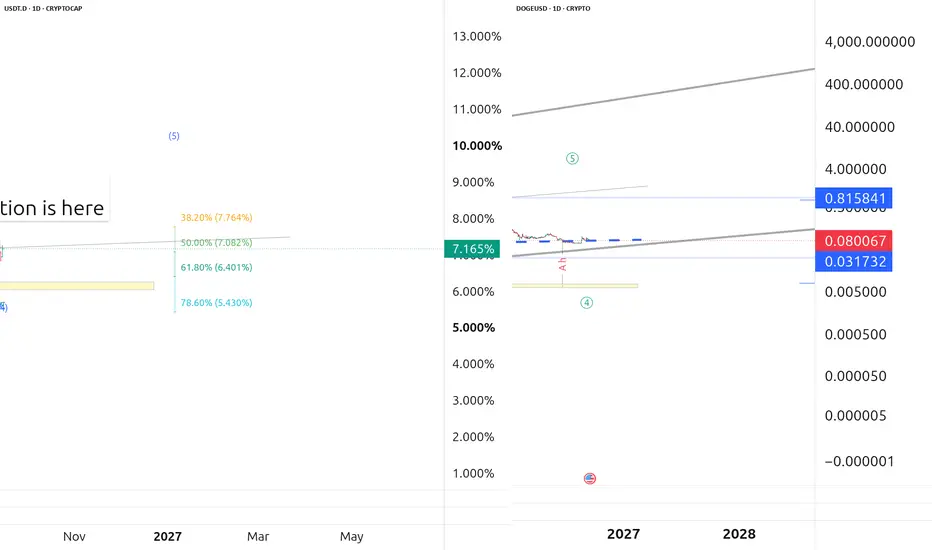
Beware reactionOn June 19, I made a prediction on X, and now we all can see how accurate and safe it is.
No matter which cryptocurrency you’re trading, if USDT’s dominance remains above 7.2% for 8+ hours, it will confirm that the downtrend is continuing. A failure to hold above that level will signal a final bullish rally before the bear market resumes. If the bullish rally is the case, I would take profits on Dogecoin at the 0.143, 0.163, and 0.23 levels. Hovever, my base case is 0.0324 and probably 0.0094.
As you may know, bonds is a key driver for many collateral markets, thus it has a negative correlation. It is called Cross-market analysis, one of the safest approaches in trading systems. My base case is the one you see on the 10-year yields screenshot, i.e. - a simple one, regular.
However, I see two more possible scenarios for the price structure of U.S. Treasuries may take:
1) An Ending Diagonal - the swings within this structure will likely be accompanied by a strengthening of the Japanese yen, a slow increase in raw commodity prices and metals, also a possible rise in cryptocurrency prices - in the near term. I.e, if this would be the case - bonds will pull back from the current values to the lower trend-line of the triangle: ~4.185%.
2) What really matters is the alternative waves count interpretation: the pattern above may turn out to be a Zigzag, rather than an impulse. In that case, the target will reach above 7.66%. This case means an aggressive downward for all the collateral markets.
There is a video on youtube. In the second part, I describe how I identified 2 probable bearish targets for Dogecoin price. I've been pointing to these targets since 2022 how I found them. I think achieving these goals will largely depend on the shape that U.S. Treasury bonds will take.  Short
Short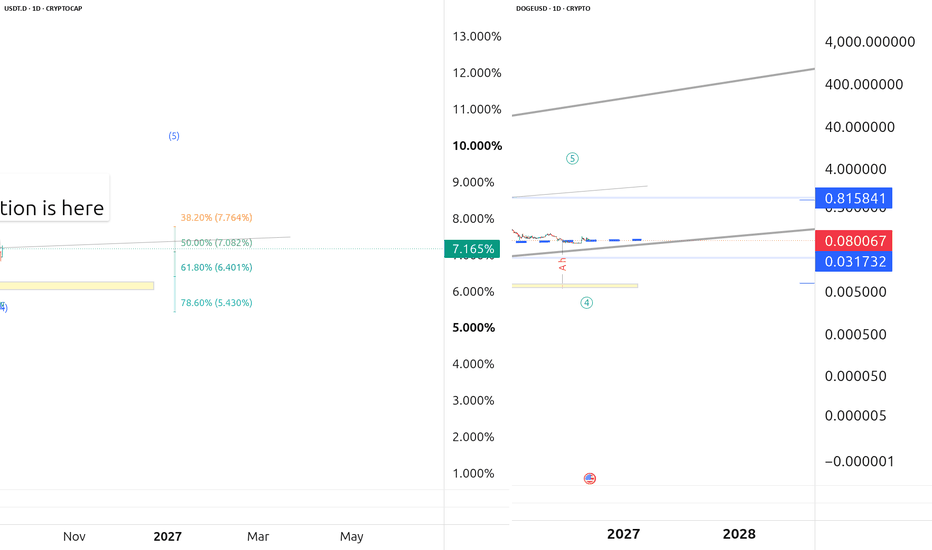
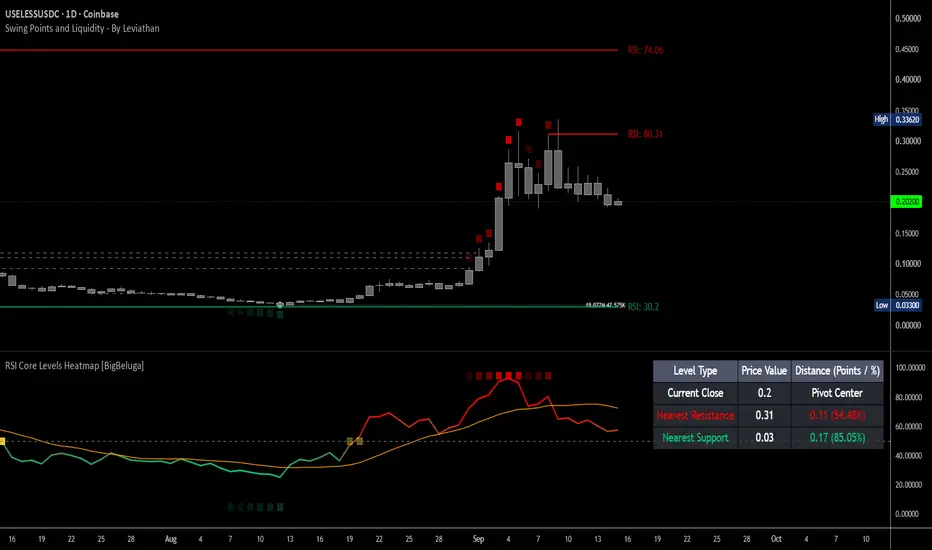
USELESSUSDC, Buyer Dominance Meets Breakout ConfirmationAlright, let's talk about what's happening on USELESS/USDC right now on Coinbase Advanced Spot. The European session gave us a setup that's worth breaking down — extreme order book imbalance, a volume spike, and price sitting above the key moving averages. That combo doesn't show up often.
Exchange Coinbase Advanced Spot
Entry Zone: 0.20590000
Target: 0.21413600 (+4.00%)
Session: European (07:00–12:00 UTC)
Trend Structure — Clean Bullish Backdrop
Price is trading above both the 200 EMA and 200 SMA on the daily. That's the bull/bear line for me. When we're above both, I'm looking for longs, not shorts. Simple as that.
Condition Status
Price > 200 EMA ✅
Price > 200 SMA ✅
Order Book Imbalance: +80.8%
Volume Spike: ≥2.0x ✅
Order Book — Buyers Are Dominating
+80.8% buy-side imbalance. That's about as extreme as it gets. Demand is absolutely crushing displayed sell liquidity right now.
What I'm seeing:
Big players accumulating aggressively
Sellers getting absorbed fast
Price likely has to move up to find real sell pressure
This kind of reading doesn't sit around for long. Either price moves, or the imbalance fades. I'm betting on the former here.
When whales load up, they don't just market buy. They use iceberg orders, let volume dry up, then push. All of that is showing up in this structure.
24h Change: -0.4%
24h Volume: 48.7M
Here's the interesting part price hasn't moved yet. Down 0.4% on the day with an 80% buy imbalance? That's hidden accumulation. Classic pre-breakout behavior.
What I'm Watching
Holding above 0.20590000 if buyers defend this, we're good
Volume expanding toward 0.214136 real breakouts need participation
Imbalance staying elevated if it drops, momentum stalls
Reaction at target I'll consider scaling out if volume keeps pushing
 Long
Long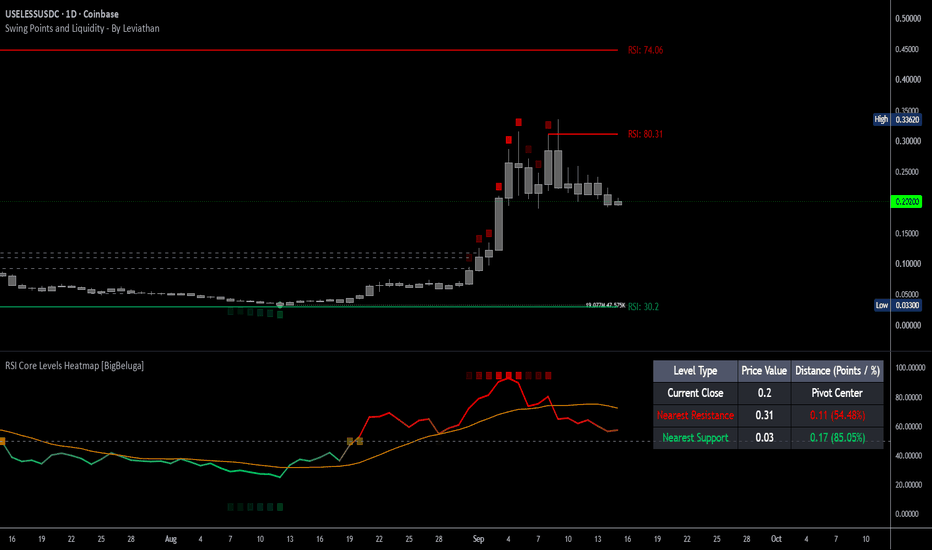
Short 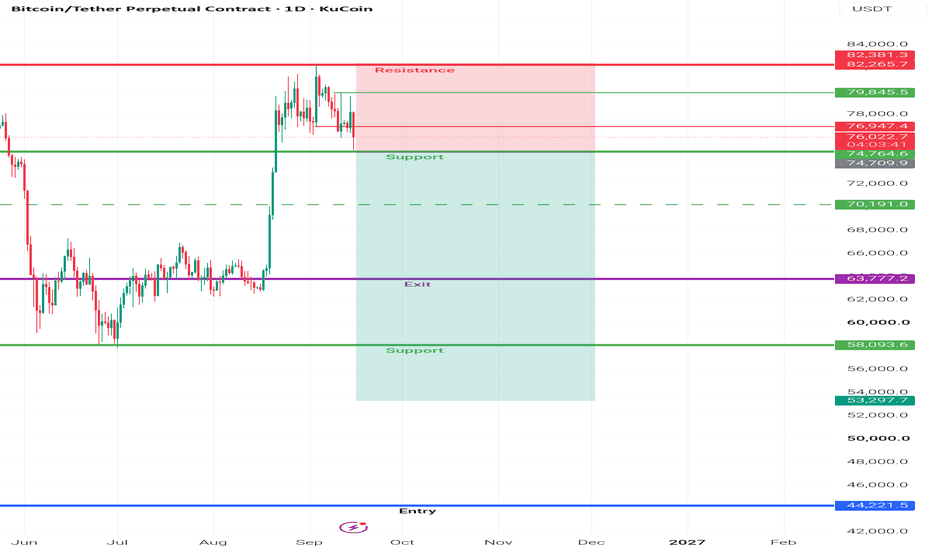
Quick BITCOIN UPDATE- touched tha 75K mark, what now?
Main chart is 4 Hour
I mentioned a few posts ago that we could reach 75K and we did but we had a very swift recovery from that anf that shows the Bulls are still here.
However, we have lost the lower Local line of support and so we could reach down in a more meaningful way to the lower main trend line.....Which will hopefully remain as support.
So Lets look at what we have
4 hour RSI
RSI is NOT Oversold but certainly below Neutral. This shows PA has more strength than weakness maybe
This may need to drop further, which can happen while PA ranges.
4 Hour MACD
Also below Neutral with the ability to drop further. Histogram is still Red and so unlikely to turn in the next few hours. The Lower this goes, the more strength PA has to recover
Longer term
Daily RSI
This has only just reached Neutral but may not need to drop all the way to OverSold before turning. However, I am not to sure we will see a bouce off Neutral just yet
Daily MACD
This is the one that Give it all away for me.
MACD ( yellow) has not reached Neutral just yet and so this needs to continue to Drop
Again, this can happen while PA ranges Horizontal , so a Drop is not certain.
CONCLUSION
While we wait fo the FED Rate Rise, which is almost certain,, PA could remain at this Low zone, maybe reaching once again down to the lower trend line, While we wait for MACD and RSI to Cool off
A reminder, that trend line is based in 2013 and is STRONG, in fact, Both Orange lines and the fainter blue line above are based in 2013
Bitcoin is in a GOOD POSITION and this move maybe the Bulls Pricing in the expected Rate Rise.
And as I have shown in Previous posts, Bitcoin Does NOT always Drop if Rates Rise.....
And I sall show that again after the FED meeting.
Umtil then, hang tight, Options are Varied and things likely to remain Volatile
 Short
Short
BITCOIN: Double-Top-Confirmation, Targets Activated!Hello Community,
welcome to my new analysis of BTCUSD on the local timeframe perspective. As I have been preaching already before BTCUSD is considerably bearish in the local structure, and pullbacks would be highly likely. Right now, BTCUSD has already moved to the downside by some significant margins. Now, with the very recent price moves, BTCUSD has also completed a major formation for which I have spotted the underlying factors.
When looking at my chart, we can see how BTCUSD recently bounced below the neckline of this major double top formation. It also rejected off the 100-EMA in red, which is a major resistance now. From this point of view, BTCUSD is likely to accelerate selling pressure in the next times. As BTCUSD has already pulled to the downside below the neckline, it has also already activated the lower target zones seen in my chart.
In this manner, thank you a lot for watching!
The support is highly appreciated.
VP  Short
Short
Long 
Short 
 Short
Short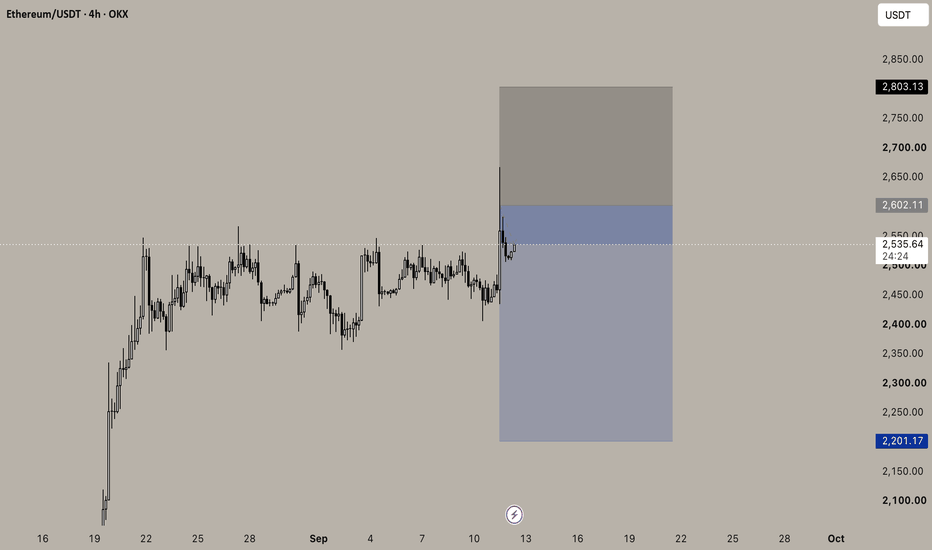
Short 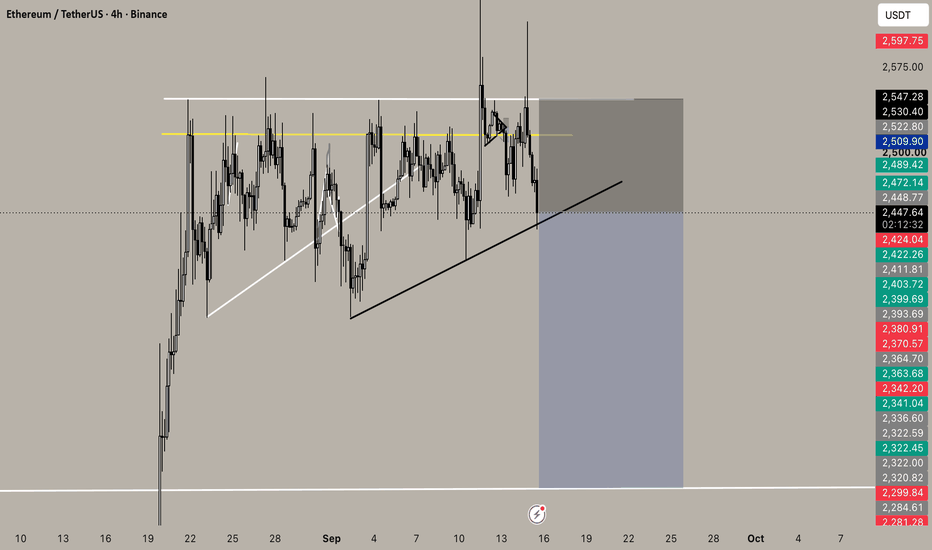
Short 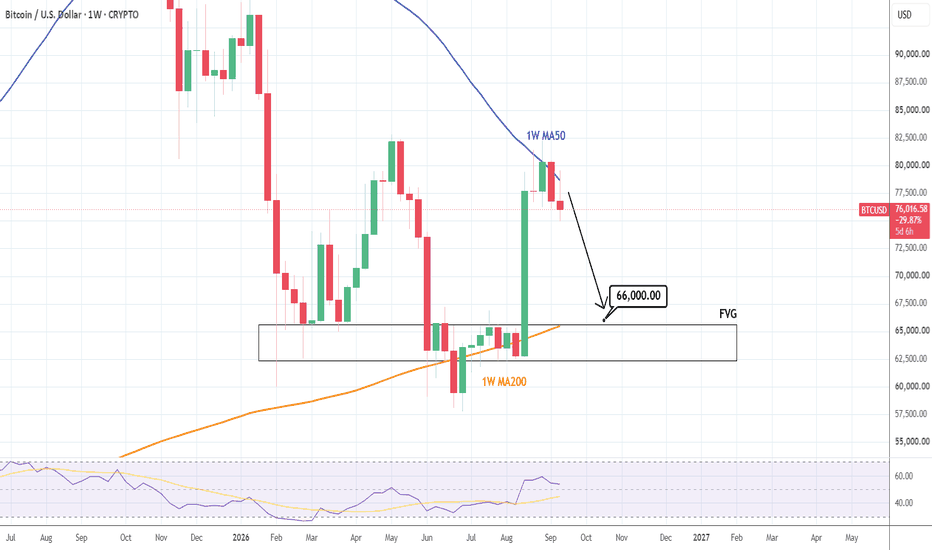
ETHUSD | BUY SETUP...
🟣 ETHUSD | BUY SETUP
📍 Buy Reaction Zone: 2,365–2,385
🎯 Target 1: 2,480
🎯 Target 2: 2,550–2,560
🟢 Major Support: 2,350–2,380
🔴 Resistance: 2,480–2,500
🔴 Major Resistance: 2,540–2,560
📊 Market Analysis:
ETHUSD has experienced a sharp bearish move from the upper range and is now approaching the lower boundary of the established range around 2,350–2,380. This area has previously acted as a strong reaction zone, making it important for a potential bullish reversal.
If buyers defend 2,350–2,380 and price starts reclaiming 2,400–2,420, the recovery can first target the 2,480–2,500 resistance area. A confirmed breakout above 2,500 would strengthen the bullish move toward the 2,540–2,560 major resistance/target zone.
The BUY idea remains valid while the lower support holds.
🛡️ Bullish Invalidation: Below 2,345
Market Bias: 🟢 BUY — Support Reversal Setup Long 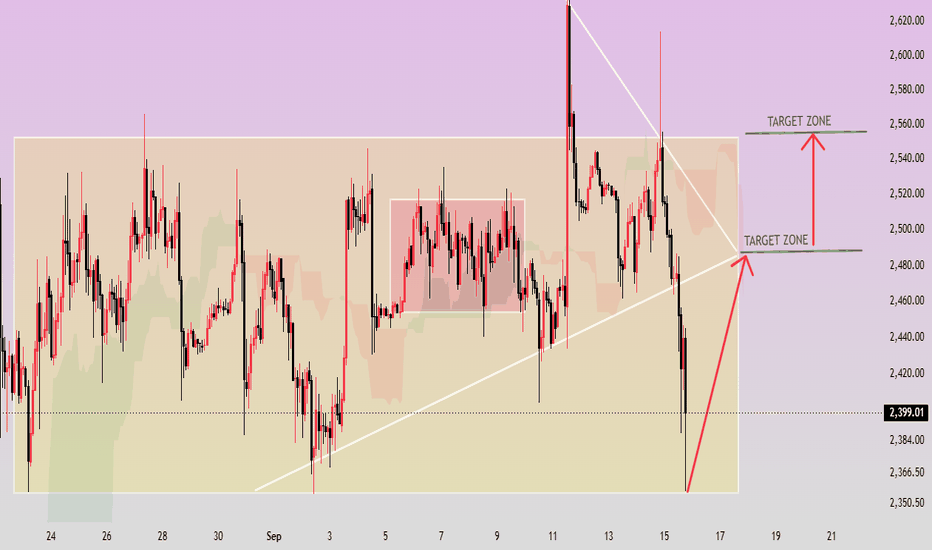
Short 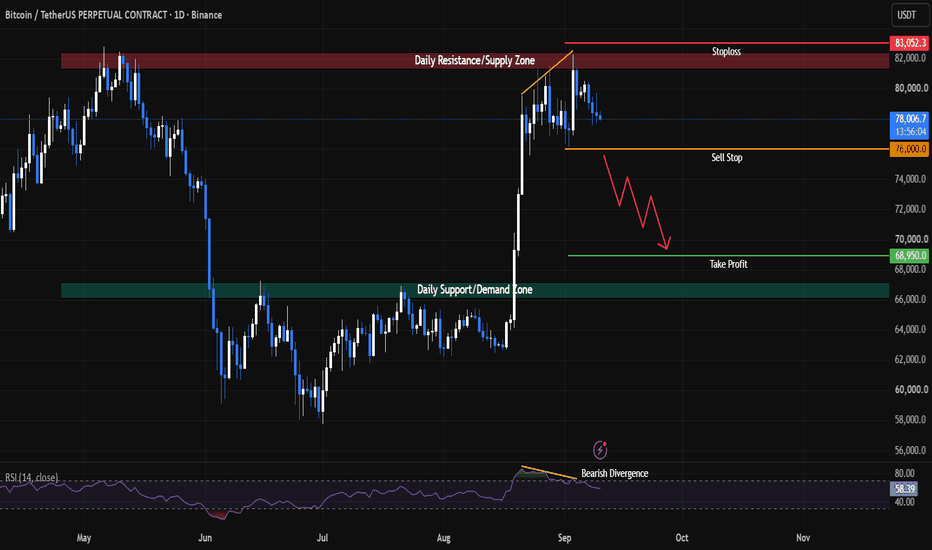
 Short
Short
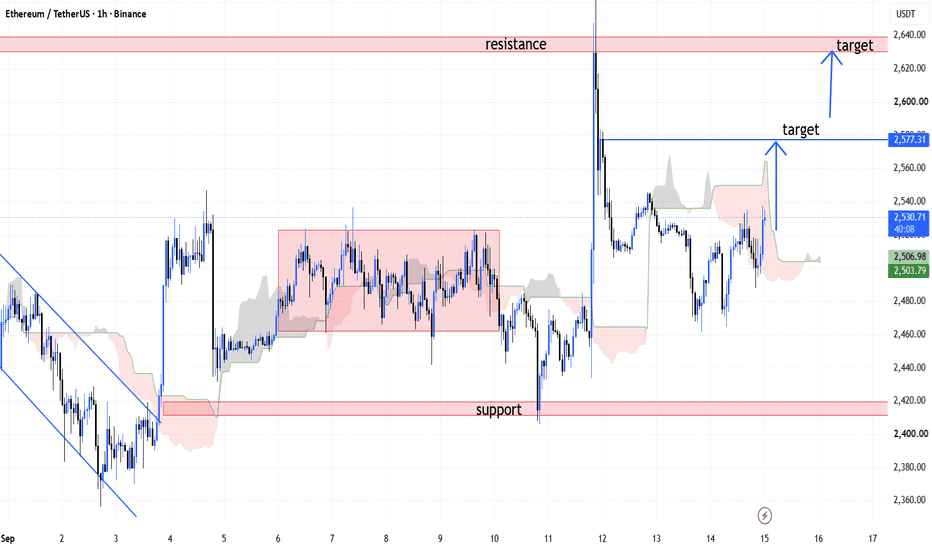
ETH/USDT — Bullish Move Toward Resistance
ETH/USDT is showing bullish momentum on the 1H chart after holding the support zone around **$2,410–$2,420**. Price is currently trading near **$2,532**, with buyers attempting to push through the nearby resistance.
🎯 **Target 1:** $2,577
🎯 **Target 2:** $2,630–$2,640 resistance zone
A sustained move above **$2,540–$2,550** could strengthen the bullish continuation toward the targets. Watch for confirmation and manage risk carefully.
**Bias:** 🟢 Bullish
**Key Support:** $2,410–$2,420
**Key Resistance:** $2,630–$2,640
Long