Short
Short
 Long
Long
 Long
Long
 Long
Long
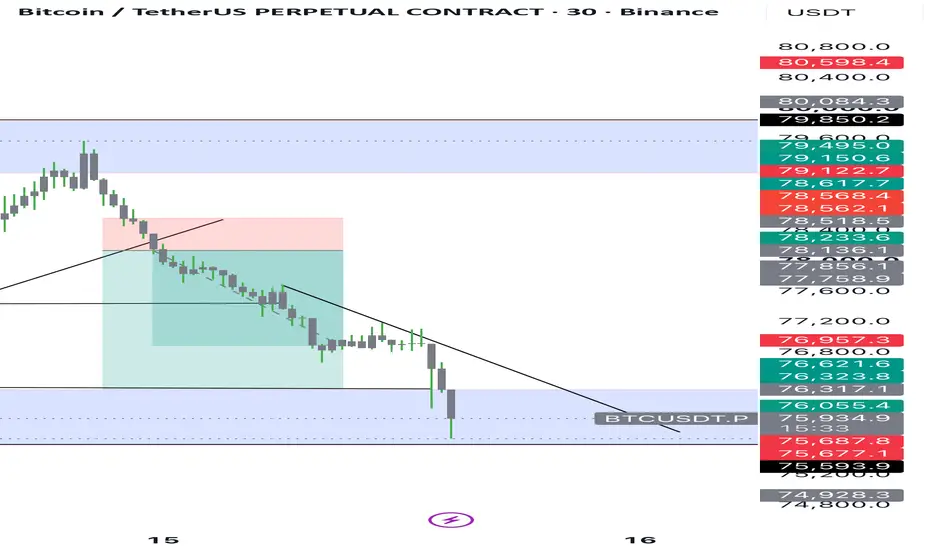
BTCUSDT – Bearish Head & Shoulders Below 76,1K, Eyes on 74K FillBitcoin is building a clean short setup, with the final confirmation resting on a break of the 76,091 neckline.
Why This Level Matters:
Price has rolled over into a head and shoulders structure after topping near 81,000. The 76,091 neckline is the last support holding the range together. Below it sits a stack of unfilled imbalances waiting to be traded into.
Gameplan / Primary Scenario:
Sell the break and retest of 76,091. Once the neckline gives way, ride the continuation lower into the imbalance zones at 74,000, then 71,000, with the full extension targeting the 64,481 base. This move stays valid as long as price holds below the neckline after the breakdown.
If this added value, boost it forward. What are your thoughts?
Swallow Academy Short 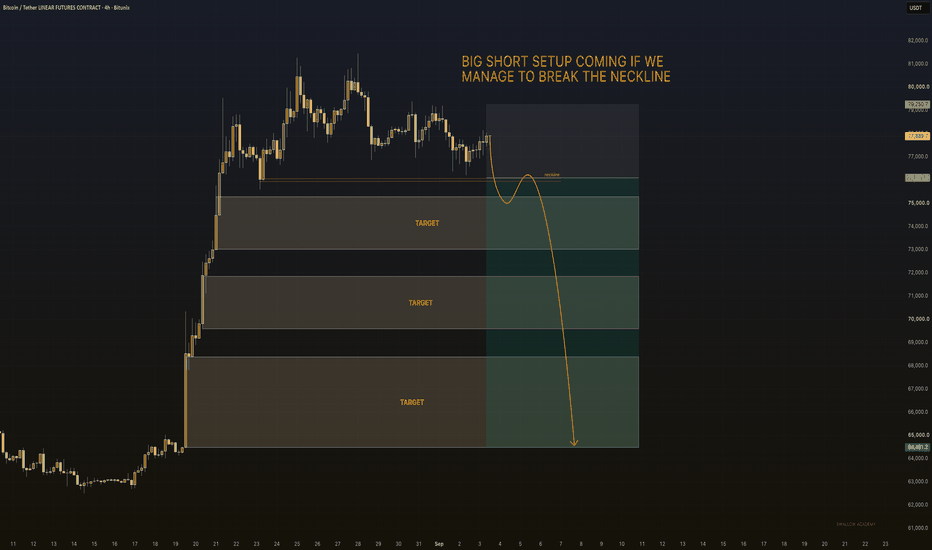
BTC – Bearish Distribution Below 76,9K....BART SIMPSON Movement?BTC has spent 25 days trapped in a sideways channel after a sharp expansion, and price action is leaning toward a distribution breakdown.
🟠 Why This Level Matters:
The first week delivered a strong impulse move, followed by a 3-4 week range that could be read as either accumulation or distribution. On the 4H, the extended range and current structure point toward distribution. The local neckline is the line that decides the next leg.
🟠 Gameplan / Primary Scenario:
Sell the breakdown once price loses the local neckline, which should trigger this week or next. A confirmed break opens the door for stronger downside momentum, targeting a return toward the local lows near 65,000. Until that break confirms, treat rallies inside the range as fuel for the move lower.
For context, there is no reasonable case for markets to reverse and push higher yet. That environment is likely 3-5 months out, if not longer.
If this added value, boost it forward. What are your thoughts?
Swallow Academy Short 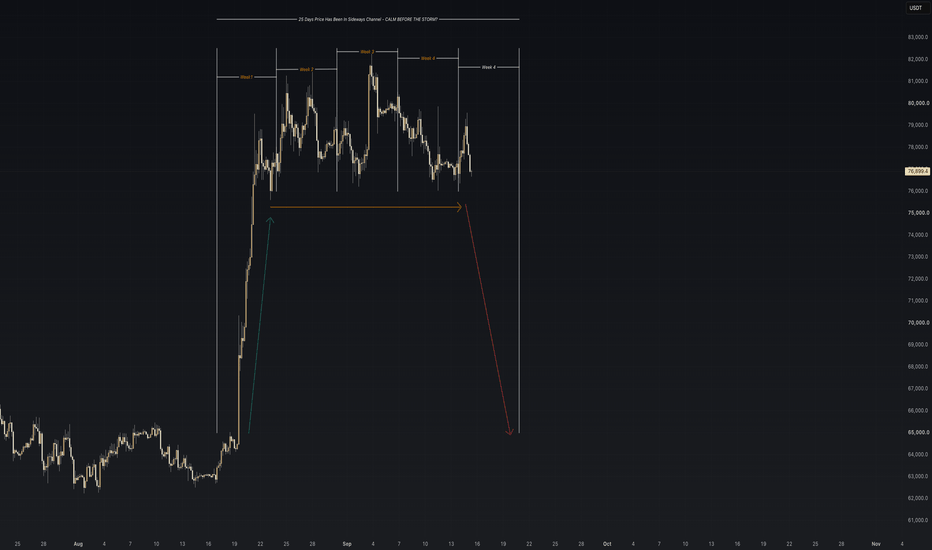
 Long
Long
Long 
BTC: Healthy Accumulation Before $98,000 TargetOverview & Technical Analysis:
On the 4H timeframe, Bitcoin (BTCUSDT) has clearly broken out of its multi-month descending trendline and is currently trading firmly above the 200 SMA, confirming a shift in market structure toward a bullish momentum.
Following the strong impulsive rally out of the bottom range, price is currently forming a Bullish Flag / Consolidation Channel around the 76,000–76,000–82,000 zone. This consolidation phase is a healthy reset for buyers before the next expansion phase.
Key Scenarios & Target:
Immediate Structure: Accumulation inside the ascending flag channel.
Breakout Expectation: A decisive breakout above the upper boundary of the channel (~$82,500) will trigger the next leg up.
Final Target: The major supply/liquidity zone around 96,000–96,000–98,400 (previous macro resistance block).
Invalidation: A clean breakdown and close below the lower support line ($75,000) will invalidate this bullish setup.
Trade safe and manage your risk! Long 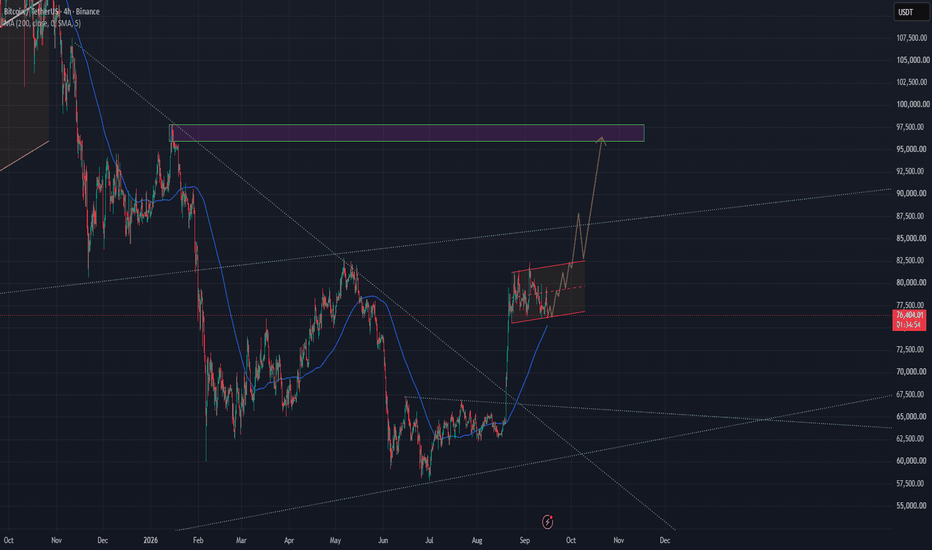
 Long
Long
CRT Strategy: Confirmation → Retest → Trade The CRT Strategy (Confirmation, Retest & Trade) is a structured price-action approach designed to help traders avoid entering the market too early. Instead of chasing price after a move, the strategy focuses on waiting for clear confirmation, a controlled retest, and then a potential entry in the confirmed direction.
The first step is Confirmation. Look for important market information such as a liquidity sweep, Break of Structure (BOS), or strong directional move. This helps establish whether buyers or sellers are showing strength and gives the setup a clear direction.
The second step is the Retest. After confirmation, wait for price to return toward an important area such as an Order Block, breakout zone, or previous structure level. The retest can provide a more controlled location for an entry instead of chasing the initial breakout.
The third step is the Trade. Once price reaches the key zone, wait for a clear reaction or additional confirmation before considering an entry. For a bullish setup, the focus is on bullish continuation after the retest; for a bearish setup, the focus is on bearish continuation.
🔹 Bullish CRT Flow
Liquidity Sweep → BOS → Retest → Bullish Confirmation → Entry → TP
🔻 Bearish CRT Flow
Liquidity Sweep → BOS → Retest → Bearish Confirmation → Entry → TP
Risk management is an essential part of the strategy. Use a logical Stop Loss, define your Take Profit levels, and avoid risking too much on a single trade. A good setup is not only about finding an entry—it is also about controlling risk and waiting patiently for the right opportunity. Education 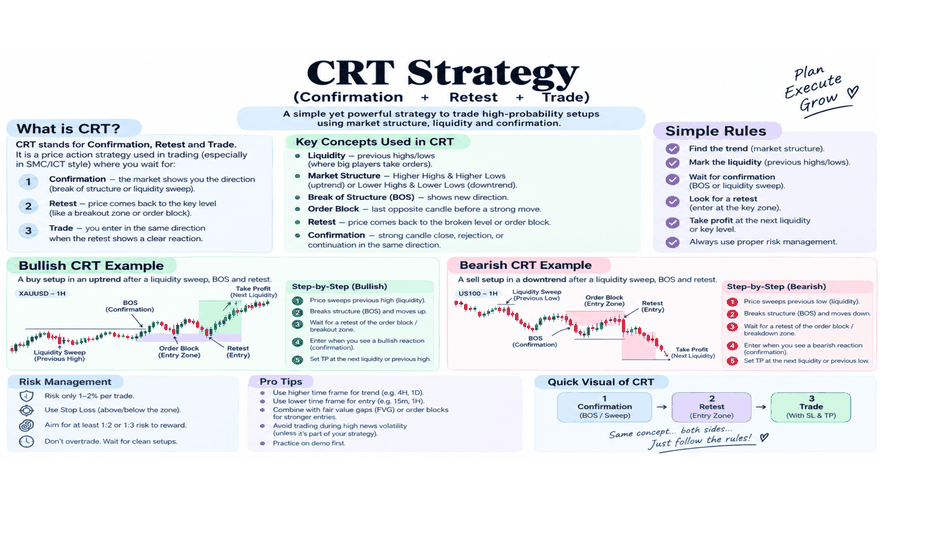
 Long
Long
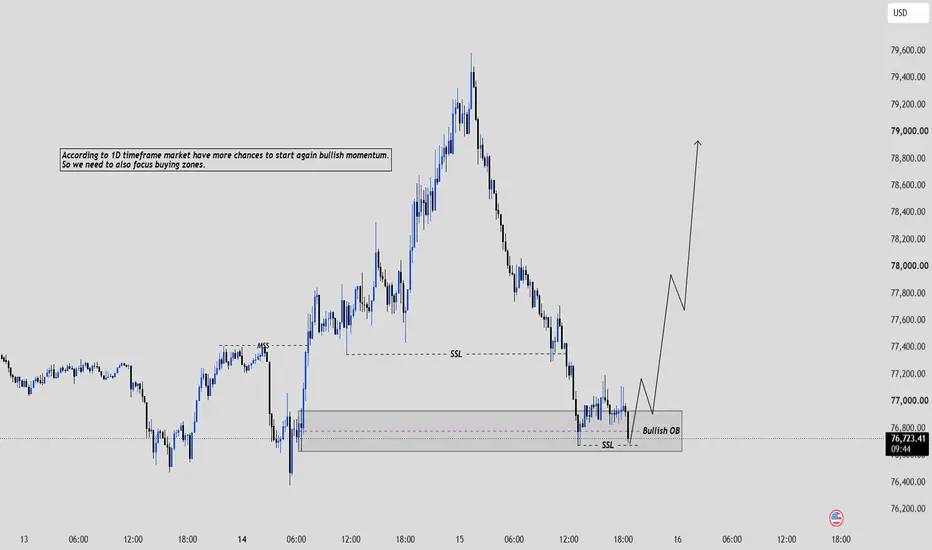
BTCUSD: Bullish Order Block Setup – Watching for Momentum Shift Educational Breakdown – Bullish Order Block Reaction Bitcoin is currently testing a key demand area after a corrective move.
1. Higher Timeframe Context
According to the daily timeframe, the market has higher chances of resuming bullish momentum. This makes lower-timeframe buying zones more relevant.
2. Market Structure Shift (MSS)
A previous MSS is marked, showing the earlier change in character.
3. Sell-Side Liquidity (SSL)
Multiple SSL levels have been swept, which often precedes a reversal higher.
4. Bullish Order Block
The grey zone around 76,600 – 76,900 is a clear Bullish Order Block. Price is currently reacting from this area.
Potential Trade Plan (Educational Example):
Bias: Bullish
Buy Zone: 76,600 – 76,900 (Bullish OB)
Stop Loss: Below 76,400
Take Profit 1: 77,800
Take Profit 2: 78,800 – 79,000
Risk : Reward ≈ 1 : 2.5
This setup shows a classic reaction from a Bullish Order Block after liquidity sweeps, aligning with higher-timeframe bullish expectations.
This analysis is for educational purposes only. Always manage your risk properly.
Long 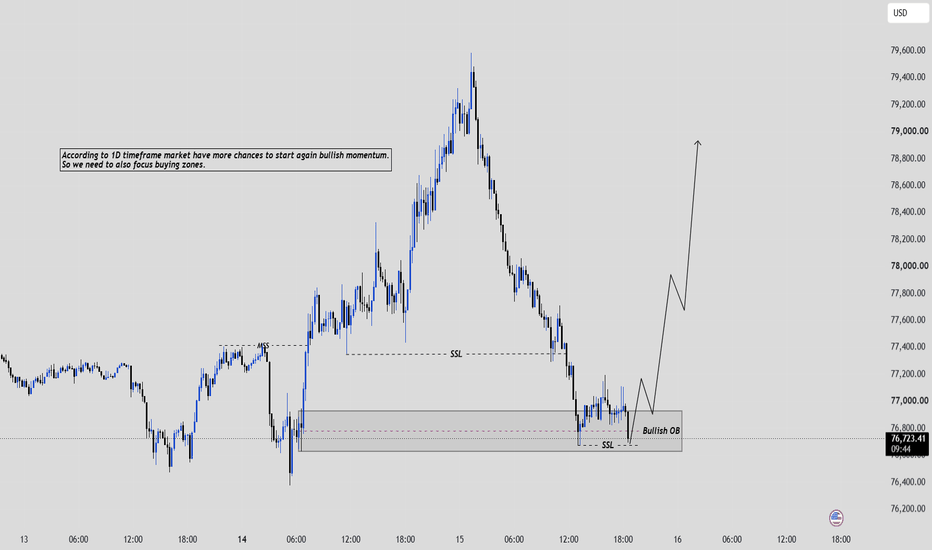
HOW-TO: check whether your indicator's verdict agrees with its oMost indicators that print a verdict also print a number next to it. A state and a strength. A bias and a confidence. A regime and a percentage.
You read them as the same claim at two resolutions. The word is the summary, the number is the detail.
Here is a week where they were not.
What was read, and how
Forty one consecutive four hour bars on one symbol, Sep 6 to Sep 13. Each bar's regime, status and strength percentage read one at a time off the chart in replay. Nothing modelled, nothing fetched. The panel is the instrument and the panel is what was written down.
Nine of those bars were NEUTRAL, where the ladder does not run. That leaves thirty two bars carrying both a verdict and a number.
The two columns overlap, and one side fails badly
Nineteen bars read STRONG. Their strength values ranged from 3 percent to 100 percent, median 77.
Nine bars read CRITICAL. Those ranged from 6 percent to 46 percent, median 33.
Seven of the nineteen STRONG bars, thirty seven percent of them, printed a strength lower than the median CRITICAL bar. Those seven read 3, 4, 8, 10, 23, 25 and 31 percent.
The reverse essentially never happened. Zero of the nine CRITICAL bars printed above the median STRONG bar.
So the failure runs one way. STRONG is the verdict that shows up at any number at all.
The sharpest pair
In the same week, on the same chart, the panel printed STRONG at 3 percent and CRITICAL at 46 percent.
Forty three points in the wrong direction.
The test that actually settles it
Asking whether two columns correlate is the weak question. The real one is whether the number can tell you the verdict.
Take the twenty eight bars that read either STRONG or CRITICAL. Find the single threshold that splits them best, allowed to cheat by picking the most flattering cut point with full hindsight on this exact data.
Guessing the commoner label every time is right 68 percent of the time, because STRONG is nineteen of the twenty eight.
The best possible threshold, at 41 percent, is right 71 percent of the time.
The number buys four points over guessing, and that is with hindsight, on its own data, with the cut chosen to flatter it.
The frame worth keeping
Two consecutive bars, Sep 10.
At midnight the panel read FADING at 72 percent. Four hours later it read STRONG at 10 percent.
The verdict climbed a rung while the number fell sixty two points.
What this is not
It is not a claim that the indicator is broken. The status is plainly computed from something other than the displayed percentage, and it is entitled to be.
The finding is about the display. Two figures printed side by side, read as one claim, answering different questions, with nothing telling the reader which is which.
Run it on your own
Pick any indicator that shows a state and a number together. Write down both for thirty bars. Then ask one question of your notes: did the number ever tell you the state before you read it.
If the answer is no, you have two columns and one of them is decoration.
One symbol, one timeframe, one week, forty one bars. Descriptive of that window and nothing wider.
Observations, not recommendations.  Education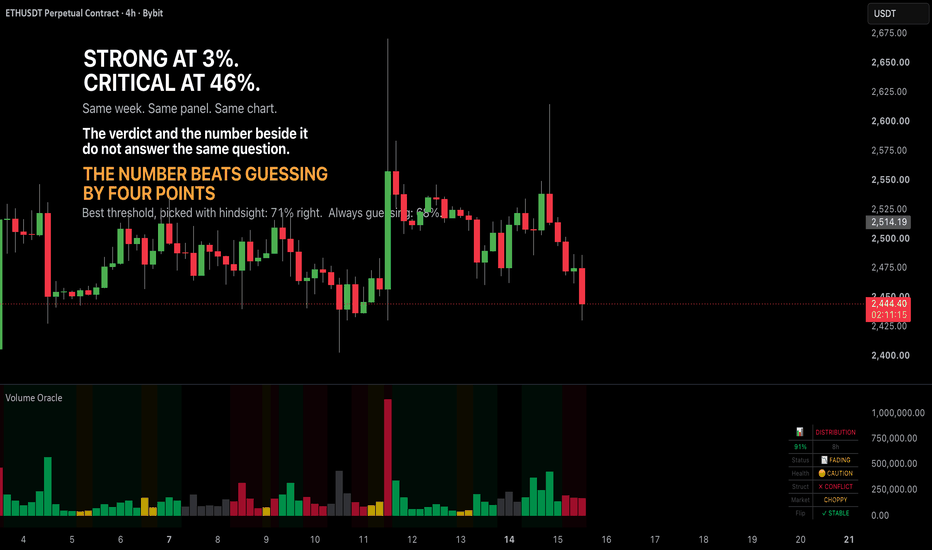
Long 
Short 
 Long
Long
BTC | Structure Shifted, Five Pools Sit AboveBy analyzing the #BTC (Bitcoin) chart on the Daily timeframe, we can see a market that spent almost a year making lower lows, swept the liquidity beneath them, and has since shifted structure upward with enough force that the entire range above is now unclaimed liquidity.
━━━━━━━━━━━━━━━━━━━━
DAILY TIMEFRAME
━━━━━━━━━━━━━━━━━━━━
The downtrend. From the November high at $116,323.39 price moved in one direction. Each rally failed lower than the last, and in February the BMS confirmed it — the November swing low was broken and the bearish structure was formally set. Every bounce after that was sold into.
The sweep. The low did not come from strength. In early July price drove through the February low into the stops resting beneath it — a clean liquidity sweep — and printed the Protected Low at $57,664.45 . That is the origin of everything that followed.
The shift. From that low price built a base through July and August, then in late August broke the structure to the upside with the MSS . The way it broke matters more than the fact that it broke: the move left clear bullish fair value gaps behind it and expanded vertically rather than grinding. Displacement like that is how a real shift looks. Price is now at $77,037.28 .
━━━━━━━━━━━━━━━━━━━━
THE LIQUIDITY ABOVE
━━━━━━━━━━━━━━━━━━━━
Five untouched pools of buy-side liquidity sit overhead, each one an old high that was never revisited:
BSL 1 — $82,875.74
BSL 2 — $90,609.88
BSL 3 — $98,042.69
BSL 4 — $107,584.81
BSL 5 — $116,323.39
A high that has never been defended isn't resistance, it's a target. Five of them stacked in sequence is the road map for the rest of this move.
━━━━━━━━━━━━━━━━━━━━
THE BIAS
━━━━━━━━━━━━━━━━━━━━
Bullish. The structure shifted, the displacement was real, and the liquidity is all on one side.
━━━━━━━━━━━━━━━━━━━━
SCENARIO A — THE BASE CASE
━━━━━━━━━━━━━━━━━━━━
Chasing here is the worst version of this idea. The better entry sits below the 0.5 retracement of the impulse leg — the area just above $70,000 . Price is extended from its origin, and a pullback into discount is the normal behaviour after displacement of this size.
The first objective on a reaction from there is BSL 1 at $82,875.74 , and above it the ladder opens.
━━━━━━━━━━━━━━━━━━━━
SCENARIO B — THE DEEPER RETRACE
━━━━━━━━━━━━━━━━━━━━
The stronger area is lower. The RBS zone at $65,097.26 – $67,206.58 is where the resistance that capped price from April through August was broken and flipped. It also overlaps the 0.62 ($67,206.58) and 0.705 ($65,097.26) retracement levels of the same impulse.
Broken resistance, deep discount and a fib cluster in the same band is as much confluence as this chart offers. If price reaches it and the daily prints a buy signal there, that is the high-conviction entry — same targets, materially better price.
━━━━━━━━━━━━━━━━━━━━
INVALIDATION
━━━━━━━━━━━━━━━━━━━━
A daily close below the Protected Low at $57,664.45 . That level is the origin of the shift; beneath it the July sweep failed and the bullish structure is gone.
An earlier warning comes first: a daily close below $65,097.26 that does not reclaim means the RBS zone failed as demand, and the entry thesis is broken well before the structure is.
And the rule that governs all of it: a break is a candle close, not a wick. The RBS zone is exactly where a wick beneath will look like failure and close back inside — that band held price for four months, which means it is thick with stops on both sides, and thick stop clusters are what wicks are made from.
━━━━━━━━━━━━━━━━━━━━
FUNDAMENTAL BACKDROP
━━━━━━━━━━━━━━━━━━━━
The supportive side. US spot Bitcoin ETFs just closed their strongest three-week stretch of 2026 at $3.8 billion in combined inflows, including $986.9 million in the week ending September 5. Total net assets across the products reached $101.3 billion , and the 50-day and 200-day moving averages converged into a golden cross around September 11 . The previous three completed crosses were followed by moves of 50%, 45% and 60% .
The opposing side. This is not a clean macro picture. Markets are pricing a 58.4% probability of a 25bp rate HIKE at the September 15–16 FOMC — happening right now, not a cut. July PCE inflation ran at 3.7% year over year , August payrolls came in at 162,000 , and Brent near $97 is feeding the inflation problem. Year-to-date ETF net flows are still roughly $1 billion negative despite the recent surge, and a golden cross is a lagging signal that has reversed within weeks before.
The link. The FOMC outcome is the most likely cause of the retracement this idea is waiting for. A hawkish result does not break the structure — it hands the discount entry the chart is already asking for. Which is the entire point of having the levels marked before the event rather than reacting after it.
This analysis will be updated as the market evolves.
Best Regards, BigBeluga 🐳  Long
Long
Long 
BTCUSD Daily Structure | Liquidity, Order Flow & Key Levels BTCUSD 1D — Professional SMC & Price Action Analysis
This analysis is based on market structure, liquidity, supply/demand zones, MSS, BOS, ChoCH, liquidity sweeps, OTE zone and EMA-based price action. The objective is to understand the reason behind each major candle movement rather than treating every candle as an independent signal.
1. Initial Bullish Structure
At the beginning of the chart, price forms a series of bullish candles and starts creating higher highs and higher lows. The consecutive bullish candles indicate strong buying pressure, while the BOS (Break of Structure) confirms continuation of the bullish structure.
The following candles continue pushing upward because previous swing highs are being taken out. This suggests that buyers are controlling the short-term order flow.
2. MSS & Bearish Shift
After price reaches the upper area, the candles begin showing rejection from the higher levels. The bullish momentum weakens and price starts forming lower highs.
When the important swing structure is broken, an MSS (Market Structure Shift) appears. This is the first indication that the previous bullish order flow may be changing toward bearish conditions.
3. Strong Bearish Displacement
The large bearish candles following the structure shift show aggressive selling pressure. These candles move through previous support areas with relatively strong displacement.
This movement is important because it confirms that sellers are not simply producing a small pullback; they are attempting to control the next phase of market structure.
4. Consolidation & Liquidity Formation
After the strong decline, price begins moving sideways. Multiple candles repeatedly react around similar highs and lows.
This type of consolidation can create liquidity pools above swing highs and below swing lows. The market may later revisit these areas before choosing the next directional move.
5. Recovery & Bullish BOS
Price eventually begins producing higher lows followed by bullish candles. Once a previous swing high is broken, the BOS confirms a bullish structural continuation.
The bullish candles are important because they demonstrate that buyers are gradually regaining control after the previous bearish phase.
6. Rejection From Higher-Timeframe Supply
As price approaches the upper supply/resistance area, bullish candles begin losing momentum. Wicks and smaller bodies indicate increasing rejection.
The subsequent bearish candles confirm that sellers are defending this zone. The area around 82,167 is therefore an important structural reference rather than an automatic entry point.
7. Current Structure & Liquidity Sweep
The recent candles show price returning toward the OTE/premium-discount area. The visible sweep around the recent highs suggests that liquidity has been taken before price retraces.
The reaction after the sweep is more important than the sweep itself. Traders should wait for confirmation through MSS/ChoCH or a clear displacement candle rather than entering solely because liquidity was swept.
8. Demand Zone
The lower blue area around 64,323 represents an important demand/support region on the chart. Previous price reactions from this area show that buyers have historically responded there.
If price returns to this zone, the reaction of the candles should be monitored carefully. A strong rejection plus bullish structure confirmation would provide more evidence of buyer participation.
9. Key Levels & Scenarios
Bullish scenario:
If price successfully holds the current structure and reclaims important resistance, the next major reference is around 82,167. A confirmed break and retest could open the way toward higher liquidity levels, with 90,269 acting as a major higher-timeframe reference.
Bearish scenario:
If price loses the 75,810 area with confirmed bearish structure, downside liquidity becomes relevant. The chart highlights 69,042 and then 64,323 as important lower reference zones.
Trading Plan
Do not enter based on a single candle alone.
Wait for liquidity + structure confirmation + displacement.
Use MSS/BOS/ChoCH as confirmation rather than prediction.
Respect the marked supply and demand zones.
Keep stop-loss placement logical and define risk before entering.
Avoid over-leveraging and avoid chasing large candles.
The marked targets are potential price levels, not guaranteed outcomes.
Note
This is a technical market-structure analysis for educational purposes and is not financial advice. Market conditions can change quickly, and every setup should be independently confirmed with proper risk management. Education