Long
Long
 Long
Long
 Long
Long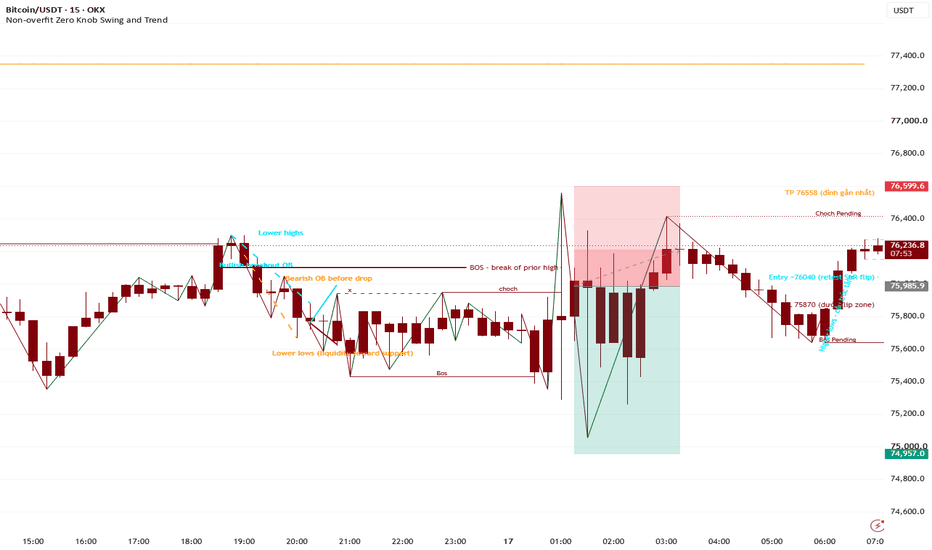
Why a Failed Senate Vote Wiped Out $500M in Crypto
A single failed Senate vote this week wiped nearly 4% of the entire crypto market's value , and over 500 million dollars in forced liquidations across the market in the hours that followed. Bitcoin fell. Ethereum fell. Chainlink, Aave, Bitcoin Cash, Aptos, Ethena- every major name fell, most of them with no company-specific news of their own at all. This wasn't a hack, scandal, or technical failure - this was a legislative procedure vote that didn't pass.
This article goes over exactly what happened, why leverage turns a political disappointment into a violent marketwide selloff , and why some coins fell far harder than others during the event.
What actually happened
The Senate failed to advance the CLARITY Act , a bill meant to set clearer regulatory rules for the crypto industry here in the US. Crypto markets had priced in progress toward this legislation, since regulatory clarity has been one of the biggest overhangs preventing broader institutional adoption for years. When the vote failed to advance the bill forward, that progress did not materialize, and the market reacted quickly. At the same time, rising odds of a Federal Reserve rate hike were already weighing on risk assets across the board. These two things - a disappointing regulatory outcome and rising expectations of tighter monetary policy - came together to form a single, sharp, risk-off move for the entire crypto market simultaneously.
Why a bill not passing crashes coins that have nothing to do with the bill
It's easy to confuse new traders as to why this happened. Chainlink, Aave, and Bitcoin Cash have entirely different use cases, teams, and fundamentals. None of them are directly regulated or affected by this specific legislation any more than any other token, but they all fell together, and several fell by more than Bitcoin did.
This happens because crypto assets become highly correlated during a risk-off event . During such a move, traders and funds don't sell their disappointing bet and keep holding everything else in their portfolios steady. They reduce risk broadly across their entire portfolio , because the source of the fear - a regulatory uncertainty or a macro tightening expectation - applies to the asset class itself, and not to any coin's specific fundamentals.
Why leverage turns a dip into a $500 million cascade
This is where the real damage multiplies. A large amount of crypto trading happens through leverage - that is, traders borrowing money to control a position bigger than their capital in order to magnify their gains. This works well while their prices march higher, but as soon as their prices start to fall by even a modest amount, the exchanges forcibly close, or liquidate, these leveraged positions to prevent the trader's losses from going beyond what they actually put up.
As prices began to fall from the failed vote, leveraged long positions across many coins hit their liquidation thresholds. Exchanges automatically sold those positions into a falling market, which further pushed prices down, and then triggered the next layer of liquidations at a slightly lower price, and so on. This is how a single piece of news, one that might have caused a modest orderly pullback on its own, ended up resulting in over 500 million dollars of forced selling within a matter of hours , none of it a voluntary action by the traders involved.
Why some coins fell so much harder than others
Looking at the actual figures during the event, Aave fell over 6% , Aptos fell nearly 8% , Bittensor fell nearly 8% , and Bitcoin - the largest, most stable crypto asset - fell by a noticeably smaller percentage.
This is because of something called beta , a measure of how much an asset tends to move compared to the broader market during a given event. Smaller, more speculative altcoins tend to carry higher beta than Bitcoin - that is, they tend to magnify any move the broader crypto market makes, in both directions. During a risk-off event like this, this higher beta works against the holders of these tokens, turning a moderate market-wide decline into a much sharper drop for these specific tokens. One analysis of Ethena's drop during this particular event specifically noted that the higher beta that Ethena typically has amplified what was a broad, macro-driven move, not something specific to the project.
The bigger pattern worth understanding
This is a signature you'll see repeatedly in crypto. A macro/regulatory headline hits . Broad, correlated selling begins across the entire asset class. Leveraged positions get forcibly closed , accelerating the initial move far beyond what the news itself would justify. Higher beta, more speculative tokens fall hardest , and larger, more established assets fall by comparison less, even though everything falls together.
Recognizing this signature is important because it tells you that a sharp, broad selloff like this one isn't necessarily a judgment on any given individual project's fundamentals. It's often a mechanically-driven reaction to a single piece of news that happens to have occurred at a time when a large amount of leverage was sitting in the market.
How to actually think about this as a trader
Check if a crypto selloff is broad-based across unrelated tokens or concentrated in one coin, because a broad, correlated move implies a macro/regulatory trigger amplified by leverage, and not project-specific bad news.
Pay attention to overall market leverage levels - sometimes visible around open interest and funding rates - because elevated leverage leading up to a known event can increase the odds that a disappointing outcome gets amplified into a much larger cascade than the news alone would justify.
Remember that higher-beta altcoins will almost always move more than Bitcoin during both broad rallies and selloffs, so if you're holding small altcoins through a known event risk, you are essentially accepting amplified moves in both directions.
Watch for the immediate aftermath of a liquidation cascade rather than only the initial drop, because these events can cause sharp, temporary overshoots to the downside as forced selling clears out, followed by a partial recovery once the leveraged positions causing the extra selling pressure have already been liquidated.
My Conclusion
A failed vote in Washington wiped out half a billion dollars in crypto positions within hours , and most of the coins' falls in the selloff had absolutely nothing to do with the bill itself. This is the nature of a leveraged, highly correlated market - a single piece of disappointing news doesn't just move the asset it's actually about, but it can cause a mechanical cascade across an entire asset class , hitting hardest wherever the most leverage and highest beta happen to be.
Thank you
@VertexQore Education 
Long 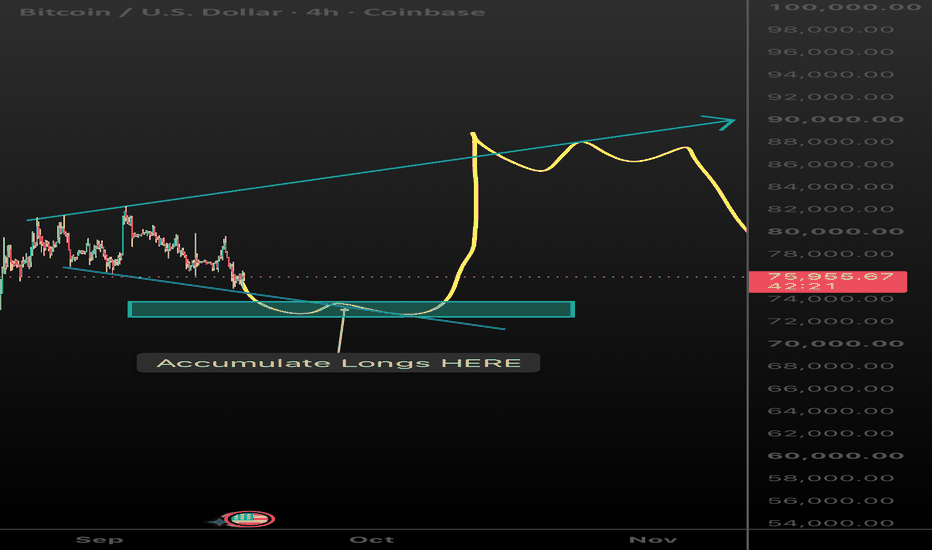
Short 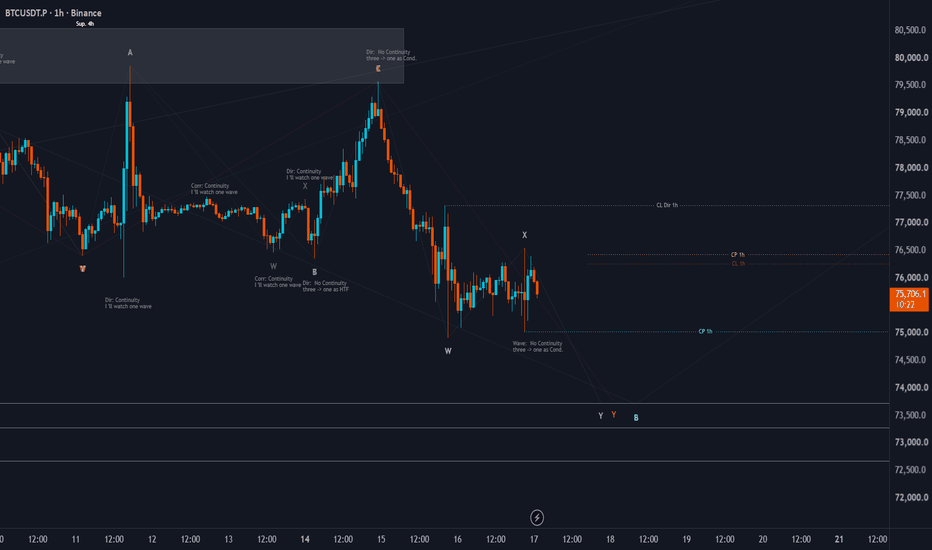
XRP Takes a Hit Fed Hikes & CLARITY Fails, But Are We panicking?👋 Hey everyone, hi and thanks to my fellow rocks for joining in as always! Today we are diving into some intense price action for XRP following a chaotic 24 hours in Washington and macroeconomics, so let's break down exactly what is happening to the charts and what it means for our portfolios. As always, thanks for tuning in with me.
🚨 The U.S. cryptocurrency market faced dual headwinds as the Senate rejected the CLARITY Act in a 49-50 vote, failing to reach the 60-vote threshold required to pass. Simultaneously, the Federal Reserve announced a 25-basis-point interest rate hike, bringing the benchmark rate to a target range of 3.75% to 4%. These developments triggered a broad digital asset selloff, with XRP sliding roughly 10% to trade near the $1.28 level.
📉 Looking straight at the technicals, XRP took a sharp 10% tumble down to around $1.28, completely erasing its recent upward momentum. The immediate focus for bulls right now is holding the line at the critical 50-day moving average, which sits right around $1.21. If we get a daily close below that level, things could get messy with a potential slide down toward the downside support zones near $1.10 or even $0.88, while key overhead resistance remains heavy near the $1.39 to $1.45 range.
📉 Our next technical is that descending channel which we've already been watching in previous ideas. Was helping us out but once we lost our grip it became a resistance rather than a support and following that last re-entry into the channel we managed to break out the channel though that was thanks to sentiment and hype before the clarity act decision. Can see just what kind of impact the clarity act had on the 15th following the news as we quickly exited the channel and saw a steep drop in much of the crypto market and XRP.
🏛 Beyond the charts, the real drivers behind today's flush are coming from major fundamental and macroeconomic shifts. First, the crypto-specific blow landed when the Senate held a procedural vote on the CLARITY Act, which fell short of the 60-vote threshold in a tight 49-50 split, effectively shelving comprehensive federal crypto market regulations for the near future. On top of that, Fed Chairman Kevin Warsh and the FOMC delivered a hawkish surprise by unanimously voting to raise interest rates by 25 basis points to a 3.75%–4% range, marking the first rate hike since 2023 and adding immense macro pressure to all risk assets. We already understand the market favors low interest rates so this definitely is something to keep in mind.
💡 But before anyone panics, we have to look at the silver lining that sets XRP apart from the rest of the crypto market. While the failure of the CLARITY Act hurts industry-wide regulation, XRP already stands on settled legal ground because of its landmark 2023 court victory and the subsequent March 2026 joint interpretation by the SEC and CFTC classifying it as a digital commodity. With five spot XRP ETFs actively trading in the U.S. and institutional plumbing adopting the token, today’s crash is a short-term reaction to legislative delays and a hawkish Fed, rather than a threat to XRP's underlying legal status.
✨ That wraps up today's analysis, and I want to give a massive thanks to everyone for tuning in and staying on top of these wild markets with me. If you found this breakdown helpful, please make sure to leave a like and follow for more daily updates so you never miss a beat—stay safe out there, and I'll catch you in the next one!
Best regards,
~ Rock '  Short
Short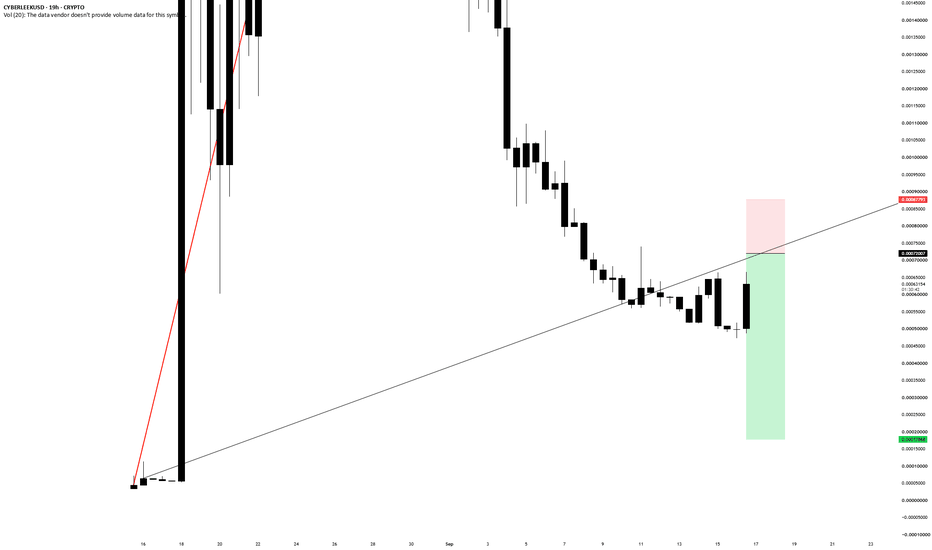
Bitcoin Macro Update: Dual-Scenario Framework & The 2023 FractalI jumped the gun...
Images Below...
Sell-side pressure from both monetary policy (a hawkish 25 bps Federal Reserve rate hike) and regulatory friction (Senate gridlock on the CLARITY Act alongside ongoing SEC enforcement overhang) has accelerated market volatility. High-timeframe market structure points to a structural higher-low retest, where both primary trading scenarios converge on the same execution floor.
---
### 📊 Dual-Scenario Cycle Framework
**Scenario A: Macro 2023 Fractal Roadmap (4-Stage Sweep Sequence)**
* 📉 **Stage 1 — The Bull Trap & Dynamic WMA Flush ` `:** Price drops lower to flush overleveraged longs, currently hovering directly over dynamic **SHM 63 WMA support ($75,000–$76,000)**. This localized drop acts as a bull trap, convincing weak hands that market structure has broken down before the next rotational move.
* 🐻 **Stage 2 — The Bear Trap & Range-High Sweep:** A sudden upward pivot tricks overconfident bears who opened short positions at the WMA. Bulls regain full market control, triggering a rapid short squeeze that sweeps liquidity above the previous **$82,800–$84,000 range highs**.
* 🎯 **Stage 3 — Post-Sweep Golden Zone Reset:** Having captured liquidity at the highs, price pulls back once more to perform a deep structural test of the **0.50–0.74 Golden Zone ($71,000–$72,000)**, holding dynamic **CIMA MA support** to establish a rock-solid macro higher-low.
* 🚀 **Stage 4 — Parabolic Macro Breakout:** Defense of the dynamic CIMA floor resolves all range consolidation, launching price into blue-sky price discovery toward **$100,000+**.
**Scenario B: Direct 4-Stage Liquidation Flush**
* ⚡ **Stage 1 — Immediate Golden Zone Flush ` `:** Bypasses the Stage 2 overhead sweep entirely, executing an uninterrupted liquidation drop from current levels directly into the **$71,000–$72,000 Golden Zone** (0.50–0.74 retracement + CIMA support).
* 🏛️ **Stage 2 — Institutional Base:** Absorption of sell-side pressure driven by SEC Chairman Paul Atkins' proposed **Regulation Crypto Assets** framework, establishing a tight accumulation floor.
* 📈 **Stage 3 — Bear Liquidation & SHM Reclaim:** Reclaim of the SHM 63 WMA traps overextended shorts and converts dynamic resistance back into support.
* 🎯 **Stage 4 — Parabolic Price Discovery:** Expansion beyond the $82,800–$84,000 ceiling directly toward **$100,000+**.
---
### 🏛️ Macro Drivers: Dual Sell-Side Pressure vs. Executive Offset
* 🦅 **Federal Reserve Monetary Tightening:** Today's 25 bps rate hike and upward dot-plot revision to 4.1% apply systematic discount-rate pressure across all high-beta risk assets, compressing liquidity.
* 📜 **SEC & Legislative Friction:** Congress failing to pass the CLARITY Act alongside persistent SEC regulatory enforcement actions reinforces short-term sell-side headwinds.
* ⚖️ **Executive Agency Offset:** SEC Chairman Paul Atkins' proposed **Regulation Crypto Assets** framework—offering fit-for-purpose token exemptions and an investment contract safe harbor—provides agency-level regulatory clarity. Institutional capital is positioned to leverage this executive framework to absorb sell-side volume inside our demand floor.
---
### 🛠️ Execution Strategy & Buy Confirmation Rules
Price may temporarily drop through the **SHM 63 WMA** during a high-volatility flush. **Do not front-run the dip.** Long entry exposure requires price to push back up through the 63 WMA using one of three systematic triggers:
1. 🟢 **Reclaim + SHM BUY Signal:** Price reclaims the SHM 63 WMA and triggers an official indicator BUY signal.
2. 🕯️ **Full Candle Close Above 63 WMA:** A 4H or Daily candle closes firmly above the SHM 63 WMA.
3. 🔄 **Break & Retest Hold:** A clean breakout above the SHM 63 WMA followed by a successful retest that holds as new dynamic support.
---
### 🗺️ Strategic Liquidity Roadmap
* 🛡️ **$75,000 – $76,000 (Dynamic WMA Defense):** **Scenario A: Stage 1 ` **`. Initial Bull Trap zone. Monitor for order flow absorption and price hovering over the SHM 63 WMA to confirm local seller exhaustion.
* 🎯 **$82,800 – $84,000 (Bear Liquidation Sweep):** **Scenario A: Stage 2 Target**. Primary short-trap ceiling; key target for taking partial profits on Stage 2 impulse legs before any secondary Stage 3 reset.
* 📥 **$71,000 – $72,000 (0.50–0.74 Macro Floor):** **Scenario B: Stage 1 ` ` / Scenario A: Stage 3 Target**. High-conviction re-accumulation anchor where dynamic CIMA support and deep Fib retracement levels align for institutional absorption.
* 🚀 **$100,000+ (Blue-Sky Price Discovery):** **Scenario A & B: Stage 4 Target**. Parabolic macro expansion target upon defense of the dynamic CIMA floor and clean breakout above range-high resistance.
---
### 🚨 Macro Invalidation & Full Bull Failure
If price fails to hold **$71,000** on a daily closing basis, loses dynamic CIMA moving average support, and triggers an official indicator **SELL signal**, the entire bull thesis is fully invalidated. This combination signals a transition from a corrective re-accumulation dip into a high-timeframe bear market distribution.
⚠️ **Disclaimer:** *This update is for educational and technical analysis purposes only and does not constitute financial, investment, or trading advice. Any and all financial assets are subject to market volatility and carry substantial financial risk. Always perform your own research, manage risk appropriately, and consult a certified financial advisor before making any investment decisions.* Short 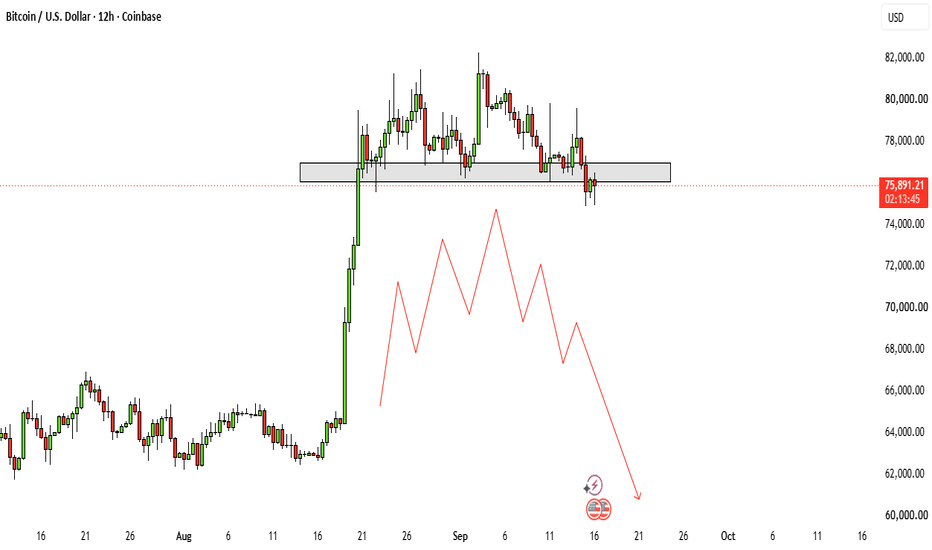
Bitcoin Falls $76,000 After Senate Rejects CLARITY Act MotionBitcoin dropped below $76,000 on Sept. 15 after the Senate rejected a motion related to the CLARITY Act, but the timeline of the decline shows that the cryptocurrency was already under pressure before the vote took place. Bitcoin hit an intraday low of $74,967.97 during the session. It had already fallen below $76,000 before the Senate tally, meaning the political disappointment in Washington did not start the sell-off. Instead, it arrived while the market was already moving lower.
The broader altcoin market also weakened during the same period. The altcoin market capitalization tumbled 3.6%, though it managed to remain above $1.15 trillion. That decline shows that the pressure was not isolated to Bitcoin. It spread across the wider digital asset market, affecting risk sentiment more broadly. Even so, the fact that the altcoin market cap held above $1.15 trillion suggests that the sell-off, while notable, did not immediately turn into a deeper capitulation event.
Traders were also preparing for a Federal Reserve decision, which added another source of pressure across risk assets. When investors are waiting on a major central bank announcement, they often reduce exposure to speculative assets, and crypto is frequently among the first areas to feel that de-risking. That pre-Fed caution likely contributed to the softer tone in Bitcoin and altcoins before the Senate vote even became the focus. In other words, the market was already dealing with macro uncertainty, and the political news landed on top of an existing pullback.
The chronology matters because it changes how the Senate vote should be interpreted. It supports describing the rejection of the CLARITY Act motion as one factor in the afternoon weakness, but not as the origin of the full-day decline. The vote may have worsened sentiment or accelerated selling during a specific window, but it was not the sole cause of Bitcoin’s move below $76,000. The market was already vulnerable, already cautious, and already leaning defensive ahead of the Fed.
Bitcoin Absorbs Initial Pre-Fed Sell-Off, Leaving $70,000 as a Critical Test
Bitcoin has so far absorbed the initial pre-Fed sell-off, but that resilience does not mean the risk has passed. The next major test is whether a hawkish Fed can push BTC through the $70,000 support zone and materially damage the August recovery. That level has become a key technical and psychological marker. If Bitcoin holds above it, the market may treat the recent decline as a normal pullback within a broader recovery. If it breaks below it, the damage could be more significant, potentially undermining the gains that were built during August.
The $70,000 zone is important because it represents a line between a healthy correction and a deeper trend reversal. A hawkish Fed decision could strengthen the dollar, push yields higher, and reduce appetite for risk assets, all of which would pressure Bitcoin. In that scenario, sellers might test the $70,000 support with greater force. If that support fails, the market could begin to question whether the August recovery was sustainable or whether it was simply a temporary bounce within a larger downtrend.
On the other hand, if Bitcoin continues to absorb pre-Fed selling and holds above $70,000, it would suggest that buyers are still willing to step in at lower levels. That would not eliminate the risk of further volatility, but it would signal that the market still has a foundation to build on. The August recovery would remain intact, and the recent drop below $76,000 would look more like a shakeout than the start of a sustained decline.
For now, the situation is best described as a market under pressure but not yet broken. Bitcoin’s decline began before the Senate rejected the CLARITY Act motion, and the Fed decision remains a larger macro driver. The vote added to the afternoon weakness, but it did not create the full-day sell-off. The critical question ahead is whether Bitcoin can defend $70,000 if the Fed takes a hawkish stance. If it can, the recovery may survive. If it cannot, the market could face a much more serious test of its recent gains. Short 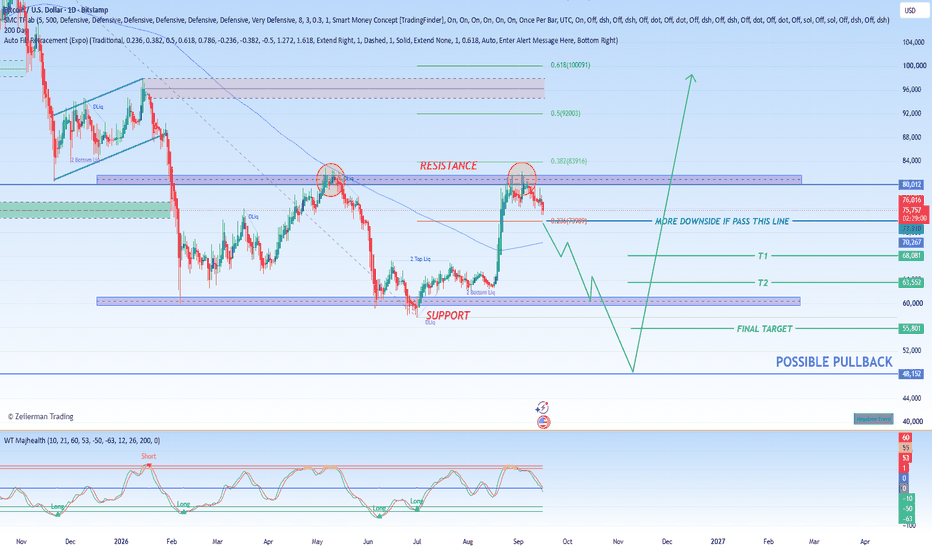
 Short
Short
BTCUSDT: Bearish Drop to 71000?As the previous analysis worked exactly as predicted, BINANCE:BTCUSDT is eyeing a bearish reversal on the 1-hour chart after testing a clear resistance zone near equal highs and the greed area, converging with a potential entry zone that could trigger strong downside momentum toward the cumulative long liquidation zone if sellers take control amid volatility. This setup offers an exceptional risk-reward of nearly 1:10 .🔥
Entry between 81500–82000 (entry from current price with proper risk management is recommended). Target at 71000 . Set a stop loss at a 4-hour close above 82500 , yielding a risk-reward ratio of close to 1:10 . Monitor for confirmation via a bearish candle close below entry with rising volume.🌟
Note : This trading setup carries high risk due to the US Non-Farm Payrolls (NFP) report being released today. Always manage your capital carefully.
⚠️ Active risk management is essential for this setup. I am monitoring this position in real-time as the structure evolves. For further updates and daily analysis, feel free to check my profile bio.
📝 Trade Setup
🎯 Entry (Short):
81,500 – 82,000
(Entry from current price is acceptable with proper position sizing and strict risk management.)
🎯 Target:
71,000
❌ Stop Loss:
4H close above 82,500
📈 Risk-to-Reward:
Close to 1:10
Will sellers defend 81,500–82,000 and trigger a move toward 71,000, or will BTC break above the resistance zone and invalidate the bearish setup? 👇 Short 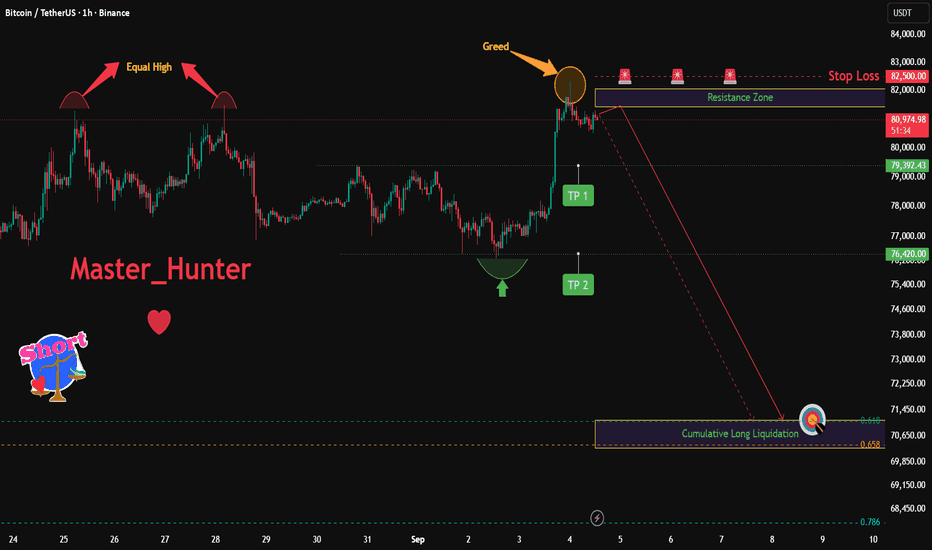
Bitcoin 4-Year Supercycle Begins | Positive Rate Hike Signal!!First, I want to explain the 4-year cycles. You may have heard many explanations like this across the internet, but this one is different...
Years of my research have shown me that after each halving, the best time to sell is around Day 543, while Day 373 marks the time to start buying and accumulating. This system has worked better for long-term holders than any other system I have studied.
But what makes this analysis different?
In previous cycles, there were three important criteria: Bitcoin had to move above the Short-Term Holder Realized Price, move above the 50-week moving average, and our Supertrend had to generate a bullish signal.
However, we are gradually seeing changes in both of the last two cycles.
In the 2023 cycle, even though the Supercycle had already started, the Federal Reserve raised interest rates four more times.
Interestingly, at the beginning of the 2026 cycle, two changes have appeared that are very similar to the previous cycle. The U.S. Federal Reserve has started raising interest rates again, which is extremely interesting.
The second change is that the Supercycle has started earlier than Day 373.
Now we have to ask: Why?
The reason is very clear.
On-chain, there is an indicator called Accumulation Trend Score / Accumulation Holders. These are holders who mostly buy, sell very late, or never sell at all. Throughout this cycle, as time progressed, this group continued accumulating more and more Bitcoin and even reached new highs in terms of their holdings.
The second factor is ETFs and companies. They have still not significantly retreated from Bitcoin. They have remained in the market and continued to hold.
The third factor is very interesting.
Almost the entire social media space believed that the market had to experience one final wave of downside during the bear market. And while that idea is completely understandable, there is one major flaw in it.
In previous cycles, retail investors and even so-called tourist investors often ignored this possibility. But with the growth of social media and the increasing awareness of Bitcoin cycles, large market participants were able to catch these participants off guard.
They did not want to allow weak hands to enter the market alongside them.
The plan changed, creating a major shakeout for these participants. If I were in their position, I would probably follow the same approach. I would not want to carry weak hands with me into the next major phase of the market.
I am absolutely not telling you to buy Bitcoin based on this analysis.
However, I believe that sooner or later, this price correction and the supply-side inflationary pressure created by the Iran–U.S. conflict around the Strait of Hormuz will come to an end.
When oil eventually falls from its highest levels, the Federal Reserve may be forced to cut interest rates aggressively, and it may even have to resort to Quantitative Easing. Otherwise, the economy could face a recession.
At the moment, most of the demand for Bitcoin is coming from outside the United States.
But the day we see significant demand coming through the Coinbase Premium and the indicator turns positive, the price action could become very interesting.
This analysis is not financial advice.
Thank you,
Mr. Ghasemi Long 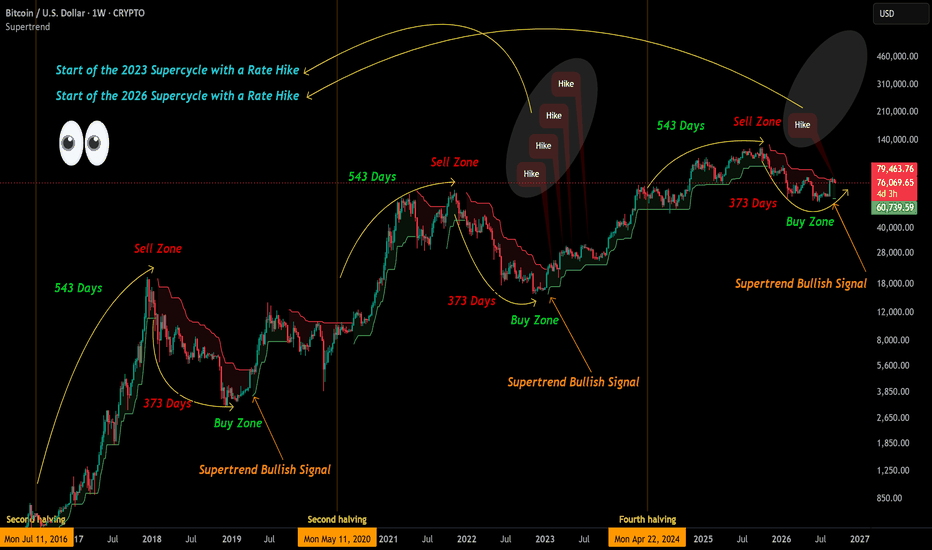
SOL/USDT — Bull Flag Setup (4H analysis, 1H execution · Spot)
Analysis is on the 4H: price ran a strong pole from the ~74 HL and is now consolidating in a bull flag near the highs. Execution is on the 1H for a tighter entry. Scenario 1 (primary): once the 4H confirms a break above the upper flag line, ideally with RSI reclaiming 50 and the Alligator opening up, I take the long on the 1H. Stop sits below the previous HL / lower flag line, or under the Alligator once it is confirmed. Scenario 2 (if the flag fails and price breaks down): watch the 0.5-0.618 fib zone (~92-87) for a bounce, entering only on a confirmed reaction such as bullish divergence or a reversal candle, at smaller size since it's the lower-conviction setup. Risk is fixed per trade; stops move to break-even and trail under structure as price advances, with targets extended to the next structural level. This is a spot, not a future. Momentum is currently soft (RSI ~40, Alligator bearish), so patience for confirmation is key.
Not financial advice.
 Long
Long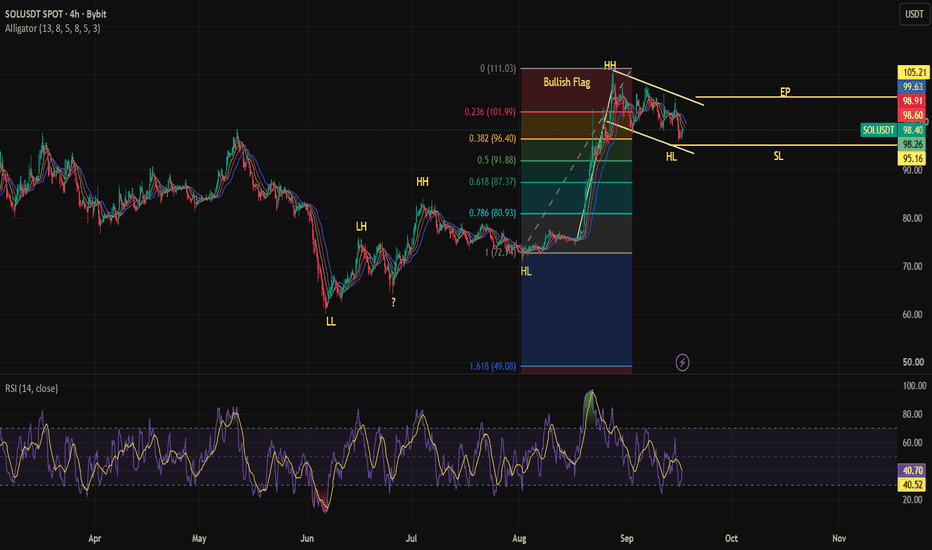
 Long
Long
ETH: Why This Range Trade Still Favors the BullsWhile the S&P, Nasdaq, and Dow sold off following this week's FOMC rate decision, Ethereum held firm. That divergence is a signal.
In this breakdown we walk through our two foundational tools, Previous Period High/Low/Mid/Close and PriceMap, to build and stress test a market thesis in real time.
Price is holding above its monthly directional, the classic pivot that defines trend bias. With the R level sitting beneath the market, sentiment reads bullish. As long as the R level acts as a support floor rather than flipping to a resistance ceiling, the uptrend structure stays intact.
The near term trigger is the previous week's low. Holding above it, even as broader risk assets sell off, signals underlying strength and keeps the bull case alive. Losing it doesn't kill the thesis, it just shifts the read toward the deeper monthly R level as the next area to reassess risk.
Bottom line: this isn't about calling a breakout. It's about knowing exactly where the thesis breaks, and trading with that clarity instead of the noise.

SMC vs ICT — What’s the Difference? SMC (Smart Money Concepts) and ICT (Inner Circle Trader) are closely related approaches to understanding how price moves, liquidity is created, and where potential trading opportunities may appear. They share many concepts, but their terminology and overall approach can differ.
🔹 SMC — Smart Money Concepts
SMC mainly focuses on market structure and price behavior.
Important SMC concepts include:
• Market Structure — Higher Highs (HH), Higher Lows (HL), Lower Highs (LH), and Lower Lows (LL).
• BOS (Break of Structure) — a break that can indicate continuation of the existing structure.
• CHOCH (Change of Character) — a potential indication that market structure is changing.
• Liquidity — areas where stop orders may be concentrated, such as equal highs and equal lows.
• Order Blocks — price areas traders may watch for potential reactions.
• FVG (Fair Value Gap) — an imbalance created by strong price movement.
SMC can therefore be used to build a broader view of structure, liquidity, and potential reaction zones.
🔹 ICT — Inner Circle Trader
ICT is a trading methodology developed by Michael J. Huddleston. It also uses liquidity and market-structure concepts, but places significant emphasis on time, sessions, price delivery, and specific entry models.
Common ICT concepts include:
• Liquidity Pools — areas around important highs and lows.
• Liquidity Sweep — price temporarily taking liquidity before potentially reversing or continuing.
• Kill Zones — specific time windows that traders watch for increased activity.
• Fair Value Gaps (FVGs) — imbalances that can become areas of interest.
• PD Arrays — a group of price-delivery concepts used to identify potential areas of interest.
• Session Highs & Lows — important levels from Asian, London, and New York sessions.
• Displacement — strong price movement that can provide confirmation of a shift in price delivery.
📌 Simple Example
Imagine price is moving upward and creates a series of Higher Highs and Higher Lows.
An SMC trader may focus on:
Liquidity → BOS → Order Block → FVG → Entry
An ICT-style analysis may add another layer:
Session timing → Liquidity sweep → Displacement → FVG/PD Array → Entry
The exact setup depends on the trader’s model and rules.
⚡ Key Difference
SMC: More commonly presented around market structure, liquidity, Order Blocks, FVGs, BOS, and CHOCH.
ICT: Uses many overlapping ideas but places additional emphasis on time, sessions, liquidity delivery, PD Arrays, and specific execution models.
🧠 Final Takeaway
SMC and ICT are not completely separate worlds. There is substantial overlap between the concepts used in both approaches. The main difference is often how the concepts are organized, defined, and applied.
The goal should not be to memorize every term. First understand market structure → liquidity → displacement → imbalance → confirmation → risk management. Education 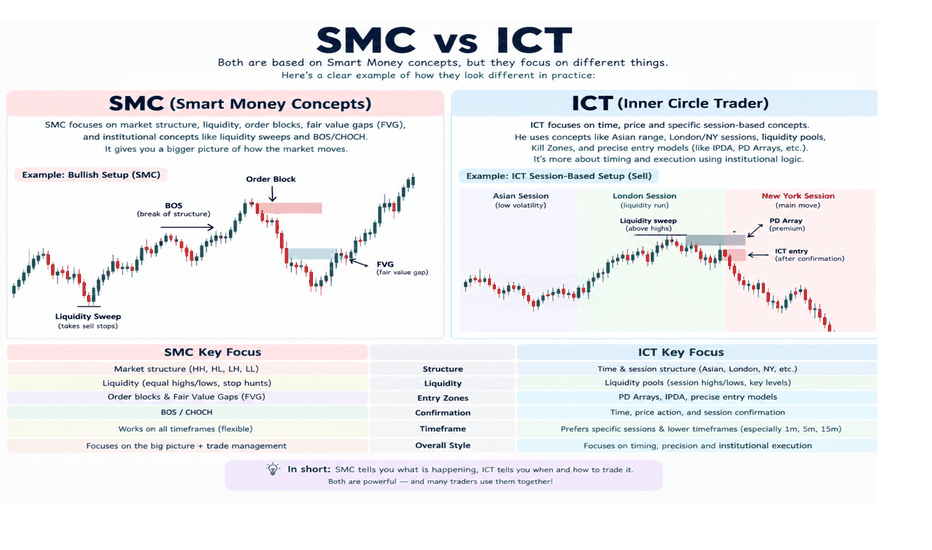
TradeCityPro | Bitcoin Daily Analysis #367👋 Welcome to TradeCity Pro!
Let’s take a look at Bitcoin. The interest rate decision was released today, and we can now see how price reacted to the news.
⌛️ 1H Timeframe
On the 1-hour timeframe, Bitcoin is attempting to establish a close below 76,630. After breaking this support, price is currently reacting to the 75,440 level.
⛏ Today’s interest rate news did not have a significant impact on Bitcoin. Price simply formed a Doji candle, and we can now say that the news-driven volatility has faded.
⭐ If the 75,440 level breaks, we can look for a short position. A break of this level could initiate a new bearish move.
✨ On the other hand, if price manages to reclaim 76,630, the bullish move could resume, and we can look for a long trigger.
❌ Disclaimer ❌
Trading futures is highly risky and dangerous. If you're not an expert, these triggers may not be suitable for you. You should first learn risk and capital management. You can also use the educational content from this channel.
Finally, these triggers reflect my personal opinions on price action, and the market may move completely against this analysis. So, do your own research before opening any position. $7,000 Ether & Why (the New All-Time High!)This is why!
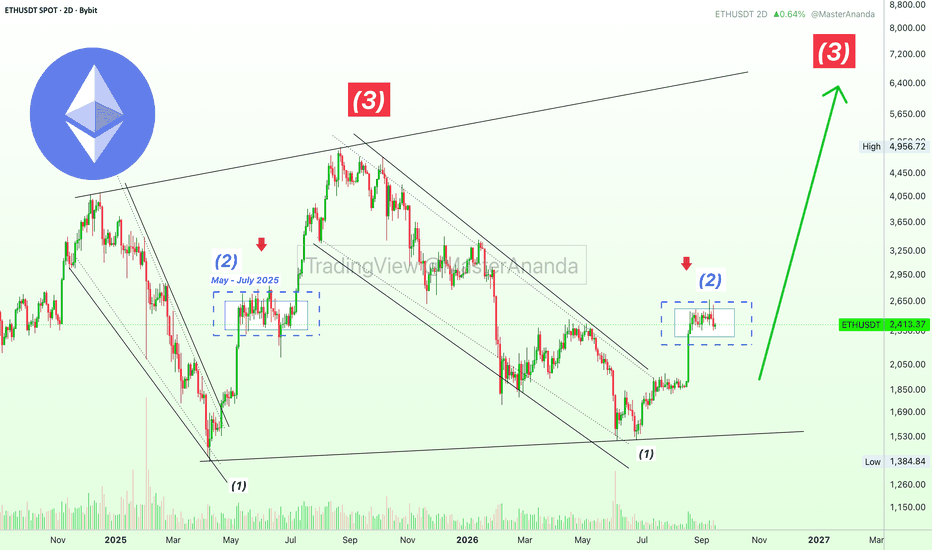
Now I see a repeat of the May-July 2025 bullish consolidation period, it is the exact same but much better of course.
ETHUSDT started to rise then went sideways, then nothing is happening now.
Where is the market headed next?
Here I am calling for a bullish continuation and for obvious reasons.
Why would ETH produced a long-term higher low (June 2026 vs April 2025) to start rising just to produce a lower low next?
Support has been confirmed and fully established, a new and higher long-term support base. The market does this in order to reach new highs, to go much farther. Higher support, higher challenges on the way up. We are headed for a new all-time high.
ETHUSDT is trading below MA200 on the 2D timeframe. At the same time, the action is happening above EMA89 and EMA144, both of these support long-term growth.
As long as ETHUSDT 2D trades above EMA144 & EMA89 ($2,300 & $2,180), we can consider this chart setup hyper-bullish.
While the market can be expecting a long-term resolution to the current state of affairs, it can happen that growth starts within days or weeks rather than months as it happened back in 2025.
This time, plenty of accumulation is present at the bear market bottom. This period of accumulation can in turn reduce the need for a prolonged duration to the current consolidation phase.
All doubt has been removed. The numbers are out. The news is already old.
Now that everything is out of the way, regardless of the results and expectations, the Cryptocurrency market will continue growing for sure! (?)
We are going up and this is truly only the start. From the bottom we grow.
Thanks a lot for your continued support, it is appreciated.
Namaste.  Long
Long