SUSHI: The Setup Is BackA few days ago , we were watching SUSHI from a corrective wedge and the idea was simple: let the correction finish and wait for the market to show its hand.
Now, after several days, SUSHI is showing almost the same behaviour again.
Price is compressing inside another short-term flag, and this gives us two possible ways to approach the setup.
The first one is the cleaner breakout scenario.
If the green flag breaks to the upside, I want to see the breakout hold and preferably get a retest before considering the continuation. This would confirm that buyers are taking control again rather than simply producing another temporary spike.
The second scenario is a pullback.
If price reaches the marked pullback zone and gives us a clear rejection, liquidity sweep or bullish price-action signal, that can also become a valid entry area.
So I'm not interested in predicting which one happens first.
Break the flag and confirm it — or pull back into the zone and show strength.
Trading Setup
Long Scenario 1 — Flag Breakout
Break above the green flag → confirmation/retest → continuation.
The important point is to avoid buying the first aggressive candle without confirmation.
Long Scenario 2 — Pullback
Price returns to the marked PB zone → rejection / bullish price action → potential long entry.
This would give us a better-defined risk compared with chasing the breakout.
Targets
Short-term target: approximately +40%
This level also lines up with the 200% Fibonacci extension of the previous wave, which makes it an important area to watch for the first major reaction.
Mid-term target: 200% Fibonacci extension of the current wave
Extended mid-term target: 300% Fibonacci extension of the previous wave
The Fibonacci levels are not guarantees. They are simply areas where I expect the market to potentially slow down, take profit or react.
Why SUSHI is interesting right now
There is also a meaningful fundamental change behind Sushi.
SushiSwap recently began weekly SUSHI purchases for its Strategic Reserve after the program received governance approval. The purchases started on September 7, while monthly xSUSHI buybacks are scheduled to begin in October. The exact size of the weekly purchases has not been disclosed, so the actual market impact remains uncertain.
Sushi has also continued expanding its infrastructure across different chains. Recent developments include its integration of USDT0 on Stellar, as well as expansion of its Launch platform to Robinhood Chain.
This matters because SUSHI is not only moving on a technical chart. There is an ongoing effort to increase the protocol's reach and create additional sources of trading activity and liquidity.
At the same time, Sushi remains part of a very competitive DEX market, so increased deployment does not automatically translate into sustained token demand.
That's why I still want the chart to confirm the trade.
What I am watching now
The interesting part is that the market is giving us another chance to build the setup instead of chasing the previous move.
For me, the roadmap is clear:
Flag breakout + confirmation → long
or
Pullback into the zone + rejection → long
If neither happens, there is no reason to force the trade.
The first major objective is around 40%, and the following Fibonacci extensions give us the mid-term roadmap.
I will keep updating this idea as SUSHI reaches the marked levels or if the structure changes.
Save the chart. The setup is developing again.
Risk Warning: This is educational market analysis, not financial advice. SUSHI and the broader crypto market can be highly volatile. Fibonacci targets are potential reaction areas, not guaranteed price objectives. Always define your invalidation and position size before entering a trade.  Long
Long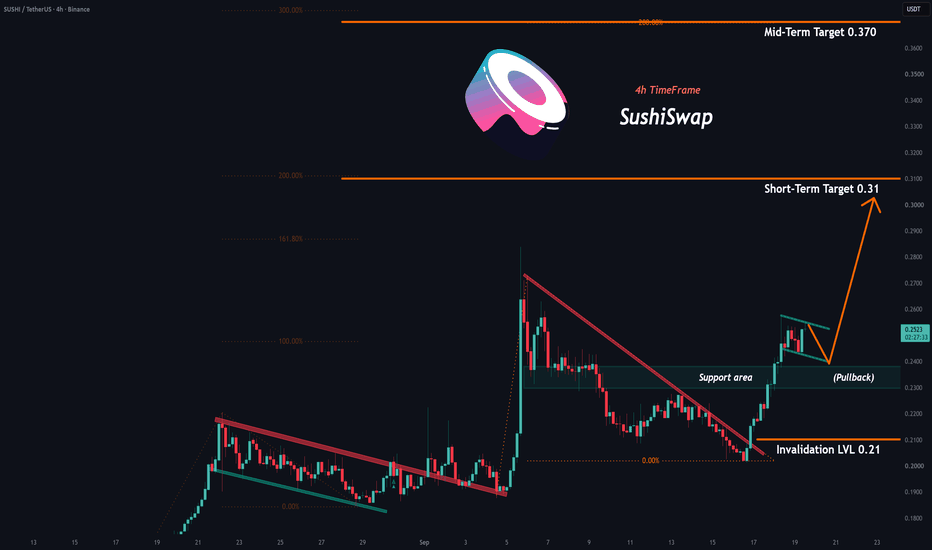
 Education
 Long
Long
 Long
Long
Long 
 Long
Long
 Short
Short
 Long
Long
BTC/USD Short Setup: Bearish Rejection from Sell ZoneBTC/USD 15-Minute Technical Analysis
Bias: Bearish below 81,413–81,488
Sell zone: 81,413–81,488 — marked supply/resistance area. A rejection here would support the short setup.
Stop loss: 82,617–82,636 — above the recent resistance/liquidity area. A sustained break above this zone would invalidate the bearish idea.
First downside area: 80,000–80,200 — important support and a likely reaction zone.
Main target: 78,080–78,014 — larger downside target shown on the chart.
Price action
BTC is trading around 81,280, currently below the proposed sell zone. The chart shows price moving inside an ascending channel, but the marked resistance/supply zone creates a potential rejection point.
For the short setup, ideally wait for price to retest 81,413–81,488 and show bearish rejection rather than selling immediately at the current price.
Invalidation: A strong 15-minute close above the 82,617–82,636 stop area would weaken the bearish setup.
Risk note: The move from the entry zone to 78,080 is large, so the position size and risk should be managed accordingly. Short 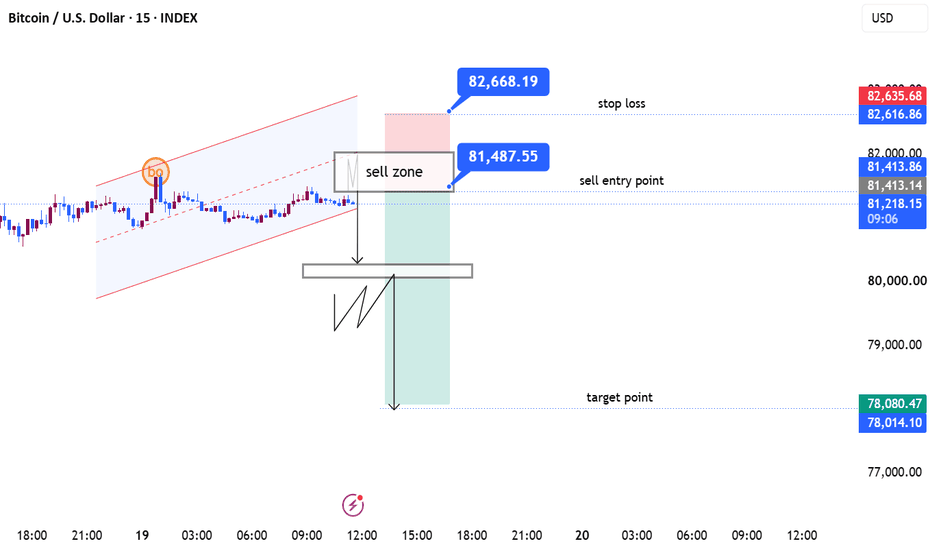
 Long
Long
 Long
Long
ZIGChain (ZIGUSD): The Structure Is Starting to ResolveMarket Overview
ZIGChain (ZIG) is trading around $0.05384, following a sharp rebound from the $0.027428 invalidation area.
The daily chart is now approaching an important structural test. Price has completed a substantial corrective decline from the 2025 highs, and the current setup is tracking a potential new impulsive phase.
The key question is whether the recent recovery can develop into the next larger-degree wave.
Fundamental / News Catalyst
There is a meaningful current catalyst for ZIG.
ZIGChain recently announced infrastructure for a $100 million tokenized private-credit fund, adding another institutional real-world-asset use case to the network. CMC's September 11 update highlighted the launch as a major development for ZIGChain's RWA infrastructure.
The network also underwent its v4.3.0 upgrade on September 17, with Bybit supporting the upgrade while temporarily suspending ZIG deposits and withdrawals during the transition.
The market response has been notable. ZIG gained more than 21% on September 18, moving from around $0.042 to above $0.051, while trading volume also increased.
The fundamentals provide a current narrative, but the chart still determines whether the larger wave structure is confirmed.
Technical Analysis
The chart shows ZIG coming out of a prolonged corrective structure that began after the 2025 peak.
The recent low around $0.027428 is explicitly marked as the invalidation of the recent upside. From that low, the chart has developed an initial impulsive advance followed by a smaller corrective sequence.
The immediate upside reference is $0.125323, identified as the lower-time-frame Wave 3 target.
However, the more important structural confirmation sits higher at $0.179411.
A move through $0.179411 would confirm the chart's higher-target interpretation and strengthen the case for the larger projected structure.
If the current count eventually terminates as Wave C, the chart gives a target around $0.495960.
If instead the count develops as Wave 3, the larger projected target is $11.711809.
These are alternative structural outcomes, not simultaneous targets.
The current price therefore remains relatively early in the projected structure, with confirmation still required before the higher-degree targets become active.
Key Levels
$0.179411 — confirmation of higher targets
$0.125323 — lower-time-frame Wave 3 target
$0.05384 — current price
$0.027428 — invalidation of recent upside
$0.495960 — Wave C target
$11.711809 — Wave 3 target if that count develops
Bullish Scenario
ZIG continues to build from the recent low and eventually clears $0.179411. That would confirm the higher-target interpretation and bring the larger projected levels into consideration.
The first major projected objective on the current lower-time-frame structure is $0.125323.
Bearish Scenario
The recent recovery fails and ZIG breaks below $0.027428. That would invalidate the recent upside structure and require the current count to be reassessed.  Long
Long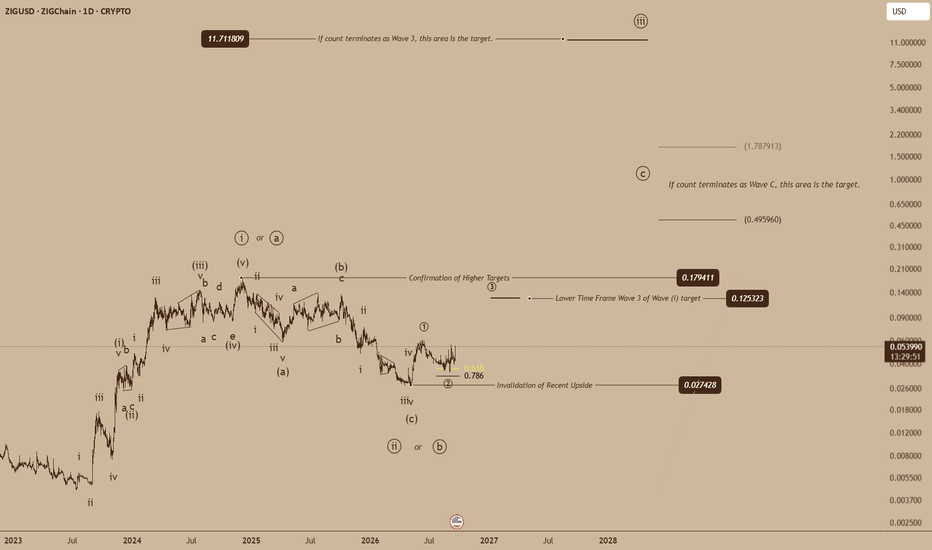
 Long
Long
 Long
Long
WAL - Descending Trendline, Breakout?📊 Technical Analysis — WAL/USDT
⏳ Time Frame: 3D
📍 Current Price: ± $0.0315
📐 Pattern: Descending Trendline / Downtrend Structure
🎯 Key Resistance: $0.0350
🟡 Upside Levels: $0.0680 → $0.0890 → $0.1160 → $0.1650
🔻 Major Support: ± $0.0270 → $0.0200
---
📐 PATTERN — DESCENDING TRENDLINE
🔻 The WAL/USDT chart shows a clear downtrend structure, characterized by a series of Lower Highs connected by the descending yellow trendline.
📉 As long as the price remains below the Descending Trendline, bearish pressure remains dominant from a structural perspective.
However, there is an interesting development in the recent price action:
🟢 Price has started to rebound from the low area around $0.0200.
🟢 A recovery has developed toward the $0.0315 area.
🟡 Price is now approaching the Descending Trendline and the horizontal resistance at $0.0350.
➡️ Therefore, the $0.0350 + Descending Trendline area becomes a very important zone in determining whether WAL can achieve a structural shift or experience another rejection.
---
🟢 BULLISH SCENARIO — BREAKOUT 🚀
📈 The bullish scenario becomes more interesting if WAL manages to:
1️⃣ Break above the Descending Trendline with a strong 3D candle.
2️⃣ Break through and hold above $0.0350.
3️⃣ Retest the breakout area and successfully hold it as support.
4️⃣ Form a Higher High & Higher Low structure after the breakout.
🔥 If the breakout is confirmed, the next resistance areas shown on the chart can be monitored:
🎯 Target 1: $0.0680
🎯 Target 2: $0.0890
🎯 Target 3: $0.1160
🎯 Target 4: $0.1650
📊 These targets represent resistance levels marked on the chart, not a guarantee that price will reach them.
💡 The stronger the breakout volume and candle confirmation, the more important it becomes to confirm that the move is not simply a fake breakout.
---
🔴 BEARISH SCENARIO — REJECTION ⚠️
📉 The bearish scenario remains valid if price fails to break above the Descending Trendline.
If WAL experiences rejection around:
🔴 $0.0350
🔴 Descending Trendline
then price could potentially retest the nearest support areas.
📍 Key areas to watch:
🔻 $0.0270 — nearest support/reaction area
🔻 $0.0200 — major low on the chart
⚠️ If price loses momentum again and breaks below $0.0270, selling pressure could increase again.
🚨 A breakdown below $0.0200 would indicate that the previous recovery has failed and that the medium-term bearish structure remains dominant.
---
🎯 KEY LEVELS TO WATCH
🟢 $0.0350 → Resistance / breakout confirmation area
🟡 $0.0680 → First major upside resistance
🟡 $0.0890 → Next resistance
🟡 $0.1160 → Higher resistance
🟡 $0.1650 → Major resistance / upper target zone
🔴 $0.0270 → Important short-term support
🔴 $0.0200 → Major swing low
---
🧠 CONCLUSION
📉 WAL/USDT remains within a Descending Trendline structure, so structurally, it cannot yet be considered to have fully exited the downtrend.
However, the rebound from around $0.0200 indicates a recovery in momentum and has brought price increasingly close to the $0.0350 + Descending Trendline breakout zone.
🔥 Bullish confirmation: breakout + 3D close above the trendline and $0.0350, followed by a successful retest and hold of the area.
⚠️ Bearish confirmation: rejection from the trendline/$0.0350 followed by a breakdown below $0.0270.
📌 The $0.0350 area is a key level to watch. Price action around this level may provide confirmation as to whether WAL is beginning a reversal or returning to its downtrend.
---
🚀 WAL/USDT — BREAKOUT OR REJECTION?
📈 Bullish: Break above Descending Trendline + $0.0350
📉 Bearish: Rejection + loss of $0.0270
🎯 Upside Levels: $0.068 → $0.089 → $0.116 → $0.165
DYOR — Not Financial Advice.
#WAL #WALUSDT #Crypto  Long
Long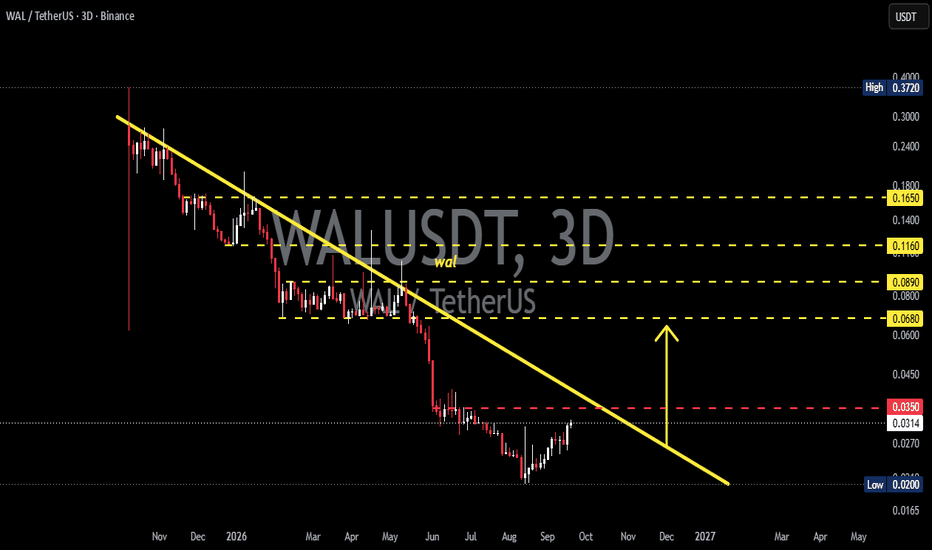
 Long
Long
 Long
Long
Bitfinex Sees 33,180 ETH Deposit from Long-Dormant WalletsTraders scanning the order books got a surprise when two wallets, likely belonging to the same whale, deposited 33,180 ETH into Bitfinex after more than two years of inactivity. This large transfer, valued at approximately $86.93 million, has sparked renewed interest in Ethereum among market participants. As a result, traders should closely monitor Ethereum’s network activity for potential shifts in sentiment and price trends.
Breaking It Down
The recent transfer of 33,180 ETH into Bitfinex has not only highlighted significant whale activity but also underscores a potential shift in market dynamics. This deposit, reported by the CryptoTwitter commentator @lookonchain, marks a notable reactivation of wallets that have been dormant for over two years. Given the current mixed signals in the broader crypto market, such movements may lead to increased scrutiny and speculation among traders regarding the future direction of Ethereum.
Ethereum, a leading smart contract platform, enables various decentralized applications and services within the blockchain ecosystem. Bitfinex, one of the largest cryptocurrency exchanges globally, plays a crucial role in facilitating trading and liquidity for Ethereum and other digital assets. The recent activity involving dormant wallets reactivating suggests possible strategic shifts within the Ethereum market, which traders should watch closely.
Key Levels to Watch
Traders are now on alert for further movements from this whale and any potential trends that may arise from increased trading volume on Bitfinex. The current dynamics could lead to heightened volatility in Ethereum’s price action, especially as traders assess the implications of this large transfer. Additionally, the reactivation of dormant wallets often indicates strategic repositioning, so ongoing monitoring of Ethereum’s on-chain metrics will be vital.
Market conditions are subject to change, and past performance is not indicative of future results.  Long
Long
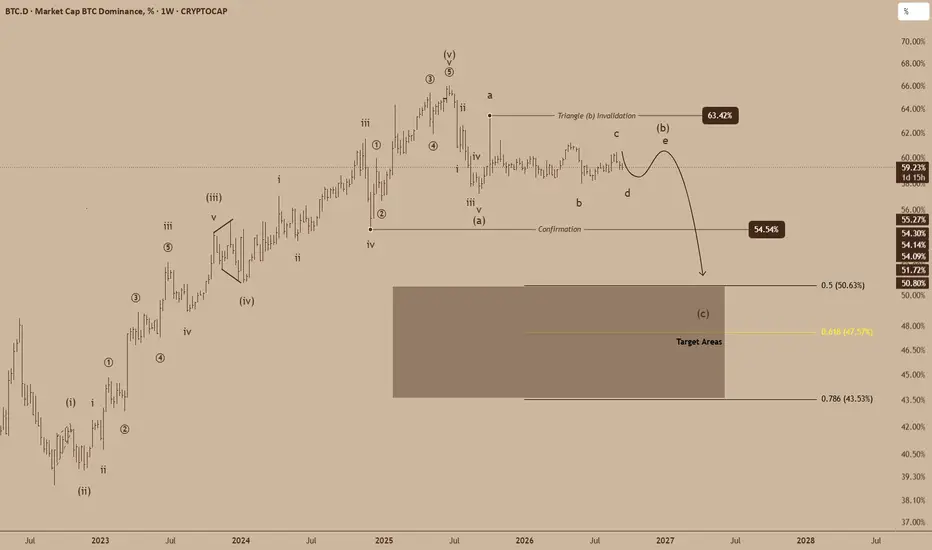
BTC Dominance: The 54.54% Level Could Define the Next RotationMarket Overview
Bitcoin dominance is trading at 59.23% on the weekly chart, keeping BTC firmly in control of the crypto market. But the larger structure is becoming more interesting: dominance appears to be completing a corrective triangle before a potential larger decline.
The key question now is whether the current rebound is the final leg of that structure or the start of a broader continuation higher.
Fundamental / News Catalyst
There is no single catalyst clearly driving BTC dominance right now. The crypto market is being pulled in two directions.
Bitcoin recently rebounded above $80,000 despite the Federal Reserve raising rates by 25 bps to 3.75%–4.00% and the U.S. Senate rejecting the Clarity Act. Bitcoin ETF flows also turned positive on September 17 after two consecutive days of significant outflows.
At the same time, broader crypto market breadth improved sharply on September 18, with 89 of 100 tracked assets advancing while Bitcoin gained less than the broader basket.
That divergence matters for BTC dominance: Bitcoin remains strong, but capital participation outside BTC is beginning to broaden.
Technical Analysis
The weekly BTC.D structure shows a long corrective formation developing after the major 2025 peak.
The current price sits around 59.23%, close to the upper portion of the projected triangle structure. The chart labels the latest advance as a potential Wave (e), suggesting the triangle may be approaching completion.
The critical structural level is 63.42%.
A sustained move above 63.42% would invalidate the triangle interpretation shown on the chart and force a reassessment of the bearish dominance thesis.
On the downside, 54.54% is the key confirmation level. A decisive break below this area would provide confirmation that the projected decline is gaining traction.
From there, the chart identifies three major downside references:
50.63% — 0.5 retracement
47.50% — 0.618 retracement / primary target area
43.53% — 0.786 retracement
The highlighted zone between roughly 47.50% and 43.53% represents the main projected target region for Wave (c).
Key Levels:
63.42% - Triangle invalidation
59.23% - Current BTC dominance
54.54% - Confirmation
50.63% - First downside reference
47.50% - 0.618 target
43.53% - 0.786 target
Bullish Scenario
BTC dominance continues higher and breaks 63.42%. That would invalidate the triangle interpretation and indicate that the current structure needs to be reconsidered.
Bearish Scenario
Dominance fails to sustain the current rebound and breaks below 54.54%. That would confirm the downside structure and bring 50.63%, followed by the 47.50%–43.53% target zone, into focus.
Short 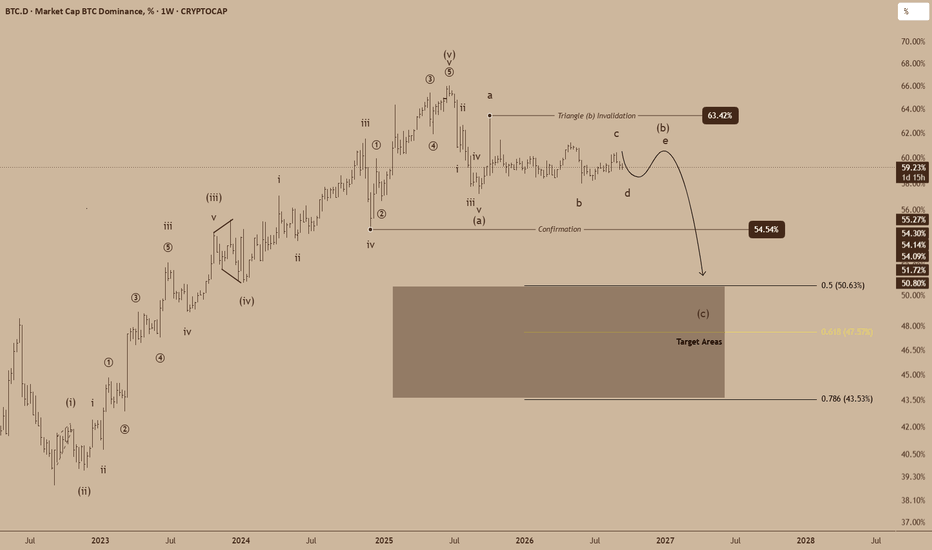
MMT - Accumulation Under Pressure — Breakout or Breakdown?💠 MMT/USDT on the 3D timeframe is currently showing an interesting structure: price is still trading below the Descending Trendline, while over the past several months it has been consolidating within the 0.135 – 0.110 yellow zone.
This structure indicates a phase of long-term accumulation/consolidation following a major decline. The main focus is now on the relationship between the 0.135–0.110 support zone and the Descending Trendline, which is gradually approaching the price.
---
📉 🔻 DESCENDING TRENDLINE
The descending yellow trendline from the area around 0.75–0.80 shows that MMT is still within a long-term lower-high structure.
📌 As long as price has not successfully broken and held above this trendline, the bearish structure remains intact.
However, the longer price consolidates beneath the trendline, the more significant a potential breakout could become in determining the next structural move.
---
🟨 🔒 ACCUMULATION / SUPPORT ZONE
0.135 – 0.110
The yellow block represents a very important zone on this chart.
🟨 0.135 → upper boundary of the zone
🟨 0.110 → lower boundary of the zone
🔻 0.0992 → visible low on the chart
Price has spent a considerable amount of time around this area, indicating consolidation following the previous decline.
💡 As long as price can hold above 0.110, the consolidation structure still has the potential to develop into a larger accumulation phase.
⚠️ Conversely, a strong breakdown below 0.110 could indicate that the structure has failed and selling pressure is increasing again.
---
🟢 🚀 BULLISH SCENARIO
The bullish scenario becomes more interesting if MMT manages to break out above the Descending Trendline.
🔑 Confirmation to watch:
🟢 Breakout above the Descending Trendline
🟢 3D candle closes above the trendline
🟢 Price successfully holds the breakout area as support
🟢 Increasing volume as additional confirmation
If the breakout is successfully confirmed, several horizontal resistance levels on the chart can become the next areas of interest:
🎯 Target 1 — 0.205
📈 Target 2 — 0.257
🚀 Target 3 — 0.335
🔥 Target 4 — 0.758
The 0.335 area represents an important resistance because it is a clearly visible horizontal level on the chart. If MMT manages to break through this area with strong structure, the path toward 0.758 could become more open.
> ⚠️ These targets represent technical resistance levels on the chart and are not a guarantee that price will reach them.
---
🔴 📉 BEARISH SCENARIO
The bearish scenario remains valid as long as price stays below the Descending Trendline.
🔴 If price is rejected again by the trendline, a retest of the 0.135–0.110 consolidation zone remains possible.
⚠️ Key levels:
🔻 0.135 → upper support of the zone
🔻 0.110 → major support
🔻 0.0992 → important low on the chart
If price loses 0.110 with a strong breakdown, the bullish/accumulation structure could be considered weakened.
📉 A breakdown below 0.0992 would represent a more bearish technical signal because price would create a new low below the visible support area on the chart.
---
⚖️ 🔍 TECHNICAL CONCLUSION
MMT/USDT is currently at an interesting technical point.
📉 Bearish: price remains below the Descending Trendline.
🟨 Neutral/Accumulation: price has been consolidating for an extended period within the 0.135–0.110 zone.
🟢 Bullish trigger: a breakout and confirmation above the Descending Trendline could open the possibility of a move toward the next resistance levels.
🔴 Bearish trigger: losing 0.110, especially if followed by a breakdown below 0.0992, would indicate weakening support structure.
🎯 KEY LEVELS TO WATCH
🟨 Support Zone: 0.135 – 0.110
🔻 Major Low: 0.0992
📈 Resistance: 0.205
📈 Resistance: 0.257
🚀 Resistance: 0.335
🔥 Major Resistance: 0.758
---
🧠 MARKET STRUCTURE
📌 Pattern: Descending Trendline + Long-Term Consolidation / Accumulation Zone
📌 Timeframe: 3D
📌 Current Price: around 0.1587
📌 Key Support: 0.135 – 0.110
📌 Breakout Confirmation: Break & Close above the Descending Trendline
📌 Invalidation Area: Strong breakdown below 0.110
📌 Major Upside Resistance: 0.205 → 0.257 → 0.335 → 0.758
#MMT #MMTUSDT #Crypto  Long
Long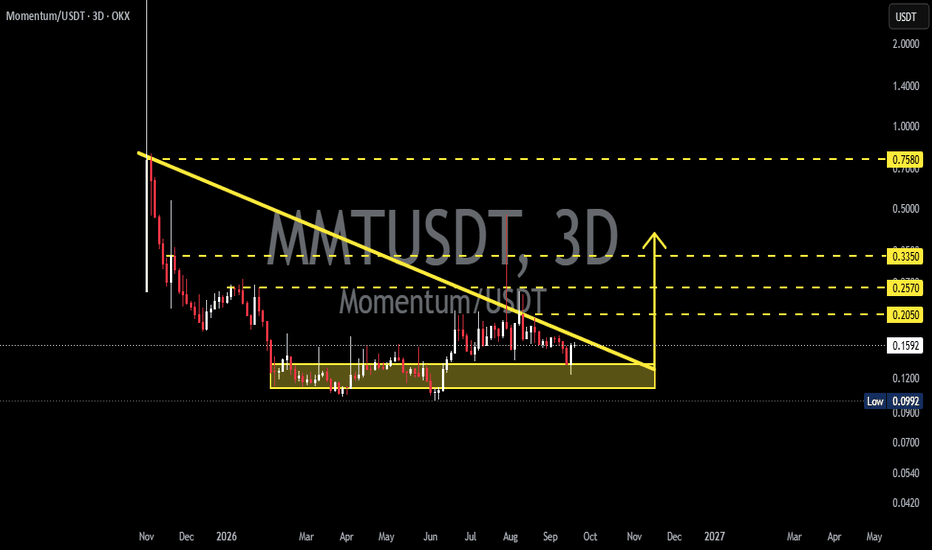
ASTER/USDC, The Calm Before the BreakoutLet's cut through the noise. ASTER/USDC on Coinbase Advanced Spot is showing the kind of structure that doesn't scream it whispers. Price sitting above every major moving average, a volume spike that confirms real participation, and a +41.9% buy-side imbalance that tells you buyers aren't just showing up, they're staying. This isn't hype. This is accumulation in plain sight.
Entry Zone: 0.75100000
Target: 0.78104000 (+4.00%)
Session: US (16:00–21:00 UTC)
The Trend Doesn't Lie
Price is trading above both the 200 EMA and the 200 SMA on the daily. That's not a coincidence that's the macro wind at our back. When an asset holds above both of these "bull/bear lines," the path of least resistance points up. Simple as that.
Condition Status
Price > 200 EMA ✅
Price > 200 SMA ✅
Order Book Imbalance: +41.9%
Volume Spike: ≥2.0x ✅
The Order Book Tells a Story
+41.9% buy-side imbalance. That's not retail nibbling that's size stepping in. Demand is overwhelming displayed sell liquidity, and sellers are getting absorbed faster than they can reload.
What this actually means:
Large players are accumulating, not distributing
Sell walls are being eaten, not defended
Price has to move higher to find real sell pressure
This kind of imbalance doesn't linger. Either price breaks upward, or the imbalance fades. History favors the former.
When whales load up, they don't slam market buys. They use iceberg orders, let volume dry up, then push. That fingerprint is all over this chart.
The Quiet Part Is the Loudest
24h Change: +1.0%
24h Volume: $1.69M
Here's the tell price has barely moved, yet volume is spiking and buyers are dominating. That's not a pump. That's a coil. Accumulation before ignition. The breakout is already confirmed the move just hasn't fully expressed itself yet.
What I'm Watching
Holding above 0.75100000 buyers defending this zone keeps the structure intact
Volume expanding toward 0.78104000 real breakouts need fuel, not just hope
Imbalance staying elevated if it fades, momentum stalls
Reaction at target I'll consider scaling out if volume keeps pushing  Long
Long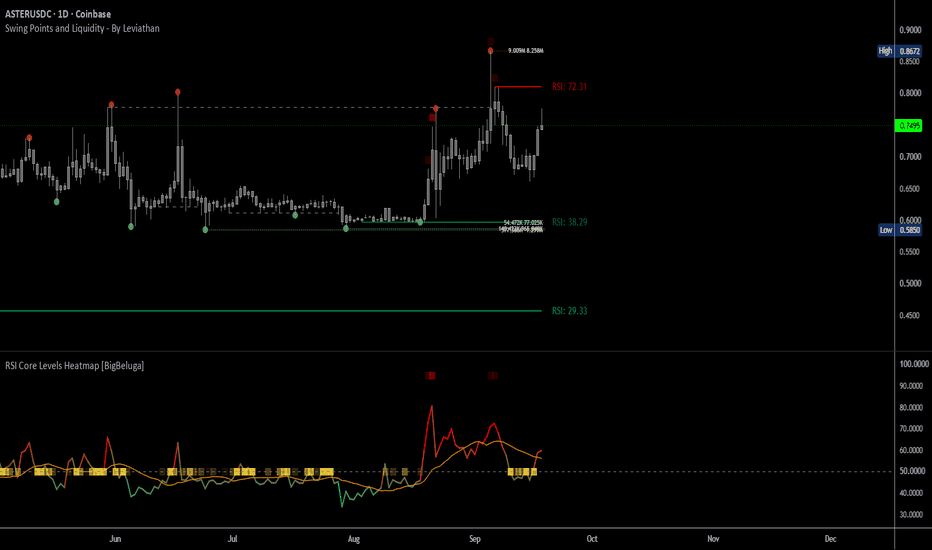
the memory of price (btc, xau, spx, & more...)Psychological Price Levels: The Numbers Markets Remember
A price does not need a fundamental reason to matter.
Sometimes, the number itself becomes important.
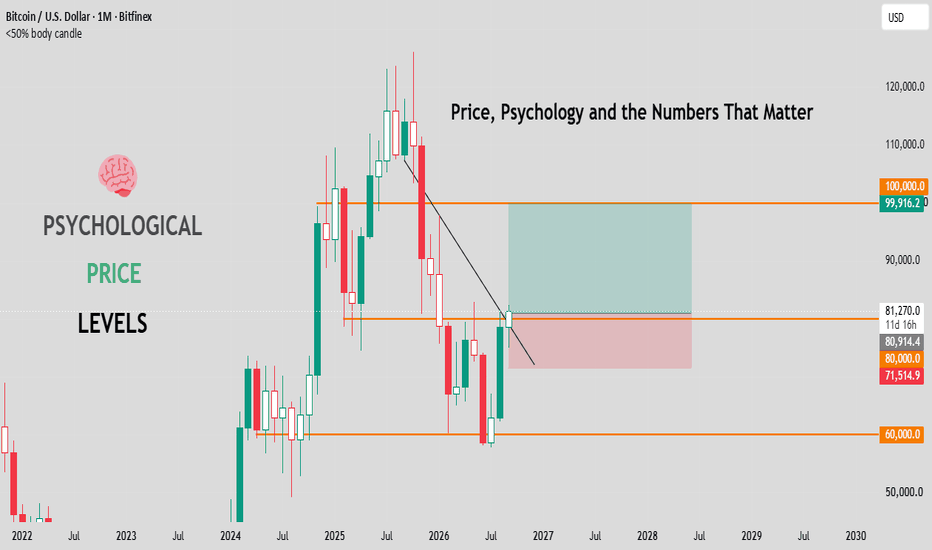
Psychological price levels are prices that attract disproportionate attention because they are easy to recognize, remember and use as reference points. Round numbers are the most common example, but their importance is market-dependent . They can become areas where orders, profit-taking, stop placement and trader attention cluster.
But there is an important distinction:
A round number is not automatically a major psychological level.
Think in hierarchies , not every zero. Ask, “How does this market naturally organize its important numbers?”
A market can have:
Major psychological levels - large, widely recognized milestones
Intermediate psychological levels - useful subdivisions
Minor round levels - smaller increments that may matter mainly on lower timeframes
The spacing should adapt to the asset's price scale, quotation and market conventions.
1. Bitcoin — BTC BINANCE:BTCUSD
Suppose BTC has a significant technical level at $78,432.
The next major psychological level is not automatically $78,000 , even though $78,000 is a round number.
Why?
$78,000 is only $432 below an existing significant price. It is a round-number reference , but it does not represent a new major numerical milestone.
$80,000 does.
So:
$78,432 = significant technical level
$78,000 = minor round reference
$80,000 = major psychological level
For BTC, large milestones such as $70K, $80K, $90K and $100K provide a useful starting framework. Smaller increments can then be added according to timeframe and market structure.
key @currencynerd insight :
Do not confuse a technically significant price with the nearest round number
2. Gold — XAU/USD OANDA:XAUUSD
Gold is quoted in dollars per troy ounce , so whole-dollar and larger round-dollar levels become natural reference points.
For example:
$4,000 → $4,100 → $4,200 → $4,300 → $4,400
At higher timeframes, larger increments provide a cleaner framework. Lower timeframes may justify tighter subdivisions.
A round number becomes more significant when it also coincides with a previous high/low, supply/demand zone or liquidity pool.
3. EUR/USD — FX PEPPERSTONE:EURUSD
FX has a different numerical structure because currency pairs are quoted to several decimal places.
Major psychological levels are commonly built around 00 levels :
1.0500 → 1.0600 → 1.0700 → 1.0800 → 1.0900 → 1.1000
Half-levels such as 1.0550 or 1.0650 can serve as intermediate references.
The 1.0000 parity level is an especially recognizable reference because it represents equality between the two currencies.
The key lesson is that you should not apply BTC's $10,000 framework to EUR/USD. Each market has its own numerical architecture.
4. S&P 500 SPCFD:SPX
For an index such as the S&P 500, psychological structure is better expressed through large index milestones .
A framework might look like:
6,000 → 6,500 → 7,000 → 7,500 → 8,000
Smaller subdivisions can then be used on lower timeframes.
5. Nasdaq-100 IG:NASDAQ
The same principle applies, but the hierarchy must be calculated from the Nasdaq-100's own price scale.
For example:
20,000 → 21,000 → 22,000 → 23,000 → 24,000
Do not simply copy psychological levels from another index.
The asset determines the scale.
6. U.S. 10-Year Treasury Yield TVC:US10Y
This is where traders can make a major mistake.
The 10-Year Treasury is commonly analyzed through its yield , not simply through a dollar price.
Psychological levels therefore look more like:
4.00% → 4.50% → 5.00%
For rates, think in percentage-point milestones , not the same increments used for BTC, equities or commodities.
7. Brent Crude Oil TVC:UKOIL
Oil is quoted in dollars per barrel.
Large psychological milestones can therefore be:
$70 → $80 → $90 → $100 → $110
The significance of a level can increase when it also represents an economically recognizable threshold or coincides with established market structure.
8. Copper IG:COPPER
Copper demonstrates why blindly copying another market does not work.
Its price scale is much smaller, so useful psychological references may look more like:
$4.00 → $4.25 → $4.50 → $4.75 → $5.00
There is no universal psychological increment.
The quotation and price scale determine the framework.
9. Wheat EIGHTCAP:WHEAT
Agricultural futures require attention to the contract's quotation and tick structure.
First understand how that particular contract is priced. Then identify the major whole-number and fractional milestones appropriate to its price scale.
Psychological levels should be considered alongside contract specifications, historical price structure and liquidity.
10. Real Estate / REITs
For a liquid REIT ETF or index, the framework resembles equities.
An instrument around $100 might naturally be studied around:
$100 → $110 → $120
But again, the actual price scale and historical behavior should determine the spacing.
A Practical @currencynerd Marking Workflow
Keep it simple:
1. Mark the current price.
Know the instrument's quotation and price scale.
2. Mark the major milestones first.
Use the largest clean numbers that make sense for that market.
3. Add intermediate levels only where useful.
Don't fill the chart with every $1, 10 pips or 100 points.
4. Overlay your actual market structure.
Check whether the psychological level aligns with a previous high/low, supply/demand zone or liquidity pool.
5. Classify the level.
Is it primarily psychological, technical, liquidity-based or a combination?
6. Wait for price behavior.
Rejection, acceptance, breakout, consolidation or liquidity sweep tells you what the level is actually doing.
7. Never trade the number alone.
A psychological level is a reference point, not a guaranteed reversal point.
@currencynerd Principles to remember
The number creates the reference, market structure provides the context and price action provides the evidence.
That is the difference between simply drawing round numbers on a chart and actually understanding psychological price levels.
thank you for your attention on the matter...
put together by : Pako Phutietsile as @currencynerd
Education