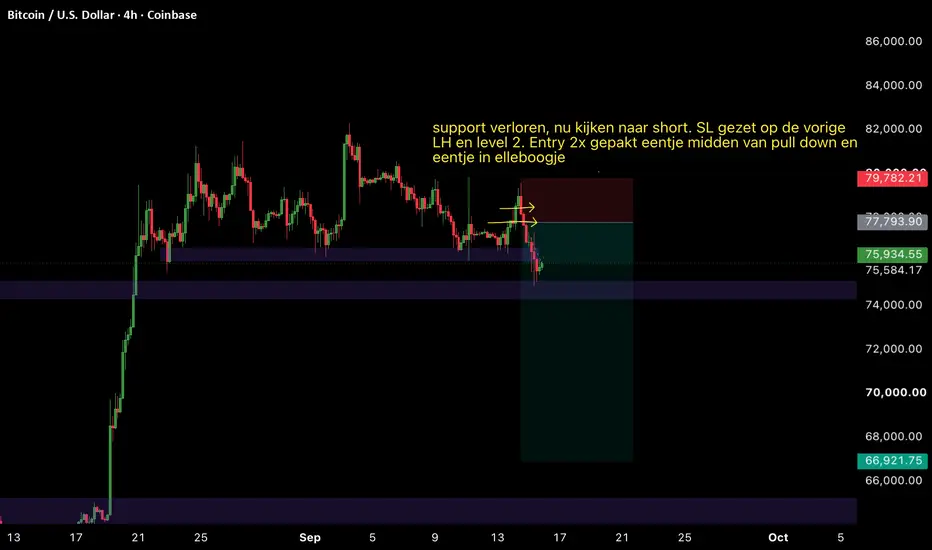
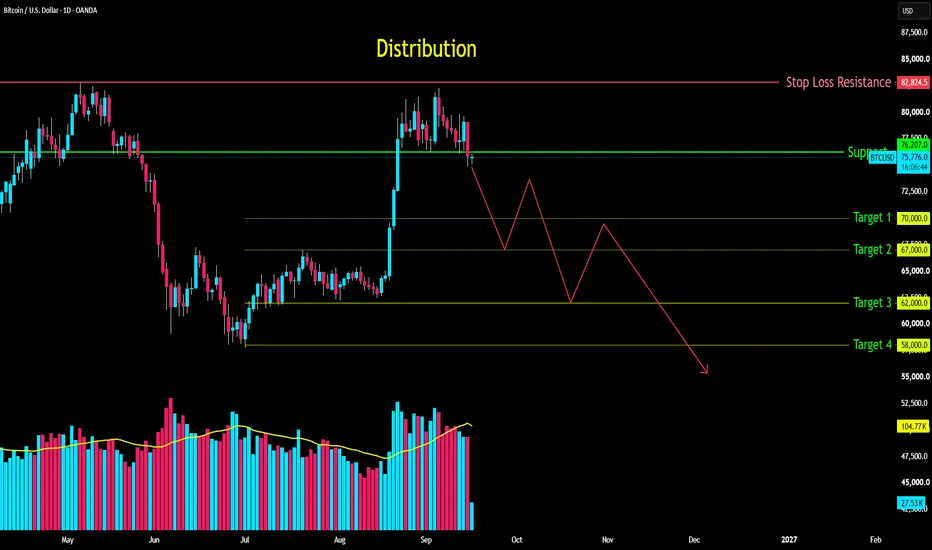
Long
Long
FOMC: What’s Next for Bitcoin?Hello everyone!☀️
Today, September 16, the main event is the FOMC meeting (US Federal Reserve), with the interest-rate decision being released today 🧨🧨🧨 The probability of a 25 bps rate hike has sharply increased to around 92% according to CME FedWatch.
And here is an important nuance going into the Fed decision ❗️
Even before the rate decision, we have already been dragged from $79,590 to $74,880, breaking through the very important $76K level.
So by the time we get to the FOMC, the market is already heavily repositioned to the downside 🐻
Therefore, if the Fed delivers exactly what is already almost fully priced in — +25 bps — BTC could see a relief move even with a rate hike.
Because the question is no longer just “Will they hike?”, but rather what they say about further rate hikes and the Dot Plot. Reuters has also pointed out that the market is particularly focused on the Fed’s forward guidance.
Let’s try to connect this event to the chart and map out the possible scenarios.
🟢🦬🚀Bullish scenario.
If $75K + the 4H EMA 200 hold the price before the meeting and BTC reclaims $76K, then the wicks we saw yesterday during the US session and today at the Asian open could turn out to be exactly the liquidity sweep I was referring to earlier:
«…we could potentially collect some decent liquidity — at $76,219 and $75,538, respectively.»
In other words, this could simply be a shakeout of weak hands ahead of the event.
For the bullish scenario to gain strength, I would then want to see BTC reclaim and consolidate above the midpoint of the trading range at $78K.
🔴🐻🪓Bearish scenario.
If $75K + the 4H EMA 200 break before the meeting, the structure becomes significantly weaker, and the chart will likely react much more sharply to every word coming from the Fed.
🔴🔴🐻🪓🔪⚰️Bearish x2 scenario
$75K + 4H EMA 200 break directly during FOMC + a hawkish Fed. In this case, $73,300 comes into play.
Let’s see what the Fed brings us.
Peace 🌄✊🏼
⚠️ Disclaimer:
All information shared on this channel is for educational and informational purposes only and is not investment advice. The author is not responsible for your trading decisions. Always manage your risks and make decisions independently. XRP/USD Blueprint: Key Supply Targets & Risk Levels to Watch🔥 XRP/USD | Capital Flow Blueprint Plan (Day/Swing Trade) 🚀
📊 My Analysis
XRP/USD is currently oscillating around $1.40 - $1.41, consolidating following a recent intraday spike that encountered strong technical resistance. On the daily chart, price action is holding above key structural support, with institutional liquidity forming a potential springboard. Market participants are watching for a high-volume confirmation candle to establish directional momentum out of this range.
📈 My Market Bias
Bullish continuation bias over the medium term, contingent on defending structural demand and absorbing overhead supply.
🎯 Possible Scenario
- Trigger: A sustained daily close above the immediate liquidity zone ($1.42 - $1.45).
- Path: Clean breakout -> Liquidity sweep of minor swing highs -> Push toward higher structural supply zones.
- Target Zone: The upper heavy resistance & liquidity barrier ("Police Barricade Zone") at $1.5500. This area acts as a strong institutional supply level, overbought confluence, and potential bull trap where dynamic reversal risks increase. Traders should manage exposure and secure profits accordingly.
🛡️ Areas I Am Watching
- Key Entry / Accumulation Zone: Market execution across established value levels between $1.3500 and $1.4000, aligning with key Fibonacci retracements and dynamic demand.
- Stop Loss (Invalidation Level): $1.2000 (Structural pivot support).
* Disclaimer: Dear Ladies & Gentlemen (Thief OGs), this is my personal technical invalidation mark. Setting your SL is entirely your own choice and risk management responsibility!
- Take Profit Target: Final Target @ $1.5500 ("Police Barricade Zone").
* Disclaimer: Dear Ladies & Gentlemen (Thief OGs), I do not mandate or recommend adhering solely to my TP level. Take profits at your own discretion and manage your trade at your own risk!
🧠 Educational Breakdown
1. Liquidity Pools & Traps: Higher timeframe resistance zones often attract heavy stop-orders and breakout buyers, creating high-volatility "trap" conditions. Identifying these zones allows traders to execute structured exits before potential mean-reversion pullbacks occur.
2. Market Structure: Respecting invalidation pivots ($1.2000) maintains a strong risk-to-reward ratio while safeguarding against unexpected volatility expansion.
🔗 Correlated Markets & Related Assets to Watch
- $BTC/USD (Bitcoin): Trades as the macro sentiment leader for digital assets (~$76,800). XRP exhibits a strong positive correlation with BTC; a breakout in Bitcoin provides macro tailwinds for altcoin expansion.
- $ETH/USD (Ethereum): Core gauge for smart contract platform liquidity (~$2,475). Strong ETH performance confirms healthy risk-on appetite across major crypto assets.
- TVC:DXY (U.S. Dollar Index): Inversely correlated macro anchor (~99.60). Broad U.S. Dollar weakness typically acts as a catalyst for capital inflows into crypto assets like XRP/USD.
- CRYPTOCAP:RLUSD (Ripple USD Stablecoin): Utility-driven stablecoin liquidity on the XRP Ledger. Expansion in RLUSD issuance enhances overall XRPL network activity and capital velocity.
📰 Latest Real-Time Fundamental & Economic Factors
- Regulatory Legislation (U.S. Senate Vote): The U.S. Senate is deliberating on key crypto market structure legislation (the CLARITY Act). Political developments regarding full statutory classification continue to serve as a high-beta volatility driver for XRP.
- On-Chain Protocol Upgrades: The XRP Ledger (XRPL) ecosystem is evaluating major technical amendments (including Batch V1.1 for atomic multi-transactions and institutional feature packages in xrpld 3.3.0). Validator consensus timelines are actively influencing short-term market sentiment.
- Institutional Product Flows: U.S. Spot XRP ETF products continue to report measurable net daily inflows, elevating total net AUM ($1.22B+) and establishing a structural institutional floor.
- Macro Environment & Federal Reserve: Broad market sentiment remains attuned to upcoming Federal Reserve interest rate decisions and global liquidity conditions, influencing risk-asset positioning.
🥷 Thief Trader Style Wishes & Motivation Quotes
- "We don't predict the market, Thief OGs — we adapt to its footprints, strike with precision, and vanish into the green!" 💰✨
- "Protect your capital first; the profit will chase the patient hunter. Trade safe, manage risk, and bag those pips!" 🐺📉📈 BTC/USDT Official Trading Plan BTC/USDT Official Trading Plan
1. Trading Instrument
BTC/USDT
2. Analysis Timeframe
30M Intermediate trading timeframe
3. Entry Level
Go long near the current market price at 76870.00
4. Hard Stop Loss
Fixed stop loss placed at 76700.00
No averaging down, no holding position after stop loss trigger.
5. Take Profit & Position Management Rules
TP1 Primary Target: 77800.00
Close 50% of total position, trail stop loss upward immediately to lock floating profit.
TP2 Secondary Target: 78500.00
Close 50% of remaining position, continue trailing stop loss upward for risk protection.
TP3 Advanced Target: 79400.20
Close 50% of remaining position again, adjust dynamic trailing stop loss.
Leave the final tail position running with trailing stop mechanism to capture further trend movement.
6. Professional Risk Disclaimer
All trading activities in the financial market carry significant risks of price volatility, liquidity imbalance and unexpected trend reversal. Cryptocurrency markets operate 24/7 with high uncertainty, which may cause gap movement and stop-loss slippage. Leveraged trading magnifies both returns and risks, potentially resulting in partial or total loss of principal capital. This trading plan is purely for personal strategy reference, not investment solicitation or financial advice. All entry, exit and risk control decisions are undertaken independently by the trader, who assumes full responsibility for all profit and loss consequences.
 Long
Long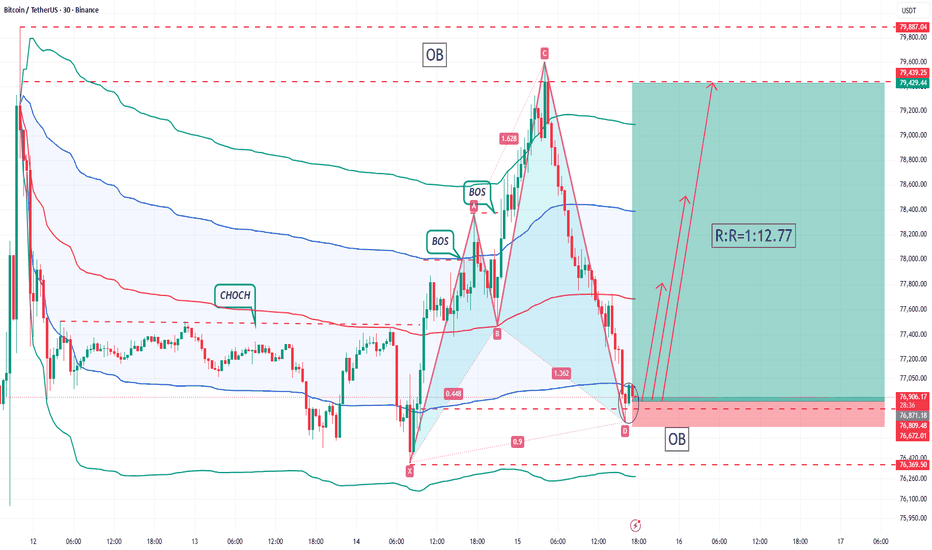
BTC 9% Pullback: Is This Wave 4 or the Start of a Larger Correct
——— SIMPLE SUMMARY ———
BTC rallied to 82.3K and then declined roughly 9% to 75.1K.
For traders who do not use Elliott Wave, the current setup can be simplified to this:
• 72–75K is the main area where I am watching for a bullish reaction
• A clear break below 72.2–72.3K would weaken my stronger bullish scenario
• If support holds and price reacts well, a move above 82.3K remains possible
I am considering spot or futures longs inside the blue box, but it is a relatively wide range.
For that reason, I plan to keep position size controlled rather than entering aggressively.
The blue box gives me an area to watch.
The actual market reaction will determine whether there is a trade.
——— SCENARIO 1: WAVE 4 CORRECTION ———
The first scenario assumes that the impulse structure is still incomplete.
In this interpretation, Wave 3 ended around 82.3K and BTC is currently developing Wave 4.
If Wave 4 completes successfully, Wave 5 would still remain.
That would leave room for another bullish move above the 82.3K high.
Wave 4 corrections can develop in different ways.
A price correction could form as a Zigzag ABC, similar to the cyan structure shown on the chart.
Alternatively, Wave 4 can become more time-based.
Irregular corrections or triangle structures can consume time without producing an equally deep decline.
This is why a correction does not automatically mean that BTC needs to fall significantly lower.
——— INVALIDATION: 72.2–72.3K ———
The first scenario assumes that the broader bullish trend remains intact.
Because of that, the deeper price falls, the less attractive this interpretation becomes.
The important level for me is approximately 72.2–72.3K.
A decisive move below that area would invalidate my current Wave 4 → Wave 5 interpretation.
As long as that level remains intact, however, I am willing to keep the possibility of another high above 82.3K open.
——— SCENARIO 2: THE ADVANCE IS ALREADY COMPLETE ———
The second scenario assumes that the previous ABC advance has already completed around 82.3K.
In simple terms:
Scenario 1:
A correction inside an ongoing uptrend.
Scenario 2:
The previous bullish structure has ended and a larger correction is beginning.
The main difference is the potential depth of the decline.
If Scenario 2 is developing, I would expect a deeper correction than under the Wave 4 scenario.
This does not mean BTC can never trade above 82.3K again.
There are larger-degree bullish structures that could eventually lead to another breakout.
However, those possibilities require a much broader wave count and are outside the scope of this update.
——— WHY I AM WATCHING THE BLUE BOX ———
The blue box is not based on a single indicator.
Several technical factors overlap in this region.
1. SR Flip Levels
The orange, green and red levels represent areas that previously acted as resistance.
After price moved above them, those same areas can potentially act as support.
2. Channel Confluence
The rising red channel and the descending white channel both interact with this broader region.
3. Fibonacci Retracement
The area also overlaps with the retracement structure of the larger advance.
Together, these factors create a zone where I believe a bullish reaction is worth monitoring.
——— CURRENT APPROACH ———
I am considering both spot and futures longs around the blue box.
However, reaching the box itself is not enough for me to enter automatically.
I want to observe:
• Price reaction
• Candle structure
• Whether support is actually defended
• Additional confirmation if necessary
The range is also wide, which means position sizing becomes especially important.
Even when an area has strong technical confluence, the setup can still fail.
For that reason, I would rather enter with risk I can manage than over-size a position simply because I like the level.
——— CONCLUSION ———
BTC has declined roughly 9% from 82.3K.
That decline alone does not confirm that the bullish structure has ended.
The main question is whether this is simply a correction within the uptrend or the beginning of a larger corrective phase.
For now, I am watching the 72–75K area for a possible bullish reaction.
If support holds, another move above 82.3K remains possible.
If BTC decisively breaks below 72.2–72.3K, I will invalidate the stronger bullish scenario and reassess for a deeper correction.
The blue box is not an automatic buy zone.
It is an area where several technical factors overlap and where I want to observe the market’s reaction.
The objective is not to predict which scenario must happen.
It is to know where I want to act and where my idea becomes invalid.
Response > prediction.
This is a market structure analysis and personal trading journal, not financial advice. Long 
Short 
POWER - Breakout, Retest & The Road Ahead?💵 Coin: BSE:POWER
⏳ Time Frame: 2D
📍 Current Price: around $0.1333
🟨 Key Support / Accumulation Zone: $0.099 – $0.130
---
🟨 PATTERN & CHART STRUCTURE
🔍 The main pattern visible is a long accumulation/range phase, following a major decline from the previous high.
📉 After a strong rejection from the $2.65 area, BSE:POWER entered a downtrend before transitioning into a prolonged period of consolidation.
🟨 The $0.099 – $0.130 area is particularly important because price has consolidated around this zone for an extended period. This area can be viewed as a base/accumulation zone within the current chart structure.
📈 Interestingly, the latest price action appears to have broken above the upper boundary of the yellow zone and is now approaching the next resistance levels. If this breakout can be sustained with strong 2D candle closes, the structure could potentially transition from sideways consolidation into a recovery/uptrend.
---
🟢 BULLISH SCENARIO
🚀 The bullish scenario becomes stronger if price manages to hold above $0.130.
If the breakout from the $0.099 – $0.130 zone is successfully maintained:
🎯 Resistance 1: $0.1855
🎯 Resistance 2: $0.2220
🎯 Resistance 3: $0.3550
🔥 The $0.355 area represents an important resistance level and the main potential target shown on the chart.
📈 If BSE:POWER manages to break above $0.355 with strong volume and momentum, the market could open up further upside potential.
🚀 Under a very strong breakout scenario, attention could eventually shift toward higher resistance areas, including $1.75.
⚠️ However, these levels are potential technical resistance/targets, not a guarantee that price will reach them.
---
🔴 BEARISH SCENARIO
⚠️ The bullish scenario would weaken if the latest breakout turns out to be a false breakout.
📉 If price moves back into the yellow zone:
🔸 $0.130 → Initial support
🔸 $0.099 → Lower boundary of the major zone
If price loses $0.099 decisively on the 2D timeframe, the bullish breakout structure could be considered invalidated, potentially causing the consolidation structure to turn bearish again.
📉 Losing the $0.099 – $0.130 zone could also increase the possibility of a retest toward the previous low area.
---
🎯 KEY LEVELS
🟨 $0.099 – $0.130 → Major Support / Accumulation Zone
🟢 $0.130 → Breakout & Retest Level
🟡 $0.1855 → Resistance
🟡 $0.2220 → Resistance
🟠 $0.3550 → Major Resistance / Potential Target
🔵 $1.7500 → Higher Resistance
🔵 $2.6593 → Previous Major High
---
🔥 CONCLUSION
📊 BSE:POWER is currently showing an interesting structural shift following a prolonged consolidation phase around the $0.099–$0.130 area.
🚀 The main focus now is whether price can hold above $0.130 and continue moving toward $0.1855 → $0.222 → $0.355.
🔄 A successful breakout + retest above the yellow zone would strengthen the bullish structure.
⚠️ On the other hand, if price returns into the yellow zone and especially loses $0.099, the breakout could turn into a false breakout.
📌 Key level to watch: $0.130
#POWER #PowerProtocol #POWERUSDT #Crypto  Long
Long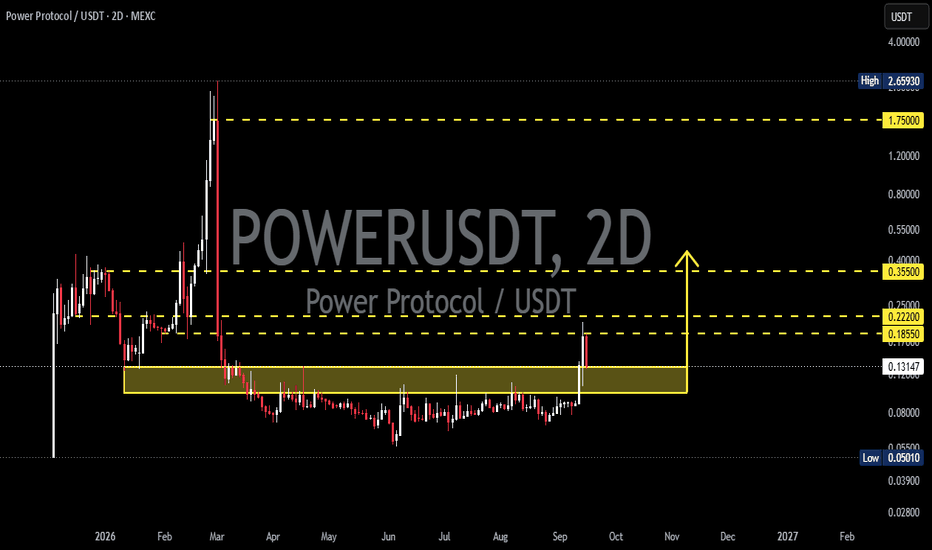
Short 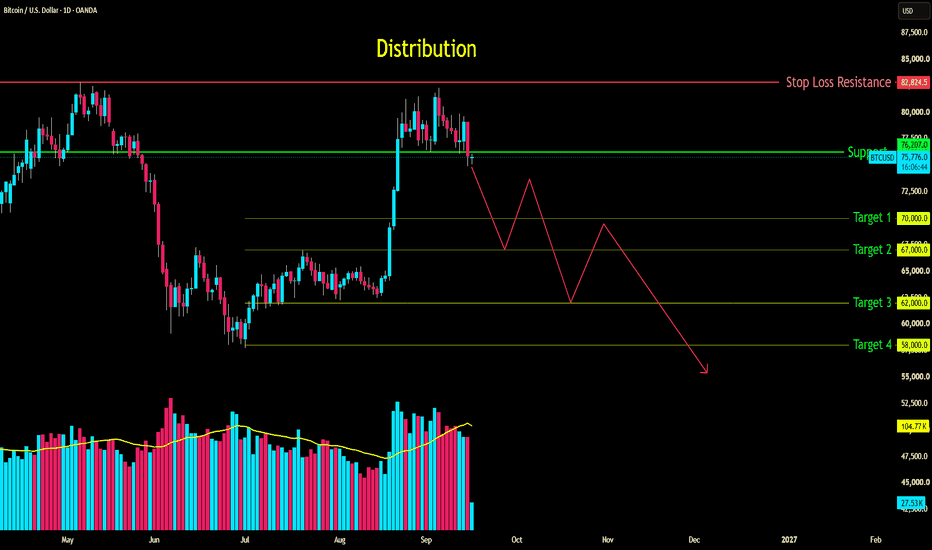
 Long
Long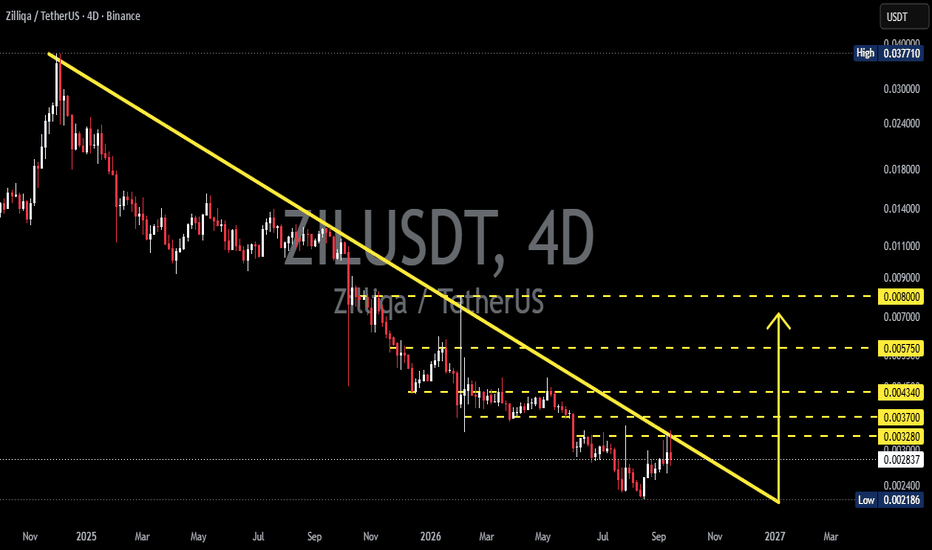
ETH Drops into Key Support — Will Buyers Defend This Zone?Market Structure
Ethereum remains in a bearish market structure on the 4-hour chart after a sharp rejection from recent highs. The latest decline has pushed price back into an important support zone, where buyers are trying to slow selling pressure. However, the overall trend remains weak until ETH can reclaim key resistance.
Market Sentiment - Bearish
Market sentiment remains bearish. Lower highs and the recent impulsive decline suggest sellers are still in control, although short-term buying interest has emerged around current support.
Bullish Scenario
If ETH holds above 2,390 and breaks above 2,470, buying momentum could improve and drive price toward the next resistance around 2,520. A sustained move above that level would suggest the current correction is losing strength.
Bearish Scenario
If ETH breaks below 2,390, sellers could extend the decline toward the next support near 2,350. A decisive break below that level would reinforce the broader bearish structure.
────────────────────
Market Outlook
Ethereum is attempting to stabilize after a strong sell-off. While buyers are defending the current support zone, the broader trend remains under pressure until price reclaims nearby resistance.
────────────────────
Key Levels
First Resistance: 2,470
Second Resistance: 2,520
First Support: 2,390
Second Support: 2,350
────────────────────
Future Scenarios
A break above the First Resistance would indicate improving momentum and could open the way toward the Second Resistance.
However, if price falls below the First Support, sellers may extend the decline toward the Second Support.
────────────────────
Event Risk
Ethereum may remain sensitive to Bitcoin price movements, U.S. macroeconomic data, Federal Reserve expectations, ETF-related flows, and overall crypto market sentiment.
However, price action remains the key indicator. If positive news cannot lift ETH above the First Resistance, upside momentum may remain limited. Conversely, if ETH breaks below the First Support despite supportive headlines, it would suggest sellers remain firmly in control.
────────────────────
Please share your view below:
Do you expect Ethereum to rebound from current support, or will the downtrend continue?
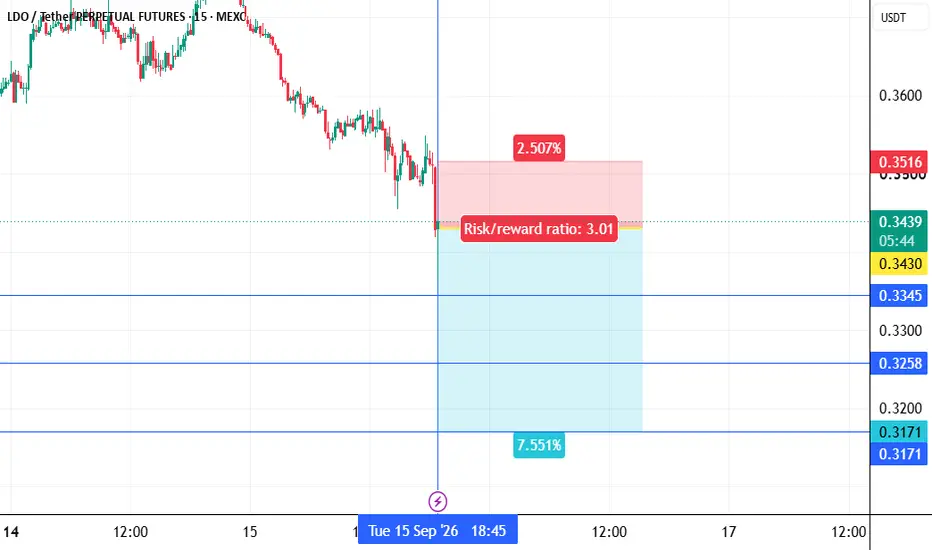
More market structure and key level updates will be shared regularly. ldousdt shortInstructions:
Entry point: yellow
Stop loss: red
Take profit: green or blue
👉Leverage x 5-10-20 for crypto
👉Leverage x 20-50-100 for commodities, stocks, indices, and forex
👉Margin 1-5% max.
Always practice risk and money management.
Invest a maximum of 5% on any trade or across all your trades.
Invest only what you can afford to lose, as no one is in control of the market.
👉Our analyses are primarily based on:
breakouts: two trend lines (ascending and descending) and a line indicating a horizontal breakout.
chart patterns: shoulders and head, triangle parttern, elliott impulse, etc etc.
We don't always have the time to track them at all times or to represent them visibly, given the numerous signals, the number of channels to manage, and especially because of the often rapid pace of market movements.
indicators: We associate at least two indicators with this technique.
👉Depending on the circumstances, we use specific indicators, often setting 3 or more take profit levels.
👉Indeed, there are good days in trading and also bad days. No one can promise to win every trade, and like all traders worldwide, we also experience stop-loss orders. However, we win more than we lose and remain positive.
👉You can close the position before or after the take profit orders indicated by the green lines if you are personally satisfied; the same applies to stop loss orders.
👉We must stay positive, clear-headed, and humble.
we cannot provide all instructions or all trades here on this channel.
Good luck to us all, and may God guide us. Amen.  Short
Short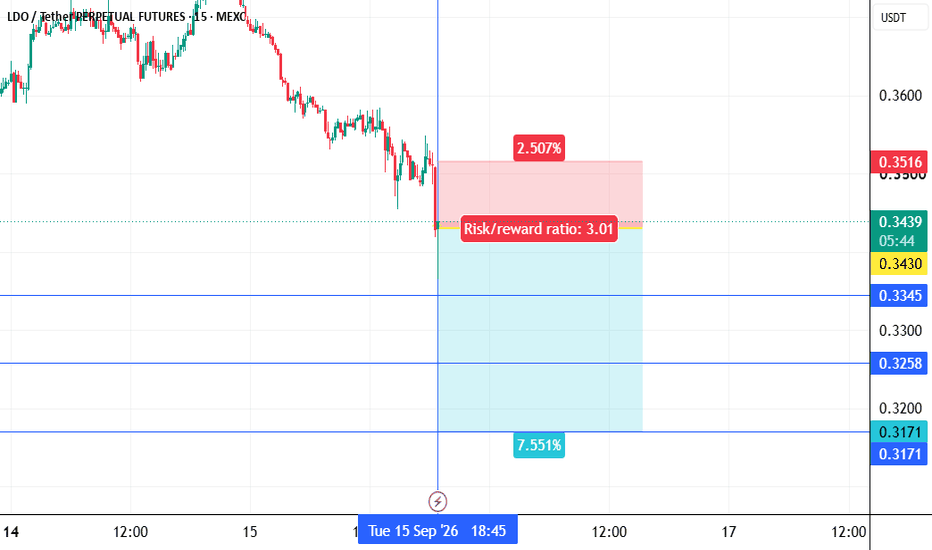
XRP/USD: Bearish BoS Below 1.3325 Extends Downtrend Toward 1.20XRP just printed a fresh bearish BoS on the 4H three bars back, closing through the 1.3325 swing low with an ATR-buffered break. Price is now trading at 1.2951, sitting below the lower band at 1.3023, while EMA21 (1.3585) and EMA55 (1.3726) stack cleanly overhead — the trend backbone is firmly tilted down. The last swing high at 1.4961 is still drawn and hasn't been challenged for eight bars, which tells you sellers are in control of structure.
Why this matters: a below-lower-band print inside a confirmed downtrend often stretches before it snaps back. The 1.5x ATR envelope is already exceeded, so the tape is short-term overstretched but structurally weak. That combo usually resolves one of two ways — a mean-revert bounce into EMA21 that sellers fade, or a continuation leg once price rebalances.
The setup I'm watching: a corrective push back toward 1.3325-1.3585 (the broken swing flipping to resistance, capped by EMA21). Rejection there activates the continuation. If price instead reclaims EMA55 at 1.3726 on a 4H close, the bearish thesis is done — that's the invalidation.
Downside targets stack at 1.2450 (round-number magnet and next liquidity pocket), then 1.20 psychological, and cushion at 1.10 if momentum accelerates toward the window low.
Setup: Retest of the broken 1.3325 swing into EMA21 at 1.3585, then rejection to resume the downtrend.
Invalidation: 4H close back above EMA55 at 1.3726 voids the bearish continuation.
Targets: 1.2450 — first liquidity pocket below · 1.20 — psychological round number · 1.10 — cushion toward the window low  Short
Short
BTC Faces Heavy Selling Pressure — Can Support Hold?Market Structure
Bitcoin remains in a bearish market structure on the 4-hour chart. After failing to sustain recent rebounds, sellers regained control and pushed price back toward a key support area. Although buyers are attempting to stabilize the decline, the overall structure still favors the downside unless BTC reclaims nearby resistance.
Market Sentiment - Bearish
Market sentiment remains bearish. Consecutive lower highs and lower lows indicate that sellers continue to dominate, while buying interest is mainly defensive around current support.
Bullish Scenario
If BTC holds above support and breaks back above 76,500, short-term buying momentum may strengthen and drive price toward the next resistance near 77,500. A sustained move above that level would suggest the correction is losing momentum.
Bearish Scenario
If BTC breaks below 75,200, selling pressure could accelerate and expose the next downside target around 74,800. A decisive breakdown would reinforce the current bearish trend.
────────────────────
Market Outlook
Bitcoin is trading near an important support zone after an extended decline. Buyers are trying to defend current levels, but the overall trend remains under pressure until key resistance is reclaimed.
────────────────────
Key Levels
First Resistance: 76,500
Second Resistance: 77,500
First Support: 75,200
Second Support: 74,800
────────────────────
Future Scenarios
A break above the First Resistance would indicate improving momentum and could open the way toward the Second Resistance.
However, if price falls below the First Support, sellers may extend the decline toward the Second Support.
────────────────────
Event Risk
Bitcoin may remain sensitive to U.S. macroeconomic data, Federal Reserve expectations, ETF-related flows, and overall market risk sentiment.
However, price action remains the key indicator. If positive news cannot lift BTC above the First Resistance, upside momentum may remain limited. Conversely, if BTC breaks below the First Support despite supportive headlines, it would suggest sellers remain firmly in control.
────────────────────
Please share your view below:
Do you expect Bitcoin to rebound from current support, or will the downtrend continue?
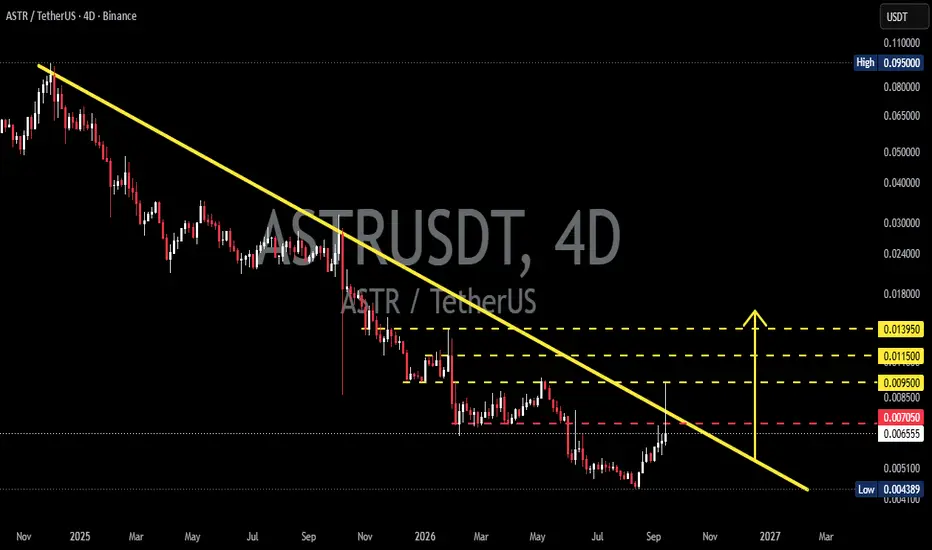
More market structure and key level updates will be shared regularly. ASTR — Key Resistance Test: Breakout or Rejection?The ASTR/USDT chart shows a Descending Trendline formed from the peak area around 0.09500 USDT, continuing to limit price movement through a series of Lower Highs.
📉 As long as the price remains below the yellow trendline, the medium- to long-term structure continues to show bearish pressure.
However, there is an interesting development as the price has rebounded from the Low around 0.004389 USDT and is now moving upward toward an important resistance area.
---
🟡 Descending Trendline Structure
🔻 Dynamic Resistance: The yellow trendline acts as the primary resistance that continues to pressure the price.
📉 Lower Highs: Several previous price peaks failed to break above the trendline, strengthening the validity of the Descending Trendline.
📈 Rebound: The price successfully bounced from the 0.004389 USDT area, indicating a buyer response at lower levels.
⚠️ Key Area: The price is currently around 0.006542 USDT, with the nearest horizontal resistance at 0.007050 USDT.
---
🟢 Bullish Scenario
🚀 The bullish scenario becomes more interesting if ASTR manages to break and confirm a breakout above the Descending Trendline.
📈 A valid breakout could indicate that bearish pressure is beginning to weaken and that the price structure may potentially shift.
🎯 Key resistance/target levels to watch:
🟢 0.007050 USDT — First horizontal resistance
🟡 0.009500 USDT — Next target/resistance
🟡 0.011500 USDT — Next resistance
🟡 0.013950 USDT — Major resistance zone on the chart
🔥 If the price successfully breaks above 0.013950 USDT, the upward structure would demonstrate significantly stronger momentum compared with the current condition.
⚠️ Important: The breakout should preferably be confirmed by a 4D candle close above the trendline, rather than relying only on a temporary wick.
---
🔴 Bearish Scenario
⚠️ The bearish scenario remains valid if the price fails to break the Descending Trendline and comes under renewed selling pressure.
📉 Rejection from the trendline could maintain the Lower High structure and potentially continue the downward trend.
🔻 If 0.007050 USDT turns back into resistance and the price moves lower, attention could shift toward:
🔴 0.006542 USDT — Current price area
🔻 0.005100 USDT — Next support
🟥 0.004389 USDT — Major Low on the chart
💥 Losing the 0.004389 USDT area would indicate that the previous rebound failed to hold and that bearish pressure is once again dominating.
---
⚖️ Conclusion
📊 ASTR/USDT is currently at an important stage within the Descending Trendline structure.
🔻 Bearish: As long as the price remains below the Descending Trendline, the bearish structure has not been fully invalidated.
🟢 Bullish: A breakout and confirmation above the Descending Trendline could open the way toward 0.007050 → 0.009500 → 0.011500 → 0.013950 USDT.
👀 The most important levels to watch:
0.007050 USDT + Descending Trendline
🚨 Do not consider a breakout valid based on a single wick alone. Candle confirmation and the price's ability to hold the breakout area will be important factors in determining whether the breakout is genuine or merely a false breakout.
#ASTR #ASTRUSDT #Crypto  Long
Long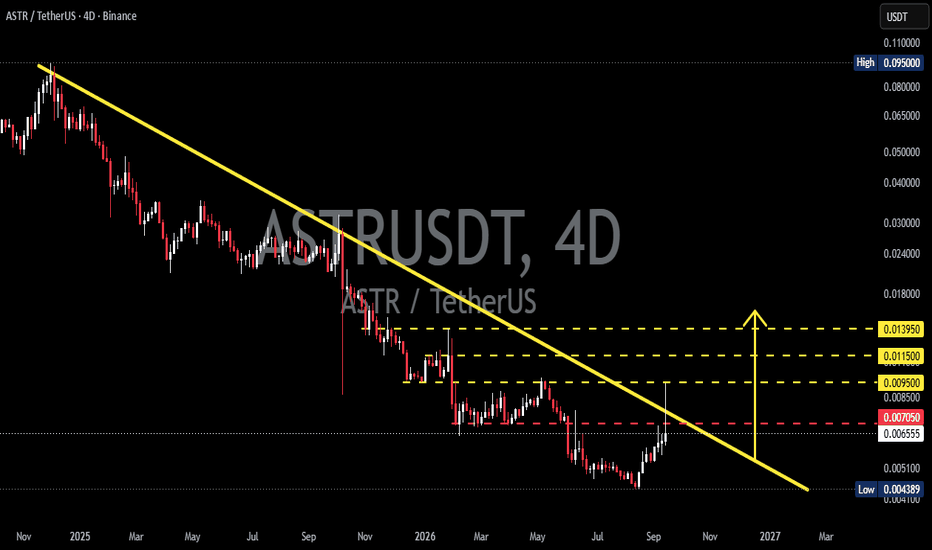
$ETH REJECTED FROM RESISTANCE | IS $1,800 NEXT?CRYPTOCAP:ETH REJECTED FROM RESISTANCE | IS $1,800 NEXT?
Ethereum has finally reacted from the $2,550–$2,660 resistance zone highlighted in yesterday’s analysis.
ETH is now trading below $2,400, marking an approximately 11% decline from its recent high.
The resistance rejection played out. But don't let Moonboys convince you that every dip is a buying opportunity.
My Next View: If ETH fails to reclaim and sustain acceptance above $2,670, the bearish scenario remains active.
A deeper correction toward $2,143 → $2,000 → $1,870 remains possible, with $1,800 as a key downside area to watch.
However, I am NOT bearish on Ethereum’s long-term potential.
My long-term targets remain unchanged: $10,000–$15,000.
NFA. Always DYOR.  Short
Short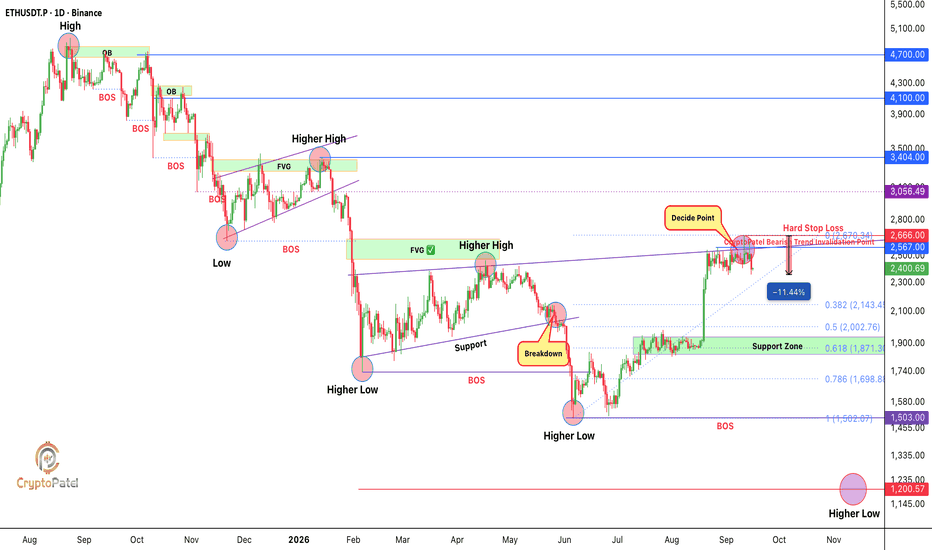
Long 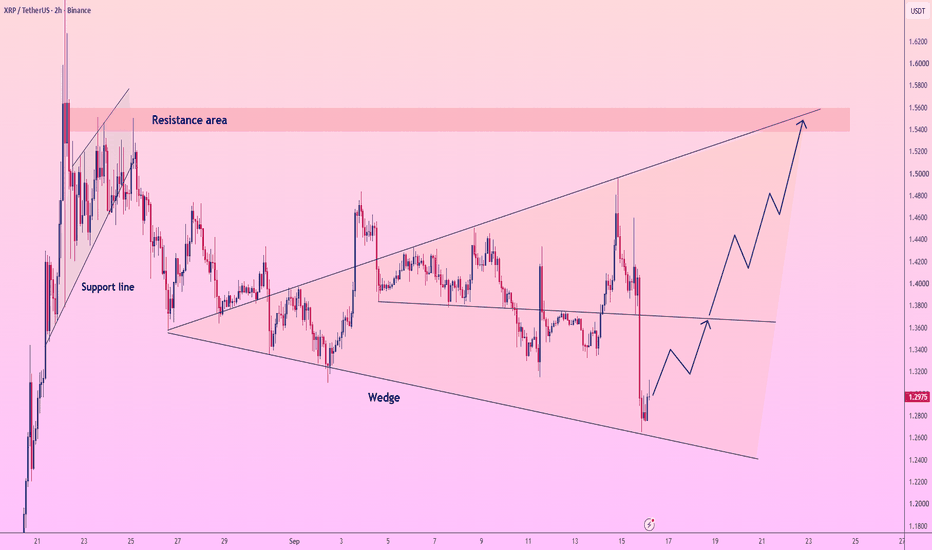
Bitcoin Approaches Volume Exhaustion at Major Support on 4HBitcoin Tests Major Support as Selling Pressure Approaches Exhaustion
Bitcoin remains in a bearish structure, with the recent decline pushing price back into the major 74,800–75,300 support region. This area aligns with the previous structural low, making the current reaction important. The latest candles are beginning to compress near the lows, suggesting that the aggressive bearish expansion may be entering a volume-exhaustion phase.
The chart also highlights a CZ around 76,700–77,200, which becomes an important recovery area if buyers start taking control. Before that recovery develops, Bitcoin may still need to spend time around the lows, potentially creating additional liquidity sweeps and false breakdowns.
Speculative Outlook
I’m watching for Bitcoin to potentially sweep below the current 74,800–75,200 support, possibly extending toward 74,300–74,500, before recovering back into the range.
If this develops alongside clear bullish confirmation and price starts reclaiming 75,500–76,000, the first major test would be the 76,700–77,200 CZ.
A successful recovery through that zone could signal a much larger structural reversal, bringing 78,000–80,000 back into focus and potentially opening the path toward the previous major highs around 81,500–82,000.
However, sustained acceptance below the volume-exhaustion region would weaken this recovery scenario and keep the bearish structure active. Long 
Short 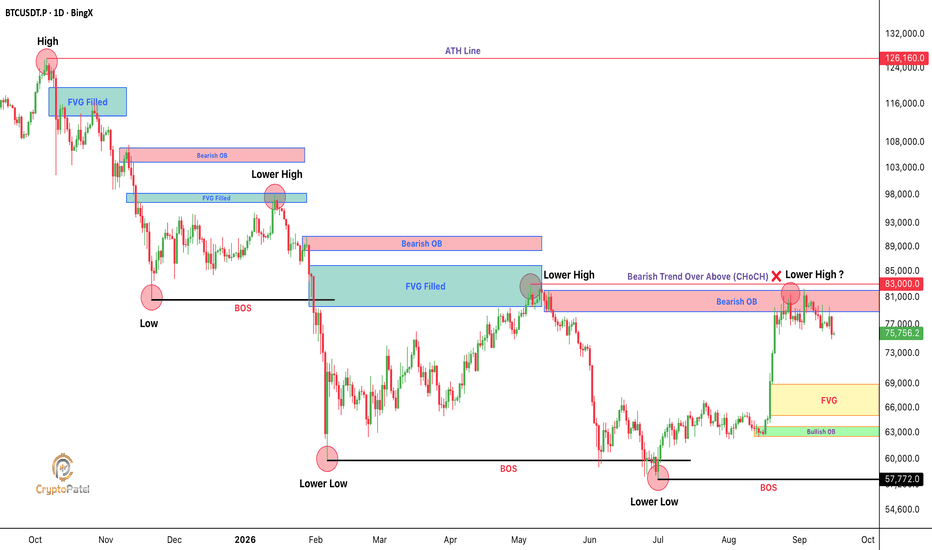
BTCUSD Bearish Structure | Support Rebound Setup (1H)
BTC is trading near the lower boundary of the current descending structure after a sharp selloff from the 79K area. Price is now consolidating close to the 74,800 support zone, making the next reaction important. A sustained hold above support could allow a recovery toward the nearby resistance levels.
🟦 Key Support Objective: 74,800–75,000
🟢 First Upside Objective: 78,000
🔵 Resistance Objective: 81,000–81,200
📊 Bias: Recovery attempt from major support; confirmation is required.
If BTC holds the 74,800–75,000 area and builds a higher low, a recovery toward 78,000 could develop. A sustained move above the descending resistance would strengthen the recovery structure and bring the 81,000–81,200 zone into focus. A decisive break below support would weaken the setup. Long 
16 Practical Elliott Wave Guidelines Every Trader Should KnowElliott Wave Theory can help traders understand market structure, identify impulsive and corrective phases, and frame potential entry and exit areas. However, Elliott Wave counts are not always straightforward, wave counts can change as new price action develops.
Here are 16 practical guidelines that can make Elliott Wave analysis easier to understand and apply.
1. Understand the Tradable Waves
The main waves that traders generally focus on are Wave 1, Wave 3, Wave 5, and Wave C .
Waves 1, 3 and 5 are impulsive movements, while Wave C is part of a corrective structure. These waves can provide opportunities to analyze trends and potential trade setups.
2. Wave 3 Is Usually the Most Powerful Wave
Wave 3 is typically the strongest and most dynamic wave of an Elliott Wave impulse.
It often develops with:
Strong price momentum
Increased trading activity
Greater participation from traders
Stronger momentum readings
Wave 3 should not be the shortest of Waves 1, 3 and 5.
3. Impulsive Waves Usually Contain Five Smaller Waves
Waves 1, 3 and 5 normally develop into five smaller waves: 1 → 2 → 3 → 4 → 5
Most corrections within these structures tend to appear as A-B-C patterns , although markets can also produce more complex or irregular corrections.
4. Wave 5 Can Show Less Volume Than Wave 3
It is common for Wave 5 to develop with lower volume than Wave 3 , even though price may continue moving in the same direction.
Therefore, lower volume during Wave 5 does not automatically mean that the trend has already ended.
5. Wave 5 Can Fail
Not every Wave 5 necessarily moves beyond the high or low established by Wave 3.
A failed fifth wave , sometimes called a truncated fifth, can result in a double-top or double-bottom type structure rather than a new extreme.
This is one reason traders should avoid assuming that price must always make a new high or low during Wave 5.
6. Combine Elliott Wave With Other Trading Evidence
Elliott Wave should preferably be used as part of a broader trading framework rather than as a standalone signal. For example, traders can combine wave analysis with:
Price action
Support and resistance
Fibonacci levels
Volume
Momentum indicators
Moving averages
Other objective trading signals
The goal is to build a grounded trading assessment rather than relying solely on a subjective wave count.
7. Be Patient With Wave 4 Corrections
Wave 4 can be particularly difficult to trade because corrections can become complicated.
A useful guideline is to look for the correction to develop clearly into an A-B-C structure before assuming Wave 4 has ended.
Fibonacci retracement levels can also provide useful reference points. The original guideline highlights the 38.2%–61.8% retracement zone between Waves 2 and 3 as an area traders may monitor.
Wave B is commonly discussed as a retracement of Wave A and generally should not exceed the beginning of Wave A in a normal corrective structure.
8. Simple Wave 2 Often Leads to a More Complex Wave 4
One useful Elliott Wave concept is alternation .
If Wave 2 is relatively simple, for example, a straightforward correction, Wave 4 may develop into a more complicated correction.
Conversely, if Wave 2 is complex, Wave 4 may be relatively simple.
This is a guideline rather than a guarantee.
9. Wave 2 Retracement Statistics
Wave 2 commonly retraces a portion of Wave 1. The statistics presented in the source suggest that:
About 12% of Wave 2 corrections retrace less than 38% of Wave 1.
Around 73% occur between approximately 50% and 60% retracement.
Around 15% retrace beyond 62% .
These figures should be treated as statistical guidelines, not fixed rules. Actual market behavior can differ considerably.
10. Wave 3 Can Extend Significantly
Wave 3 can sometimes become much larger than Wave 1. The referenced statistics describe three broad possibilities:
45% : approximately 1.6–1.75 × Wave 1
30% : approximately 1.75–2.62 × Wave 1
15% : approximately 1.0–1.6 × Wave 1
8% : greater than 2.62 × Wave 1
The important takeaway is that Wave 3 can extend considerably , so traders should avoid assuming that a strong Wave 3 movement must end after reaching a small predefined target.
11. Wave 4 Commonly Retraces Part of Wave 3
Wave 4 is another corrective phase. The statistics in the source indicate that Wave 4 frequently retraces approximately:
30%–50% of Wave 3
A smaller portion may retrace around 24%–30%
Another portion may retrace approximately 50%–62%
These levels can be used as areas of interest, rather than automatic entry or exit signals.
12. Use Fibonacci Extensions for Wave 5
Wave 5 can sometimes be estimated using Fibonacci extension calculations .
A commonly monitored range is approximately: 1.0–1.62 × the distance from the beginning of Wave 1 to the end of Wave 3
However, Wave 5 can also extend further, so Fibonacci projections should be treated as potential zones rather than guaranteed targets.
13. Manage Risk When Trading a Potential Wave 5
If a trader identifies a potential Wave 5 setup after a Wave 4 correction, Fibonacci retracement levels can help define the risk.
For example, if the Wave 4 correction appears around the 38.2% or 50% retracement area, a trader may monitor the 61.8% level as an important invalidation/risk reference.
Most importantly: Position size should be adjusted according to the distance to the stop-loss.
Once the Wave 5 structure becomes more convincing, additional confirmation from other trading signals can be considered.
14. Trade in the Direction of the Larger Wave Structure
A useful principle is to align trades with the direction of the primary wave structure.
For example, traders may focus on setups that agree with the direction of: Wave 1 → Wave 3 → Wave 5 → Wave C
on the timeframe being analyzed.
This can help prevent taking trades that conflict with the broader market structure.
15. Use a Higher Timeframe for Confirmation
Wave analysis can become more reliable when the larger timeframe supports the same directional structure.
One approach is to examine a timeframe one Fibonacci degree higher than the trading timeframe. For example:
Lower timeframe: identifying the trade setup
Higher timeframe: checking whether the broader wave direction agrees
This multi-timeframe approach can help filter some conflicting signals.
16. Elliott Wave Counts Can Change
This may be the most important guideline of all : An Elliott Wave count is an interpretation of current market structure. As price develops, what initially appears to be one wave can sometimes become another wave structure.
For example, a correction that appears to be Wave 4 may continue beyond the expected level and force the trader to reconsider the count.
Therefore: Never let a wave count override your risk-management rules.
Always define your invalidation level and respect your stop-loss. If the market proves the original wave count wrong, the trader should be prepared to revise the analysis.
👋 Do you use Elliott Wave analysis in your trading? Which guideline do you find most useful? Share your thoughts in the comments. ❤ Education 
 Long
Long
BTCUSDT: Daily seller pressure and local H1 scenariosOn the daily BTCUSDT chart, sellers still hold the initiative. A seller initiative has formed, and the key IC is also a seller candle.
Price has approached the daily support at 75,545, while the Target of the current initiative is 61,306.84. For this reason, buying on the daily timeframe remains risky for now: the broader context still favors sellers.
The hourly chart looks more interesting. Two local scenarios can be considered here.
Buyer scenario: to look for long opportunities, it is important to see price reclaim 77,343, then break and hold above 78,250. The next important area is 79,485, while the local target is around 80,000. The green area on the chart marks the zone where buyer confirmation can be monitored.
Seller scenario: if price fails to recover and sellers gain acceptance below the 76,306–75,545 area, this could create an opportunity to look for further downside continuation. The next important level below is the monthly level at 74,092.
So, on H1 there are possible scenarios in both directions, but the higher-timeframe context remains important: on D1, the preference is still with sellers for now. Both scenarios and the areas where confirmation can be monitored are marked on the chart.
Profitable trades!
This analysis is based on the Initiative Analysis (IA) method.