Crypto market
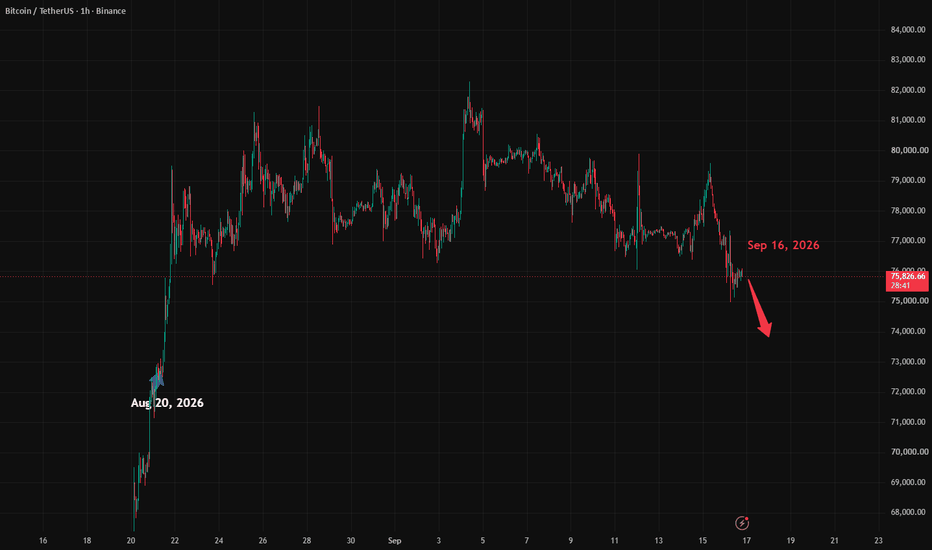
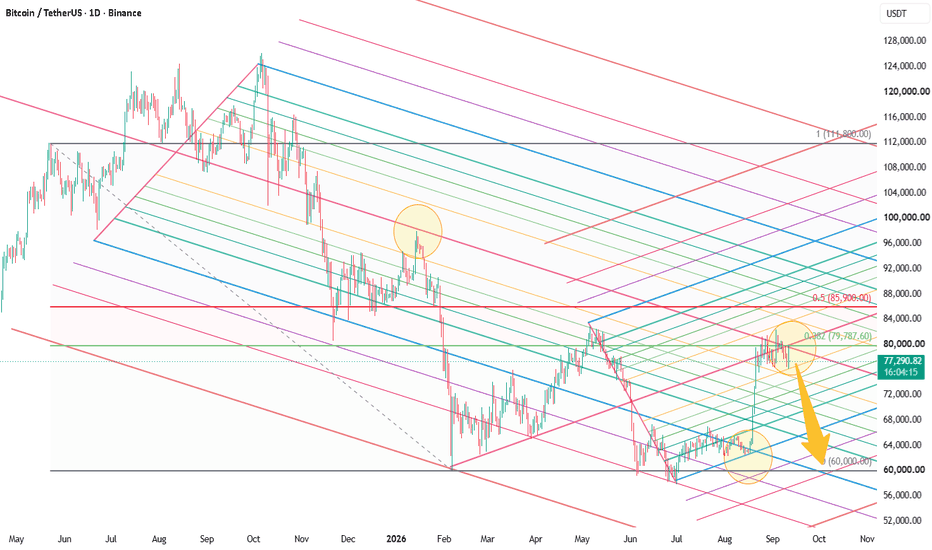
BTC: Short Worked, Now Watching the Blue Box for a Risk-Defined
Summary:
BTC rejected from the red resistance box and the short setup worked.
However, I do not want to assume straight downside from here.
The current structure still leaves room for a possible upside reaction, especially around the blue box.
The key point is risk management.
The blue box can offer a long reaction area, but if the ABC structure is already complete, downside can accelerate quickly.
Short setup:
The initial strategy was to look for a short after the running flat / triangle-type correction appeared to complete near the red resistance box.
That short setup worked.
Price reacted from the resistance area and moved lower.
However, a successful short does not automatically mean that the market must continue falling in a straight line.
Wave structure:
The reason I am watching the blue box is the light-blue wave structure.
The current C wave looks short compared to the A wave.
In price terms, it is only around 0.618 of the A wave.
It also looks short in time.
Generally, C waves or Y waves often extend longer than the A wave.
Because of that, I do not want to completely ignore the possibility of another upside attempt.
Risk:
There is also an important risk.
If downside pressure is very strong, a short C wave or Y wave can still be valid.
If the ABC structure is already complete and the market is starting a larger downside move, price can fall fast and deep.
That means any long idea around the blue box needs tight risk management.
The long setup is only interesting because the invalidation can be relatively close.
If the zone fails, the idea should be reduced quickly.
Trading view:
For longs, the blue box can be a risk-defined reaction zone.
For shorts, if the downside starts to expand, wider partial profit-taking can be considered instead of exiting too quickly.
So the same area can matter for both sides.
For a long, it is a potential reaction zone.
For a short holder, it is a decision area: take profit, hold, or adjust based on the strength of the move.
Conclusion:
The red box short worked.
Now I am watching the blue box.
If price reacts well there, a long attempt can be considered with tight risk.
If the blue box fails and the ABC structure is already complete, a fast downside move remains possible.
The zone gives the area.
The reaction gives the setup.
This is a market structure analysis and personal trading journal, not financial advice.
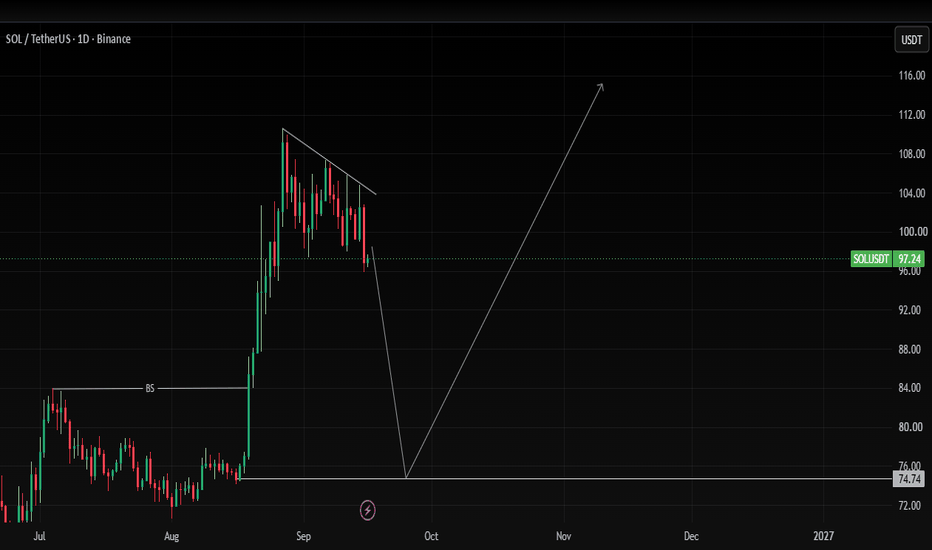
#SOL Beware of a Rebound 📊#SOL Beware of a Rebound 📈
🧠From a structural perspective, the 4-hour bullish structure remains intact. Unless we break below L (74.06) again, the probability of further gains remains high.
➡️Therefore, if we can stabilize in the S/R zone, we have a chance to see $80, $85, or even $92!
⚠️Risk management is essential for long-term survival in this market; please don't ignore it!
🤜Follow me, and I will guide you through market changes. Remember to like💖 and share💬
# BINANCE:SOLUSDT.P
Core Bearish DriversCore Bearish Drivers
(Dominant bearish factors driving the intraday pullback)
🌐1. Profit-taking on short-term rebounds; capital exits the market
After rebounding from a low of 59,100 to 65,500—a cumulative gain of over 10% across two waves—there is a significant volume of profitable short-term positions. ETF inflows were limited to a single day, lacking the momentum for sustained accumulation; institutions are primarily taking profits and reducing positions. Buying power lacks stamina, and the absence of fresh capital to take over after price spikes makes the asset highly susceptible to a pullback.
🔷2. Short-term rebound in the US Dollar and Treasury yields weighs on crypto valuations
US retail and industrial data exceeded expectations, prompting the market to re-price Federal Reserve tightening expectations. The 10-year Treasury yield edged up and the US Dollar Index recovered, raising the holding cost of non-yielding digital assets. Capital has shifted slightly from the crypto market into fixed-income products, directly capping BTC's upside potential.
💎3. Heavy overhead resistance from trapped long positions; key resistance levels repeatedly tested but unbroken
The 64,400–64,700 range aligns with the 50-day moving average and the upper boundary of the previous consolidation zone, while 65,300–65,500 marks the recent rebound high. Repeated upward attempts have been beaten back by bearish selling pressure, making a breakout on low volume highly unlikely. A pullback followed a bearish divergence on the hourly chart, indicating that short-term bearish forces currently dominate the market.
SUI Scalping Trade SELL one Short from $0.7340SUI Scalping Trade
SELL one
Short from $0.7340
Currently $0.7340
Targeting $0.7220 or Down
(Trading plan IF SUI
go up to $0.76 will add more shorts)
Follow the notes for updates
In the event of an early exit,
this analysis will be updated.
Its not a Financial advice
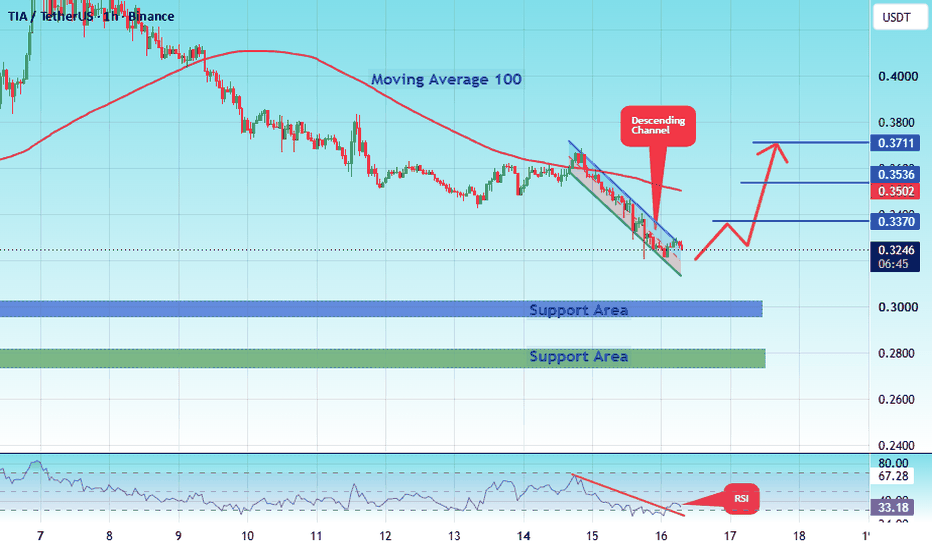
#CVXUSDT : Long-Term Breakout Signals Massive Upside Potentia#CVX
The price is moving within a descending channel on the 1-hour timeframe and has reached the lower boundary. It is now poised for a bounce and is expected to retest this boundary.
The Relative Strength Index (RSI) indicates a downward trend, which is likely to continue given the overbought conditions.
A key support zone (in green) has been identified at 1.09. The price has bounced off this zone several times, making it a strong support level.
The price is trending towards the 100-period moving average, which we are approaching. This trend supports an upward move.
Entry Price: 1.20
Target 1: 1.27
Target 2: 1.23
Target 3: 1.31
You can close at the second target or wait for the third target to be reached. The choice is yours.
Stop Loss: At the resistance zone (in green).
Remember this simple rule: Money Management.
Any questions? Please leave a comment.
Thank you.
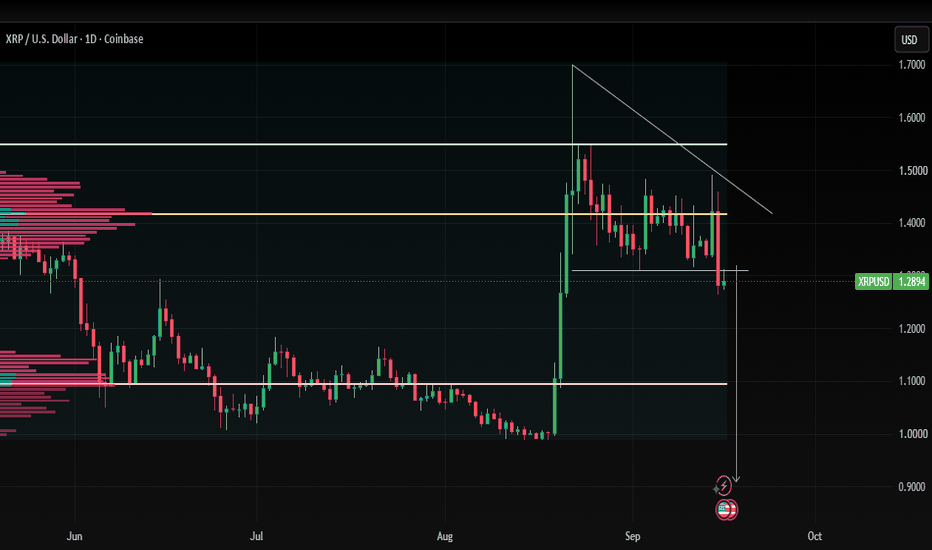
XRP/USD | Price Analysis Outlook | July 15, 2026
XRP is approaching a key decision zone where the next directional move is likely to be driven by volume confirmation rather than speculation. Price action remains highly sensitive to the broader crypto market, particularly Bitcoin's trend, institutional capital flows, and overall risk sentiment.
Bullish Scenario : A sustained breakout above immediate resistance could trigger momentum buying toward the next liquidity zone.
Bearish Scenario: Failure to hold support may invite fresh selling pressure, targeting lower demand levels.
🔑 Key Catalysts
₿ Bitcoin's price action and market dominance.
🏦 Institutional crypto inflows and ETF-related sentiment.
⚖️ Regulatory developments surrounding digital assets.
🌍 Global macroeconomic events, U.S. Dollar strength, and geopolitical tensions.
💸 Cross-border payment adoption and Ripple ecosystem developments.
Trade confirmations—not predictions. Let price lead, and manage risk with discipline.
Educational analysis only. Not financial advice.
#ILVUSDT Forming Bullish Momentum !#ILV
The price is moving within a descending channel on the 1-hour timeframe and has reached the lower boundary. It is now poised for a bounce and is expected to retest this boundary.
The Relative Strength Index (RSI) indicates a downward trend, which is likely to continue given the overbought conditions.
A key support zone (in green) has been identified at 2.75. The price has bounced off this zone several times, making it a strong support level.
The price is trending towards the 100-period moving average, which we are approaching. This trend supports an upward move.
Entry Price: 2.96
First Target: 3.03
Second Target: 3.10
Third Target: 3.20
You can close at the second target or wait for the third target to be reached. The choice is yours.
Stop Loss: At the resistance zone (in green).
Remember this simple rule: Money Management.
Any questions? Please leave a comment.
Thank you.
#HYPEUSDT 4h / QM#HYPEUSDT 4h
A bullish QM pattern is forming on **HYPE**.
If we get a valid confirmation from any of the blue demand zones, I'll be looking for long opportunities.
If the final blue demand zone fails to hold, the price could continue lower, and we'll update the analysis accordingly.
Price Can Mislead. Volume Adds ContextChase candles long enough and you'll end up as liquidity. Volume profile shows where the big money stepped in, not where retail got baited. Unlike regular volume, volume by price exposes where traders actually loaded up, that's where volume profile really shines. The market usually tips its hand if you know where to look.
🎯 Market Acceptance
Market acceptance is when price keeps hanging around the same zone while volume keeps piling in. That's real price acceptance, not a random pump.
Know your levels:
Point of Control (POC) — the busiest price.
High Volume Node (HVN) — where price likes to hang out.
Low Volume Node (LVN) — thin areas price often cuts through like a hot knife through butter.
Not every breakout tells the full story. Plenty of them end up being fakeouts that shake out the weak hands before the real move unfolds.
₿ Follow the Volume, Not the Noise
A solid Bitcoin volume profile can reveal whether buyers really have skin in the game. When BTC reclaims an HVN and volume analysis lines up, buyers mean business. On the flip side, repeated rejection around the point of control usually means the market isn't ready to pick a side.
🛠 Trade Smart
The TradingView volume profile is all most traders need. Pair your volume profile with market structure to read volume distribution across the ongoing market auction. Together with Market Profile, it paints a clearer picture of where the market accepts price—and where traders might just be barking up the wrong tree.
This content is for informational purposes only and should not be considered financial or investment advice.
Will $SHIB break out or extend its downtrend?BINANCE:SHIBUSDT remains trapped inside a descending channel, but the setup is approaching a decisive point. A confirmed breakout above $0.00000442 could shift short-term momentum in favor of the bulls, while failure to hold support at $0.00000412 would likely extend the ongoing downtrend.
With Bitcoin and Ethereum continuing to influence overall market sentiment, traders should monitor the channel boundaries closely before committing to a directional bias.
ETH/USD BULLS ARE STRONG HERE|LONG
ETH/USD SIGNAL
Trade Direction: long
Entry Level: 1,834.78
Target Level: 1,887.96
Stop Loss: 1,799.25
RISK PROFILE
Risk level: medium
Suggested risk: 1%
Timeframe: 1h
Disclosure: I am part of Trade Nation's Influencer program and receive a monthly fee for using their TradingView charts in my analysis.
✅LIKE AND COMMENT MY IDEAS✅
ETH 4H - Regular Flat (3-3-5) still looks textbookToday i'm sharing Ethereum as it comes close to an interesting area!
My primary count remains a regular flat correction.
Wave A completed as a 3 wave move.
Wave B retraced over 90% of A without making a new low, which fits the textbook definition of a regular flat.
From the B low, price appears to be developing an impulsive 5 waves for wave C.
If correct, we're currently working through wave 4 before one final push higher.
The ideal termination zone sits around the 1 - 1.382 extension, which would also take out the previous high.
Importantly, taking the high would NOT be bullish in this scenario, it would actually complete the regular flat structure and it's a minimum target for a regular flat!
After a completed 5 wave advance into resistance, I'd be looking for an impulsive reversal ultimately targeting the June lows.
Invalidation: A move below the Wave 4 invalidation level noted on the chart before Wave 5 completes would force me to reassess the count.
Elliott Wave is about probabilities, not certainties. This is simply the path that currently best fits the structure.
Sal....
*Dogecoin CRYPTOCAP:DOGE - 4H Technical Analysis*
*Current Price: $0.0718*
*Summary:*
DOGE is testing a major demand zone between *$0.0614 - $0.0685* marked in red.
*Scenarios:*
1. *Bullish*: Holding above $0.0685 targets *$0.1123* next.
Potential move: ~ +55%
2. *Bearish*: A 4H close below $0.0614 opens a drop toward *$0.0540*
*Key Levels:*
- *Support*: $0.0685 → $0.0614
- *Resistance*: $0.0800 → $0.1123
*Conclusion:*
This zone is critical. A bounce here confirms the next leg up. A breakdown invalidates the setup.
Risk management is key.
(If) 62.5k Holds Again — Eyes Back on 65kHey traders!🌴
After yesterday’s failed attempt to establish itself above 65k, Bitcoin started a correction, initially not very convincingly but gradually gaining momentum 🔪
Yesterday I warned:
“If the correction gains momentum and starts breaking below both the 4H EMA 200 and EMA 100, the key support levels remain unchanged:
- 62,500 — Key support level where price has been consolidating since early June ✅
- 60,800 — Local horizontal support
- 60,000 — Strong horizontal support”
Unfortunately for the bulls, Bitcoin did break below both the 4H EMA 200 and EMA 100, activating this bearish scenario and correcting all the way to the first key support at 62,500 ✅, where it has since produced a fairly confident bounce.
🐻🪓 As long as I continue to see this type of reaction and no confirmed break below 62,500, I do not expect the correction to extend toward 60,800 or 60,000.
🦬🚀 Moreover, if Bitcoin manages to hold the current level during today’s U.S. session, I expect another attempt to reclaim the 65k level in the very near term.
Peace everyone 🌄
BTC Lost The Shelf. The Pullback Became A Break.BTC Lost The Shelf. The Pullback Became A Break.
Yesterday the question was whether 63,625 would hold as a pullback into demand. Overnight it did not - BTC lost the shelf, swept a low to 62,588, and is trading 63,092. The 4H conviction that was holding the higher-timeframe bull case has rolled over to bottom-quartile bear, so the split that kept this two-sided has resolved down. This is a third straight day lower from the 65,559 high. Price is now just above the 62,459 range floor with a swept low beneath it - the level that decides range-hold versus a deeper leg. Neutral.
Resistance: 63,625.81 - the lost shelf, now overhead
Key resistance: 64,400.89 - the reclaim level
Current price: 63,092
Support: 62,459.75 - the range floor, the line that matters
Key support: 61,750.90 - the swept-low shelf
Structural floor: 60,556.17-60,423.01 - the deeper range floor
Two paths from here:
The swept low holds 62,459 and it bounces. Three days down into the floor with a low already swept is where reversals tend to start. If 62,459 holds and price reclaims 63,625, the slide was a shakeout and the range stands. Watch for the reclaim, not the wick.
The floor breaks and the range fails. Both timeframes have now rolled bearish and momentum is one-directional. A loss of 62,459 on a close opens 60,556 and turns the three-day pullback into a range breakdown. Below the floor there is air.
The pullback-into-demand read did not hold - BTC lost the shelf and the higher timeframe rolled with it. 62,459 is the whole game now: a low is already swept right above the floor, so the next move is either a shakeout bounce or the range giving way.
Built with SYNTHESIS v3.3 | SOM / ACE / IMP / SYNTHESIS
Study, not financial advice.
BTC/USDT | Real upwards move or just a false flag?By examining the 4H chart of BTCUSDT we can see that after CPI news drop yesterday, BTC managed to go from 62,780 all the way to 65,277, sweeping the Buyside Liquidity above the 62,700 level, and just below the 4H IFVG High at 65,354. Then it corrected a bit, and now is being traded at around 65,800.
Now if PPI confirms yesterday's CPI. I expect further rise for BTC, going towards the 65,622 level to sweep the liquidity there and then towards the IFVG Low at 66,961, if it goes inside the IFVG, then I'd like to see it sweep the liquidity above the 67,292 level. After that, I expect correction for BTCUSDT, being rejected by the IFVG Consequent Encroachment at around 67,500.
However if the news comes out the other way around, then drop for BTC is expected, with first target being at 63,600 and then 61,824 and 61,300 to sweep the liquidity below these 2 levels.
Why Funding Rates Quietly Drain Your AccountThere is a cost most crypto traders never watch, and it is charged to them every eight hours, whether they win or lose.
It does not show up as a loss on any single trade. It does not trigger a stop. It is not dramatic. It simply appears as a small deduction, over and over, so quietly that most traders never connect it to the slow bleed in their balance.
It is called funding, and if you trade perpetual futures, you are paying it or receiving it right now. So let us explain what it actually is, why it exists, and how it quietly works for you or against you.
🔵 What a Perpetual Actually Is
To understand funding, you first have to understand the strange thing you are trading.
A normal futures contract has an expiry date. A perpetual contract does not — it can be held forever. That is convenient, but it creates a problem. With no expiry to pull it back in line, the price of the perpetual can drift away from the real spot price of the coin.
Something has to keep the perpetual tethered to reality. That something is funding.
Funding is a small payment passed directly between long and short traders, on a schedule, to keep the perpetual price close to the spot price. The exchange does not keep it. It simply moves money from one side of the market to the other.
🔵 Who Pays Whom, and Why
The direction of funding depends on which side is crowded. When most traders are long and the perpetual is trading above spot, funding turns positive. That means longs pay shorts. The crowded side is charged, and the payment nudges people to stop piling in.
When most traders are short and the perpetual is trading below spot, funding turns negative. That means shorts pay longs. Again, the crowded side pays.
The logic is simple: the popular side of the trade subsidizes the unpopular side. It is the market's way of gently punishing the herd and rewarding the trader willing to stand on the other side.
Funding is a tax on crowding. The more obvious the trade, the more it can cost you to hold it.
🔵 Why It Drains You So Quietly
Here is why funding is dangerous. It is small, regular, and invisible in the moment. On most exchanges, funding is charged every eight hours — three times a day. Each individual payment looks tiny, a fraction of a percent. So a trader glances at it, decides it does not matter, and holds their position for days.
But small and regular is exactly how real money leaks away. A position held through a strongly trending market, on the crowded side, can pay funding again and again until the total cost quietly equals a meaningful chunk of the trade. The trader never sees a single painful deduction. They just notice, weeks later, that the account is smaller than their wins and losses alone would explain.
And the trap deepens with leverage. Funding is charged on the full position size, not on the margin you put up. So a trader using high leverage is paying funding on a position far larger than their actual capital — which means the drain, relative to their account, is far bigger than the tiny percentage suggests.
🔵 When Funding Turns Into a Real Problem
For a scalper who is in and out within an eight-hour window, funding barely matters. They may never pay it at all.
For a swing trader holding for days, it matters a great deal. Holding a crowded long through a euphoric run, or a crowded short through a capitulation, means paying funding at its most expensive, over and over, at exactly the moment everyone else is on your side.
This is the quiet irony. Funding tends to hurt most when you feel most comfortable — when the whole market agrees with you, the crowd is enormous, and the cost of being part of it is at its peak. The trade that feels safest to hold is often the one bleeding funding the fastest.
🔵 What to Actually Do About It
You do not need to fear funding. You need to see it.
Before you hold any position overnight, check the funding rate. Most exchanges show it clearly, along with the countdown to the next payment. If you are on the crowded side and funding is heavily against you, that is information — both about the cost of holding, and about how one-sided the market has become.
Factor it into your plan the same way you factor in fees. A trade that looks good before funding can look very different once you account for paying it three times a day for a week. And on the rare occasion funding is paying you to hold a position you already wanted, that is a small edge worth noticing.
imply this: funding is not noise. It is a real, ongoing cost that rewards patience on the unpopular side and quietly punishes comfort on the crowded one. Traders who ignore it wonder where their money went. Traders who watch it turn it into one more piece of the read
🔵 Final Take
Funding will not blow your account in a single moment. That is exactly why it is dangerous. It works in small, regular deductions that never feel like enough to worry about, until they add up to something that does.
If you trade perpetuals, funding is always running in the background — for you or against you. The trader who never checks it pays it blindly and calls the missing money bad luck. The trader who watches it knows the true cost of every position they hold, and sometimes gets paid to hold the trades nobody else wants.
Check the funding rate before you hold. It is one small habit that quietly protects the account everyone else is slowly bleeding.
Swallow Academy
BTCUSDT Demand Bounce Toward ResistanceBTCUSDT is currently reacting from a well-defined 1H demand zone after an impulsive bearish move. The decline created a clear Change of Character (CHoCH) to the downside, keeping the short-term market structure bearish. However, buyers have stepped in at support, suggesting a relief rally could develop before the next directional move.
From an SMC perspective, the recent sell-off likely swept liquidity below short-term lows and left an imbalance that price may attempt to rebalance. As long as the demand zone around 62.6K–62.8K holds, BTC has room to retrace toward the 63.8K resistance and potentially test the higher supply zone at 64.5K–64.8K.
A bullish confirmation would require a Break of Structure (BOS) above the recent lower high. Failure to hold the current demand zone would invalidate the recovery scenario and increase the probability of a continuation toward the 62.0K higher-timeframe support.
Key Levels
Support: 62.6K–62.8K
Major Support: 62.0K–62.2K
Resistance: 63.8K
Target Supply: 64.5K–64.8K
Bias: Short-term bullish retracement while above demand; overall trend remains cautious until buyers reclaim 63.8K.
GMT at macro floor: base recovery toward $0.0091The Macro Picture 🗺️
GMT unwound from the $0.0135 May high down to the $0.00691 macro floor and has stopped falling right on it. The heavy selling has flattened into a base, with price holding just above support rather than continuing to break down.
The Setup ⚙️
The Accumulation Zone 🟢
$0.00691–0.00741 is where the selling has dried up. The macro floor has held on every retest, and this is the demand shelf a recovery would build from.
The Decision Point 🔴
$0.01288 (Local High) is the bigger structural gate. Before that, the first objective is the $0.00911 measured-move target — reclaiming it proves buyers are back in control.
The Roadmap 🛣️
Hold the $0.00691 floor → recover toward $0.00911 → then challenge the $0.01288 decision level. Invalidation is a clean daily close below $0.00691 — that voids the accumulation thesis.
This is a textbook DCA Accumulation Zone setup: scale in across the $0.00691–0.00741 band and let the base do the work.
More setups in profile.
#GMT #STEPN #crypto #trading #TA #3Commas #DCA