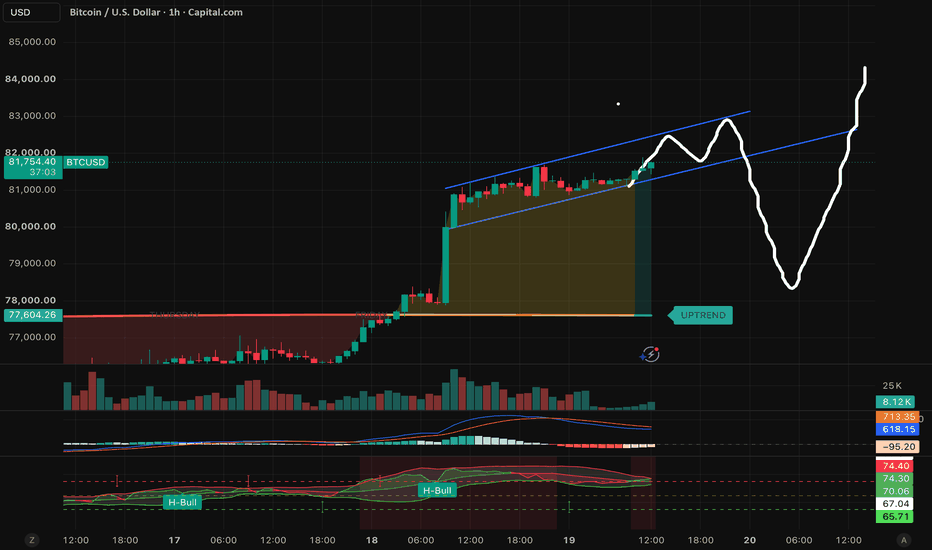
BTCUSD H1: The Bullish Structure Remains IntactBTCUSD continues to maintain its upward momentum within an ascending price channel after a strong recovery from the 62,500 area. The price is still forming higher lows and holding above the rising support line, indicating that buyers have not lost control in the short term.
Trading Plan:
A Buy (Long) scenario is preferred if the price pulls back toward the lower boundary of the channel and shows a clear bullish reversal signal. In this case, the next target will be the 66,755 resistance zone.
Invalidation:
The bullish scenario will weaken if BTCUSD breaks below the lower boundary of the channel and closes below the nearest support zone around 64,800–65,000 on the H1 timeframe.
Crypto market
ETHUSD H1: Will Resistance Stop Buyers Again?Ethereum has bounced back strongly after the recent drop, pushing back up toward the 1.930–1.940 resistance zone — the same area that capped price before and sent it sharply lower. Since this zone hasn't been retested yet, there's a decent chance we see a pullback before price moves on.
I'm favouring sells if price pushes into the 1.925–1.940 resistance zone and shows a clear rejection signal, stop loss above 1.945, first target at 1.880 and a further target at 1.825–1.840 — right at the marked support zone below.
If price breaks above and closes firmly over 1.945, this resistance zone will be considered cleared, and I'll stay on the sidelines waiting for a new structure rather than forcing a sell.
This is just my personal take based on technical analysis. Wishing you successful trading.
BTCUSD: 1H Double Bottom Breakout Targeting 67.2KHere is a ready-to-paste description structured for your TradingView post:
Overview: What I'm Seeing
On the 1-Hour chart, BTCUSD has confirmed a Double Bottom bullish reversal structure after breaking cleanly above the neckline / breakout entry level at 64,395.24. Price action is currently holding momentum around 65,533.45, maintaining a solid bullish trajectory following the initial expansion.
Key Technical Levels
Ultimate Target (TP2): 67,251.00
Initial Target (TP1): 66,131.70
Immediate Resistance: 65,756.09
Current Price: 65,533.45
Breakout Entry Level: 64,395.24
Key Support: 64,238.08
Stop Loss / Invalidation: 63,911.13
Trade Outlook & What to Expect Next
Bullish Expansion: The immediate hurdle for buyers is local horizontal resistance at 65,756.09. A clean hourly candle close above this level clears the path toward 66,131.70 (TP1) and our primary pattern objective at 67,251.00 (TP2).
Pullback / Retest: Any brief pullbacks toward the 64,395.24 breakout zone remain constructive re-entry opportunities, provided the local support at 64,238.08 holds.
Invalidation: A breakdown back below 63,911.13 invalidates the Double Bottom structure and signals failure of the breakout setup.
Disclaimer: This analysis is for educational purposes only and is not financial advice. Always practice proper risk management.
The #1 Crypto To BuyThe chances of learning how to
trade are pretty good and this is why its
to never give up on yourself.
Am still working on my
local business
and getting
rejection from customers is the worst
feeling ever
I really love my customers
but one customer called
the customer surpport
of the mobile company
and the customer surpport
helped me
to calm the customer down
its important to have surpport
i really think
the customer was stressed by the enovironment
that the mobile money business
brings
Many people get shocked at
how people
bully their way to get what they want
its a terrible human flaw
even good well working class
people want to cheat
on the line to get the service they deserve
i feel sorry for the good customers
and thank them when they show patience
anyway look at this chart notice the
the current day has passed the previous high
of the last day
this is called the new high
thats the daily buy signal
after a weekly pull back
this is the #1 crypto to buy
thank you for reading.
Rocket boost this content to learn more
Disclaimer:Trading is risky because you will lose money
please use a simulation trading account for practise
before you use real money
USELESS Key Support indicates bounce USELESS has reached a major high-timeframe support zone backed by multiple technical confluences, making this one of the most important areas on the chart for a potential trend reversal. Historically, regions with overlapping support often attract buying interest, but price must first establish a structured bottom before a sustainable rally can begin.
At this stage, traders should avoid assuming the low is already in. Instead, watch for signs of accumulation such as higher lows, a reclaim of nearby resistance, or a clear shift in market structure. These confirmations would indicate that buyers are regaining control and that the support zone is successfully holding.
As long as price remains above this key support region, the probability of a bullish recovery remains intact. Holding this level would allow the market to build a base, creating the foundation for a rotation back toward higher resistance levels and potentially a retest of the previous swing highs.
However, if support fails to hold, the bullish thesis would weaken significantly and could trigger another wave of selling as trapped buyers exit their positions. For now, this remains a high-probability reaction zone, but patience is essential. Allow the market to confirm a bottom before anticipating the next impulsive move higher, as confirmation often provides a higher-probability entry than attempting to catch the exact low.
KAS / KASUSDT Long Setup | Breaker Block ReclaimMARKET ANALYSIS
KAS is currently reacting from a key technical area highlighted on the chart.
As long as the protected support zone remains intact, the bullish market structure remains valid and higher liquidity targets may continue to attract price action.
A breakdown below the invalidation level would weaken the current bullish scenario and require a reassessment of market conditions.
📍 Entry, Stop Loss and Take Profit levels are marked directly on the chart.
━━━━━━━━━━━━━━
⚠️ DISCLAIMER
This publication is provided solely for educational and market observation purposes.
Nothing contained in this analysis should be considered financial advice, investment advice, or a recommendation to buy or sell any financial instrument.
All trading and investment decisions remain solely the responsibility of the individual trader.
Always conduct your own research and apply proper risk management before entering any position.
━━━━━━━━━━━━━━
🎯 PARALOG
▪️Crypto Market Analysis
▪️BTC Futures Signals
▪️Bitcoin & Altcoin Market Analysis
Precision • Momentum • Timing
━━━━━━━━━━━━━━
Exchange: #MEXC Futures
#bitcoin #btc #crypto #futures #technicalanalysis
POWR / POWRUSDT Long Setup | Breaker Block ReclaimMARKET ANALYSIS
POWR is currently reacting from a key technical area highlighted on the chart.
As long as the protected support zone remains intact, the bullish market structure remains valid and higher liquidity targets may continue to attract price action.
A breakdown below the invalidation level would weaken the current bullish scenario and require a reassessment of market conditions.
📍 Entry, Stop Loss and Take Profit levels are marked directly on the chart.
━━━━━━━━━━━━━━
⚠️ DISCLAIMER
This publication is provided solely for educational and market observation purposes.
Nothing contained in this analysis should be considered financial advice, investment advice, or a recommendation to buy or sell any financial instrument.
All trading and investment decisions remain solely the responsibility of the individual trader.
Always conduct your own research and apply proper risk management before entering any position.
━━━━━━━━━━━━━━
🎯 PARALOG
▪️Crypto Market Analysis
▪️BTC Futures Signals
▪️Bitcoin & Altcoin Market Analysis
Precision • Momentum • Timing
━━━━━━━━━━━━━━
Exchange: #MEXC Futures
#bitcoin #btc #crypto #futures #technicalanalysis
According to me 2026This analysis is intended solely as a technical review of historical BTC price movements. It does not incorporate market sentiment, current market conditions, macroeconomic indicators, BTC ETF developments, or institutional involvement.
The suggested price levels are derived exclusively from historical price patterns. For additional context, the following TradingView analysis illustrates how a similar historical-pattern approach was previously used to anticipate the 2025 market top approximately two years in advance:
BTC SHORT trade going in Huge ProfitBTC SHORT trade going well, hits 1st Target (400+ points). BTC hits the higher liquidity and I was waiting for that moment to plan a SHORT trade. I was looking the 15min candle to breakdown after that I planned and enter on the trade on 1min Timeframe. Market had not much volume at first but later then BTC started going according to my plan and gave my 1st Target. Looking forward to my all given Targets but I already booked most of the profit. Thank You...(_)
SPACE ID (ID) LONG — 8H ALMA Setup (WR 78%)█ SETUP
BYBIT:IDUSDT.P · 8H · long only.
(Context: SPACE ID — crypto identity / web3 naming protocol; alt-beta to BTC liquidity and risk appetite.)
ALMA Averaging Strategy: ALMA 3 / σ2, SD band 2, min diff 6 bars to add / 1 bar to exit, 25% per bar, up to 4 adds, hard stop −10% from average entry.
Strategy Tester (ID 8H):
Win rate 78% · profit factor 3.3 · max drawdown 9.6%
Avg winning trade +11.7% · avg losing trade −6.8%
Typical hold ~13×8H bars on winners — alt-identity mean-reversion grid on the 8H Averaging template · 72-trade sample
█ WHY NOW
Fresh 8H ALMA long on the 20 Jul 16:00 UTC bar ~ 0.03147 — first lot on this Averaging template (1 of 4).
Bar-close ENTRY on the Bybit perp — not a discretionary SPACE ID narrative chase and not a hand-picked “alt dip” call. Hard stop −10% from fill ~ 0.0283 . Exits follow Pine ALMA flip + min diff or the hard stop. Scale-in stays 25% per bar, up to 4 adds, if lower bars qualify (entry gate needs 6 bars between adds).
═
█ MACRO
Sector: ID = SPACE ID — on-chain identity / naming beta; flows track broad alt risk appetite more than a single protocol catalyst.
Tape (mid–20 Jul): crypto still chopping after the mid-Jul risk-off / repair week — BTC around the mid-$60Ks into 20 Jul, with thin name-specific SPACE ID headlines in the window. No dated ID catalyst overrides the fill.
Execution is 8H ALMA Averaging on the arm bar, not a token-roadmap or “alt season” forecast.
═
█ OUTLOOK
Positive factors
- Tester skew: 78% WR · PF 3.3 · avg win +11.7% vs avg loss −6.8% — workable hit-rate with winners larger than typical losers on a 72-trade sample
- Fresh ≤24h first lot ~0.03147 — template just armed, not a late chase into a finished move
- Close-to-close max drawdown ~9.6% on the tester path — path risk is contained vs many alt grids, while the live −10% hard stop still bounds script risk per ladder
- 8H clock + 6-bar add gate = slower scale-in than 4H meme grids — fewer frantic add prints if the wash extends orderly
Negative factors
- Snapshot gap — no factor board: ID not on the 20 Jul watchlist collect — no independent EMA / ALMA Cur-vs-Avg, SMC, or VWAP Touch confirmation; technical read is live 8H chart + strategy overlay only
- First lot only (1 of 4) — no averaged cushion yet if 8H extends lower before the 6-bar add gate qualifies
- Alt-beta / perp gap risk — BTC risk-off days can wick thin identity names through a %-stop before the next bar close
- No fresh SPACE ID headline or research brief in-window — nothing idiosyncratic cushions a broad alt flush
- Avg win vs avg loss is solid but not extreme — one extended loser can still offset several small wins if the ladder prints the full stop path
Takeaway: the 8H ALMA strategy and 78% WR / PF 3.3 support a disciplined first-lot long at ~0.0315, but the missing factor board, first-lot-only state, and pure alt-beta tape frame a scripted mean-reversion grid — not a catalyst bounce; nominal risk stays on the −10% hard stop / Pine exit path.
Base case: follow 8H ALMA Averaging · hold/add on qualifying bars while BTC/alt beta stays orderly · grind toward the next ALMA exit band if the mid-Jul repair continues without a fresh risk-off gap.
Bear case: lose 8H ALMA · BTC risk-off gaps the perp · −10% from ~0.03147 toward ~0.0283 · template posts the stop and waits for the next bar-close arm.
Chart: BYBIT:IDUSDT.P 8H — ALMA Averaging Strategy.
Educational idea. Live position — past backtest ≠ future results. NFA.
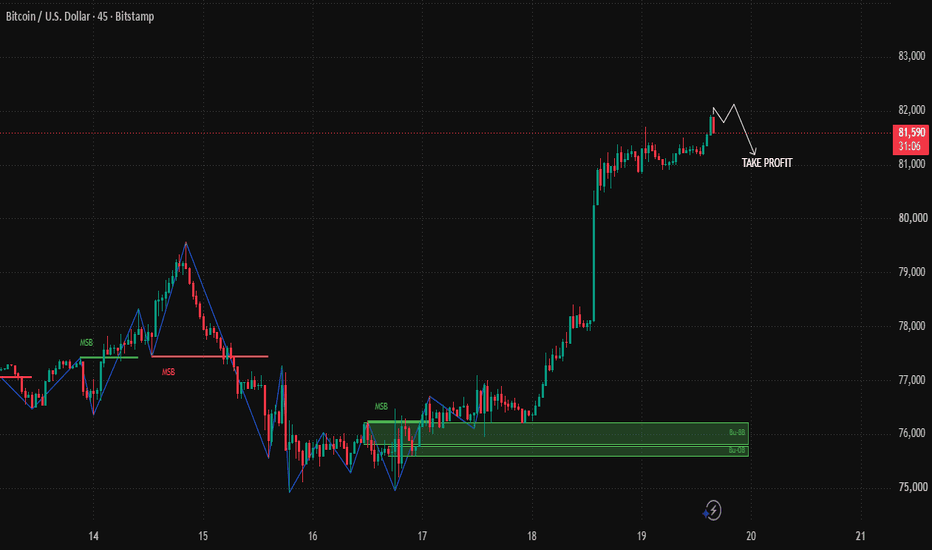
Market Outlook📉 BTCUSD | 1H
🧹 Price swept the Buy-Side Liquidity (BSL) and followed it with a Bearish BOS, confirming short-term weakness.
📍As long as price stays below this supply zone, I see the current move as nothing more than a retracement.
🎯 My main draw on liquidity remains the Sell-Side Liquidity (SSL) resting below.
⚠️ A strong reclaim above the supply zone would invalidate this bearish idea.
Let's see how price reacts. 👀📊
Fear & Greed Index. How to use this?Every time the market drops, you see the same comments everywhere: "This is the bottom, buy now" or "It's over, sell everything" But most people never actually check what the data is telling them. They're just reacting to price.
Let's talk about the Fear & Greed Index one of the simplest tools to measure market psychology, and why right now it matters more than usual.
📊 What is it?
The Fear & Greed Index combines several factors into one number from 0 to 100:
• volatility
• market momentum & volume
• social media sentiment
• surveys
• Bitcoin dominance
• Google search trends
0-24 → Extreme Fear
25-49 → Fear
50 → Neutral
51-74 → Greed
75-100 → Extreme Greed
Right now the index sits at 29 — solid Fear territory 😨
⚖️ Why does this matter?
Because this index works best as a contrarian tool, not a trend-following one.
Historically:
→ Extreme Fear often lines up with local bottoms, when retail has already capitulated
→ Extreme Greed often lines up with local tops, when retail is euphoric and buying the top
This is exactly why "be fearful when others are greedy, and greedy when others are fearful" isn't just a quote — it's literally describing this index.
❗️But here's the nuance
Fear ≠ automatic buy signal.
The index can stay in Fear for weeks, and even go lower before any real reversal.
Right now BTC is trading near $64K, still well below its 200-day EMA around $74K. That's a structurally bearish position Fear here isn't confirmation of a bottom, it's confirmation that the broader trend is still damaged.
📌 So what should you actually do with this data?
Don't use Fear & Greed as a trigger on its own.
Use it as a filter:
• Extreme Fear + price still below key EMAs → this is not the moment to go all-in, it's the moment to start scaling, not gambling
• Extreme Fear + price reclaiming key EMAs → that combination is where real accumulation opportunities appear
The index tells you about crowd emotion. Your levels tell you about structure.
You need both to agree before you act.
🤷♂️ Most people either panic-sell in Fear or FOMO-buy in Greed and both groups end up on the wrong side of the move.
Stay data-driven, not emotion-driven.
_____
👉 Want more insights like this? Follow for real analysis, not noise 🚀
SOL PERPETUAL TRADE SELL SETUP Short from $76.40SOL PERPETUAL TRADE
SELL SETUP
Short from $76.40
Currently $76.40
Targeting $74.40 or Down
(Trading plan IF SOL go up to $80
will add more shorts)
Follow the notes for updates
In the event of an early exit,
this analysis will be updated.
Its not a Financial advice
The Bullish Order Block on 15 minute Time frameRange-bound consolidation with bullish intraday momentum. Price expanded aggressively out of the local double-bottom formed around July 18–19 at 0.32201, sweeping liquidity and pushing straight back up into key resistance.
The Logic is Sound (High R:R):
Buying near structural demand with a target at range highs yields an attractive Risk-to-Reward ratio (> 5:1).
The Catch — Execution Risk (Will price drop that low?):
Price is currently trading at 0.32674—very close to breaking out above range highs.
Waiting for a full retracement back down to 0.32279 requires price to sell off over 1.2%, which would break the current intraday upward momentum.
If price drops all the way back to 0.32279 with strong selling volume, the buying pressure might be exhausted by the time it reaches your limit order.
KAITOUSDT Forming Bullish MomentumKAITOUSDT is forming a clear bullish momentum pattern, a classic bullish wave signal that often indicates an upcoming breakout. The price has been consolidating within a narrowing range, suggesting that selling pressure is gradually weakening while buyers are beginning to regain control. With consistent trading volume confirming accumulation at lower levels, the current setup hints at a potential bullish breakout in the near future. The projected move could lead to an impressive gain of around 90% to 100% once the price breaks above the key resistance level.
This bullish momentum pattern is typically seen at the end of downtrends or corrective phases, representing a potential shift in market sentiment from bearish to bullish. Traders closely watching KAITOUSDT are noticing strengthening momentum as the price approaches a critical breakout zone. Strong trading volume adds confidence to this setup, showing that market participants are positioning early in anticipation of a sustained upward move.
Growing investor interest in KAITOUSDT reflects increasing confidence in the project's long-term fundamentals and its improving technical outlook. If the breakout is confirmed with sustained buying volume, it could mark the beginning of a fresh bullish leg. The ongoing consolidation phase suggests steady accumulation, creating favorable conditions for a strong continuation rally once the resistance level is cleared.
Traders may find this an attractive medium-term opportunity, especially as the bullish momentum pattern nears completion and buying pressure continues to build. A confirmed breakout could attract additional market participation and accelerate the move toward the projected upside target.
✅ Show your support by hitting the like button.
✅ Leaving a comment below! (What is You opinion about this Coin)
Your feedback and engagement keep me inspired to share more insightful market analysis with you!
HEIUSDT | Bearish Head & Shoulders Pattern Forming#HEIUSDT has experienced a strong volume-driven rally, but the recent price action on the 1-hour timeframe is showing signs of potential weakness.
A well-defined **Head & Shoulders pattern** has formed, which is one of the most reliable bearish reversal structures in technical analysis. This suggests that buyers may be losing momentum and a trend reversal could be developing.
Trade Plan:
• Wait for a confirmed break below the neckline.
• Avoid entering before confirmation.
• Upon a successful neckline breakout, look for short-selling opportunities.
• Manage risk carefully and adjust position size according to your trading plan.
Remember: Patterns provide probabilities, not guarantees. Confirmation and proper risk management remain the key to long-term success.
What do you think? Will HEIUSDT break the neckline and continue lower, or will buyers defend the level? Share your analysis in the comments!
👍 Like if you found this setup useful
💬 Comment your target levels
🚀 Follow for more high-probability crypto setups and market insights
#HEIUSDT #CryptoTrading #TradingView #TechnicalAnalysis #HeadAndShoulders #BearishPattern #ShortTrade #CryptoSignals #PriceAction #RiskManagement #Altcoins #CryptoMarket
JTO LONG — 4H ALMA Setup (WR 81%)█ SETUP
BYBIT:JTOUSDT.P · 4H · long only.
(Context: Jito — Solana liquid staking / MEV infra beta; trades with SOL liquidity and alt risk appetite.)
ALMA Averaging Strategy: ALMA 3 / σ2, SD band 2, min diff 6 bars to add / 1 bar to exit, 25% per bar, up to 4 adds, hard stop −10% from average entry.
Strategy Tester (JTO 4H):
Win rate 81% · profit factor 2.0 · max drawdown 43%
Avg winning trade +9.9% · avg losing trade −8.7%
Typical hold ~21×4H bars on winners — Solana-infra mean-reversion grid · 97-trade sample
█ WHY NOW
Friday 4-hour cluster — two ALMA long lots on the same 81% WR template:
· 17 Jul 12:00 UTC ~ $0.5577
· 17 Jul 16:00 UTC ~ $0.5500 (second add · pyramid 2 of 4)
Working blend ~ $0.5539 . Bar-close scale-in into the BTC risk-off wash — not a discretionary Jito roadmap trade.
Hard stop zone −10% from blended average ~ $0.4985 . Exits follow Pine ALMA flip + min diff or the hard stop.
═
█ MACRO
Sector: JTO = Jito Network — Solana liquid staking (JitoSOL) · Block Engine / MEV · BAM · JTX self-custody spot terminal; beta to SOL activity and validator yield.
Fundamental (30d → 18 Jul): Structural Bid — JIP-38 passed (13 Jul): token-centric network · 100% DAO share of JTX fees → programmatic JTO buyback & burn through Q4 2027 via Rev Splitter; JTX live for first 1,000 waitlist users (14 Jul) after late-Jun early access. On-chain footprint: >95% active Solana stake on Jito client · ~$79M MEV fees (late-Jun ref.). Near-term drag: July linear unlock ~18.59M JTO (~3.8% circulating · ~$14M notional) arriving before JTX fee scale; post-launch derating ~$0.96 peak (07 Jul) → ~$0.54–0.56 into fills.
Tape (17 Jul): Bitcoin under ~$62.5K on Iran / US-equities pressure — SOL-ecosystem beta soft with BTC; governance/fee-switch headlines already printed mid-week, fill bars are risk-off mean-reversion.
Window read: mixed — JIP-38 + JTX value-accrual +, July unlock + sell-the-news + macro beta −.
Execution is 4H ALMA at the ~$0.55–0.56 cluster — not a JTX revenue or unlock forecast.
═
█ OUTLOOK
Positive factors
- 81% WR · PF 2.0 · avg win +9.9% vs avg loss −8.7% · ~21×4H bars — high hit-rate grid in a 97-trade sample (payoff skew modest; edge is win frequency)
- Fresh twin adds inside the 24h window on the same Averaging template · pyramid 2 of 4 still has room if the script qualifies further bars
- Fundamental — fee-switch: JIP-38 routes DAO JTX revenue into open-market buyback/burn ≥1 year — long-cycle value accrual under the post-launch wash
- Fundamental — infra footprint: >95% Solana stake on Jito client · MEV fee base still frames the network as core Solana market plumbing, not a pure meme LST
- Working blend ~$0.5539 sits under the first-lot print — second add improved average into the dip after the ~$0.96 → ~$0.55 giveback
Negative factors
- Fundamental — supply before revenue: ~18.6M JTO July vesting (~3.8% circ.) lands while JTX is still a 1k-user rollout — burn math lags unlock flow near-term
- Post-launch derating: ~40% off the window high into ~$0.55 — sell-the-news structure still dominates short-term tape
- Max drawdown ~43% on the tester path — path risk is real even with an 81% hit rate; size for adverse 4H gaps
- Avg win only slightly larger than avg loss — this is not a fat right-tail template; one extended loser can offset several small wins
- Solana-infra beta can gap with BTC / SOL headline risk on 4H perps — stop slippage possible through the −10% zone
- Past backtest ≠ live fills; geo tape can invalidate a clean mean-reversion path before the typical ~21-bar hold completes
Takeaway: the 4H ALMA strategy and 81% WR support the long into the Friday twin-add cluster, and JIP-38 / JTX keep a constructive value-accrual floor — but July unlock timing, post-launch derating from ~$0.96, and a ~43% tester drawdown path frame a disciplined grid into a mixed fund window, not a high-convexity bounce; nominal risk stays on the −10% hard stop / Pine exit path.
Base case: 4H ALMA holds · blend ~$0.55 holds as a base · grind higher if SOL/alt beta stabilises with BTC and first JTX fee → burn prints become visible.
Bear case: fail 4H ALMA · unlock / SOL beta extends · −10% from ~$0.5539 blend toward ~$0.4985 · perp gap through the hard-stop zone.
Chart: BYBIT:JTOUSDT.P 4H — ALMA Averaging Strategy.
Educational idea. Live position — past backtest ≠ future results. NFA.
Reading the Clarity Score [EmpArchitect]Every detection carries a number out of 27. Most people see "21/27" and read it as "good," "16/27" as "meh." That's not wrong, but it misses what the score is actually measuring — and what it deliberately isn't.
◆ What it measures
Clarity scores structural alignment, not probability. It asks: how cleanly do the pieces of this setup agree? A fresh zone, clean liquidity around it, a decisive displacement leaving it, higher-timeframe context pointing the same way — each of those pushes the number up. A retouched zone, messy liquidity, a weak break, conflicting context — each pulls it down. The score is a measure of how textbook the structure is, compressed into one number so you can triage 170 charts in seconds instead of reading each one cold.
◆ What it does not measure
It does not measure whether price will react. This is the part traders get wrong. A 21/27 is not "21/27 chance of working" — it's "the structure here is unusually clean." Clean structure and a guaranteed bounce are different things. The market can run straight through a picture-perfect zone; the score describes the setup, not the outcome. Anyone selling you a clarity number as a win rate is selling you something the number can't be.
◆ The floor, and why it exists
Nothing below 15 ever posts. That's not arbitrary — below 15, too many of the alignment pieces are missing for the detection to be worth your attention at all. The floor is the scanner doing the first layer of "ignore" for you: the genuinely low-quality structure never reaches your screen. So the range you actually see is compressed — 15 to 27 — and within it:
20–27: strong alignment. Most pieces agree. Worth opening the chart.
15–19: moderate. Something's off — could be a retouch, a weaker break, mixed context. Worth a glance, not a deep look, unless price does something at the level.
◆ Why retouched zones cap at 15
A revisited zone can't score above 15, by design. It might have perfect liquidity and strong context — doesn't matter. Once a zone's been tapped, it's spent some of its information (the fresh-vs-retouched idea), so the score refuses to let a tapped zone masquerade as a pristine one on the strength of its other features. The cap is an opinion baked into the number: freshness isn't just one input, it's a gate.
◆ How to actually use it
The score is a sorting tool, not a verdict. High score means "this one's clean, look first." It never means "take this." The decision still runs through your own confirmation on the lower timeframe — the number just decides the order you review things in, so your attention goes to the cleanest structure first and the noise never reaches you at all.
Nothing here is an entry, a target, or a stop. The score sorts your attention; you make the call.
Not a signal — just the map.
Ethereum Retests Key Resistance as Final Washout Risk RemainsEthereum is outperforming Bitcoin, which may suggest the bear market is approaching its final stage.
However, the broader trend remains bearish while ETH stays below the $2,000–$2,100 resistance zone.
Key Trading Levels
Resistance: $2,000–$2,100
Bullish confirmation: Close above $2,100
Downside target: $1,300–$1,400
Extreme target: $1,000–$1,100
Current bias: Bearish below $2,100
A final sell-off into these lower zones could create strong long-term buying opportunities.
ETH: Medium-Term Uptrend WeakeningETH: Medium-Term Uptrend Weakening – Optimal Short Positioning Strategy for a Macro Reversal Wave
Ethereum is approaching a highly sensitive and decisive phase of its medium-term upward trajectory. Following a steep decline toward the $1500 support base, the price action managed to structure a recovery channel characterized by a textbook sequence of 5 consecutive higher highs and higher lows. However, based on the visual data from the 4-hour chart , the current price behavior is hovering fluidly around the $1880 mark and is gearing up for another consecutive retest against the ascending support trendline.
In market structure theory, an upward trend that has already logged an excessive number of peak-to-trough validations typically points to exhaustion and carries an elevated risk of a powerful downward breakdown. The ideal technical trigger point for this reversal scenario is projected to reside near the $2000 psychological round number resistance zone. A speculative push into this cluster is expected to face heavy selling pressure from profit-taking bulls, turning it into an ideal liquidity zone to build a macro trend-following sell position.
Consequently, the smartest trading behavior right now is to avoid rushing into orders at current extended prices. Exercise patience on the sidelines and wait for the price action to complete its technical retest up toward the $2000 resistance ceiling to trigger a Short position. This specific trade setup secures an absolute structural edge, allowing for an exceptionally tight stop-loss placement just above the barrier while optimizing risk-to-reward (RR) parameters to an elevated level, targeting a minimum objective back at the $1500 floor.
Disclaimer: This is not financial advice, DYOR.