Key Supply Zone: 0.1679 ~ 0.1973
Hello, traders.
Follow for more ADA analysis, trade setups, and crypto market insights.
--------------------------------------------------
📈 ADA Monthly Chart (1M) Outlook
ADA is currently trading at a critical price zone that could determine whether a long-term trend reversal is underway.
The 0.1679 ~ 0.1973 range is a major supply zone where a strong bullish rally previously began after a successful breakout.
Going forward, the most important factor is whether ADA can break above this range and flip it into support.
On the other hand, as long as price remains below 0.1679, ADA is still considered to be trading within a long-term accumulation/investment zone. This means aggressive FOMO entries should be avoided, and a more patient approach is recommended.
--------------------------------------------------
📊 ADA Trading Strategy
In conclusion, the ideal trading opportunity for ADA comes when the market confirms support within the 0.1679 ~ 0.1973 range.
A key high-volume node (Volume Profile) is located around 0.1813.
Therefore, a bullish setup becomes more valid only after ADA establishes acceptance above 0.1813 and successfully confirms it as support.
At the moment, however, a full trend reversal has not been confirmed yet.
A stronger bullish trend is more likely to develop once the monthly (1M) candle breaks above the upper M-Signal level and sustains price action above it.
Until then, short-term trading and active day-trading strategies may offer better opportunities than longer swing positions.
--------------------------------------------------
🟢 Bullish Entry Checkpoints
The HA-Low zone stretches from 0.1456 on the 1D chart up to 0.1971 on the 1W chart.
If ADA confirms support within this area, traders can consider scaling into positions through staggered entries.
A successful support flip above 0.1813 would provide an even stronger bullish entry signal.
--------------------------------------------------
🚀 Conditions for Trend Continuation
For ADA to maintain bullish momentum after breaking key resistance levels, the following conditions should be met:
① StochRSI
- Must continue trending higher without becoming excessively overbought.
② OBV (On-Balance Volume)
- Must remain above the High Line with sustained volume inflows.
③ BSSC
- Must stay above the zero line, confirming trend strength.
If these conditions are met, ADA could have a higher probability of extending its rally after breaking above 0.1973.
--------------------------------------------------
💡 Trading Perspective
The market never moves exactly according to anyone's prediction.
Blindly buying based on someone else's outlook is extremely risky.
The goal is not to predict the market, but to identify tradable zones and wait for actual confirmation from price action.
Avoid FOMO entries and focus on high-probability setups. That's how traders protect their capital over the long run.
--------------------------------------------------
🎯 Mid-to-Long-Term Investment Strategy
For investors looking to hold ADA over the medium to long term, continuously injecting new capital simply to increase position size may not be the most efficient approach.
Instead, consider using trading profits to accumulate additional ADA.
One effective strategy is to scale in based on average entry prices, then partially take profit during rallies by withdrawing the principal amount and leaving only profit-generated holdings in the market.
This allows investors to gradually increase their ADA holdings while managing risk more effectively.
--------------------------------------------------
Always wait for the chart to confirm your setup before entering and let the market signals guide your decisions.
-----
Wishing you successful trading and profitable investments. 🚀
-----------------------------------------------
Crypto market
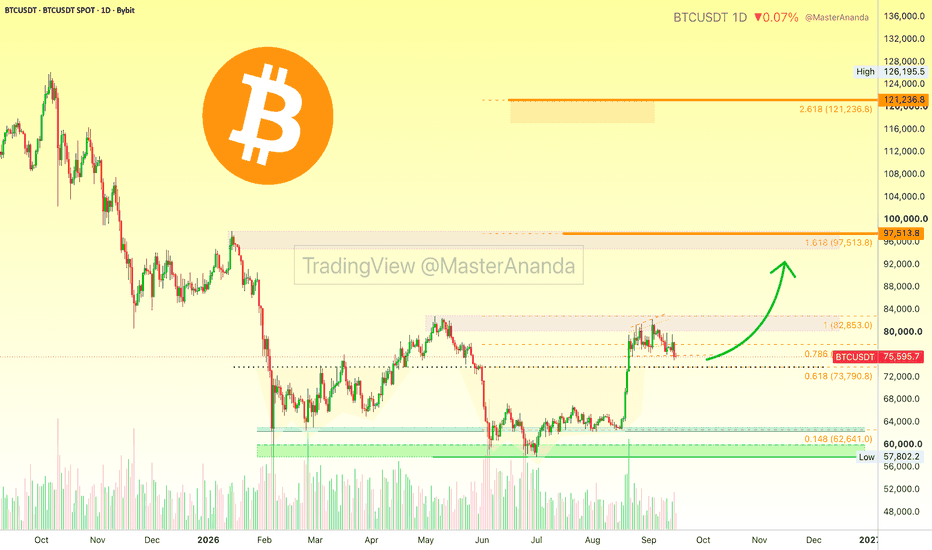
BITCOIN BTCUSDTBitcoin (BTC) is the world's first decentralized digital currency (cryptocurrency).
It is digital money that exists only online.
No banks, governments, or companies control it.
It was created in 2009 by an unknown person (or group) using the pseudonym Satoshi Nakamoto.
Key Features of Bitcoin:
Fixed Supply: Only 21 million Bitcoins will ever exist (this scarcity is one of its biggest strengths).
Decentralized: Runs on a global network of computers (blockchain) — no single point of failure.
Blockchain: A public, transparent ledger that records every transaction. It is extremely secure and nearly impossible to hack.
Mining: New bitcoins are created through a process called mining (computers solve complex mathematical problems).
Halving: Every 4 years, the reward for mining is cut in half (this reduces new supply over time).
Why Bitcoin Matters:
Store of Value — Often called “Digital Gold” because of its scarcity and independence from governments
Bitcoin is the largest cryptocurrency by market value and is widely accepted by institutions, companies, and governments.
#BITCOIN
# SOLUSDT | 1H ICT + Bill Williams | Long Setup# SOLUSDT | 1H ICT + Bill Williams | Long Setup
SOL has swept sell-side liquidity and responded with strong bullish displacement from discount. The recent recovery suggests buyers are attempting to rebalance the imbalance created during the decline, with the next objective being the overhead Fair Value Gap.
## Bias
🟢 Bullish (Retracement)
This is a tactical long following a liquidity sweep and bullish displacement. The broader trend still requires confirmation, but the current structure favors continuation into nearby supply.
---
## Area of Interest
**74.80 – 75.10**
As long as price holds this region, buyers retain short-term control.
---
## Targets
🎯 TP1: **75.80**
🎯 TP2: **76.30**
🎯 TP3: **77.10**
---
## Invalidation
A sustained move below the recent swing low would invalidate the bullish thesis and shift focus back toward continuation lower.
---
## ICT Perspective
- Sell-side liquidity has been swept.
- Bullish displacement confirms buying interest.
- Price is rebalancing toward the bearish Fair Value Gap overhead.
- The reaction at that imbalance will determine whether this develops into a larger reversal or remains a corrective rally.
---
## Bill Williams Perspective
The Alligator is beginning to wake after a bearish phase. The Lips are attempting to lead higher, suggesting momentum is improving, though confirmation requires sustained trading above the Teeth and Jaw.
---
## Market Narrative
Rather than chasing weakness after the decline, I'm following the reaction from discount. Buyers have shown commitment through displacement, and until that strength is invalidated, I favor continuation into the next area of supply.
> **"Liquidity provides the opportunity. Momentum confirms the path." — Origami Capital**
#SOL #SOLUSDT #ICT #BillWilliams #TradingView #PriceAction #SmartMoneyConcepts #CryptoTrading
TRB/USDT — Bullish Reversal Setup After Trendline BreakTRB/USDT has been carving lower highs since the April top near $24, contained inside a clear descending trendline. Price has now broken above that trendline and pulled back to retest the former resistance zone (~$13.5–15.3), which is lining up as new support — a textbook break-and-retest setup.
Key Levels
Resistance-turned-support zone: $13.5 – $15.3
Reclaimed supply zone: $17 – $18
Upside target: $24.8 (prior swing high)
Invalidation: daily close below $13.5
Bias: Bullish while price holds above the retest zone. A move back through $17–18 would open the door toward $24.8.
Risk: Not financial advice. Confirm with volume/momentum before entry and size positions according to your own risk tolerance.
What's your take — trend reversal or just a bounce within the bigger downtrend? Drop your thoughts below. 🚀
Whether 551.55 Can Be Flipped Into Support After Breakout
Hello traders,
Follow me to stay updated with the latest market insights.
Wishing everyone a profitable trading day.
────────────────────
The current price is trading near the HA-High indicator, making this a short-term resistance zone where a rejection is possible.
However, if price breaks above this area and successfully flips 551.55 into support, the next upside target is 663.91.
A sustained move and acceptance above 663.91 would significantly increase the probability of a stair-step bullish trend developing.
────────────────────
📈 Conditions Required for Trend Continuation
1. StochRSI must maintain bullish momentum.
2. OBV must remain in an uptrend.
3. BSSC must stay above the zero line.
Most importantly, volume is the key factor.
For that reason, traders should closely monitor the position of OBV.
If OBV remains between the Low Line and High Line, it suggests a balance between buying and selling pressure, indicating a consolidation phase with the potential for increased volatility.
If OBV breaks above the High Line and holds there, it signals strong buying pressure entering the market, increasing the likelihood of a bullish trend continuation.
Conversely, if OBV falls below the Low Line, selling pressure gains control and the probability of a bearish trend increases.
Combining OBV analysis with StochRSI can provide a much clearer picture of potential price direction.
Currently, StochRSI is rolling over from the overbought region and moving lower.
This suggests that the current rally may face some limitations in the near term.
To overcome this resistance and continue higher, OBV must break above the High Line and maintain that position.
Ultimately, the most important factor right now is whether price can break above 551.55 and successfully establish it as support.
If the breakout fails, traders should watch whether price can find support near 521.78, where a new HA-High zone may form.
────────────────────
📊 Short-Term Outlook (15-Minute Chart)
Based on the daily timeframe analysis, short-term trading opportunities can be identified on the 15-minute chart.
The key takeaway from the daily chart is that if 551.55 cannot be flipped into support, the market is likely to revisit the 521.78 area.
Currently, price is declining between the HA-High and DOM(60) zones.
This places the immediate resistance range at:
🔹 548.71 – 552.65
A breakout above this range could trigger the formation of a stair-step bullish trend.
On the other hand, if price is rejected around 539.44, the midpoint between HA-Low and HA-High, it is likely to retest the DOM(-60) to HA-Low support zone.
📍 Key Support Zone
🔹 523.52 – 530.17
A breakdown below this zone would increase the probability of a stair-step bearish trend continuation.
────────────────────
📉 Indicator Summary
① StochRSI
StochRSI is currently attempting to enter the oversold region.
As a result, while downside pressure remains, additional downside may become increasingly limited.
② OBV
OBV is showing signs of moving below the Low Line.
This indicates growing selling pressure and increases the likelihood of bearish price action.
③ BSSC
BSSC is currently below the zero line.
Therefore, the broader trend still favors the bears.
When combining these three indicators, the current market environment leans slightly more bearish than bullish.
As such, traders should pay close attention to whether support emerges around 539.44.
────────────────────
🔍 PC LL Perspective
The PC LL line has currently disappeared.
If a new PC LL forms during a support test around 539.44, the probability of a bullish trend reversal will increase substantially.
However, if no new PC LL is formed, the current bounce should be viewed as a relief rally within the existing downtrend rather than a genuine trend reversal.
────────────────────
🎯 Trading Plan
🟢 Long Setup
• Scale into longs between DOM(-60) and HA-Low.
• Scale out between HA-High and DOM(60).
🔴 Short Setup
• Scale into shorts between HA-High and DOM(60).
• Scale out between DOM(-60) and HA-Low.
At the moment, the two most critical levels to monitor are:
✅ Whether 539.44 holds as support
✅ Whether 551.55 can be broken and reclaimed as support
In particular, traders should closely monitor whether OBV can move above the High Line alongside increasing volume.
────────────────────
Thank you for reading.
Trade safe and good luck. 🚀
Mass Adoption Is Coming For Crypto!The crypto revolution is still in its early stages, and mass adoption is only beginning. When you compare the long-term structure of the crypto market to historic bull markets—such as the Dow Jones during its early expansion—you can see a remarkably similar pattern of higher highs, higher lows, and a steadily strengthening trend.
One of the clearest signs of a healthy bull market is increasing price accompanied by increasing volume over time. That's exactly what we're seeing as institutional adoption grows, blockchain technology matures, and more capital flows into the digital asset space. Strong uptrends aren't built overnight—they develop over years through periods of accumulation, consolidation, and expansion. In my view, crypto is following that classic blueprint.
While short-term volatility is normal, the bigger picture continues to point toward a powerful long-term uptrend. As adoption accelerates worldwide, I believe we're witnessing the early stages of one of the greatest technological and financial revolutions of our generation.
As always, stay profitable!
– Dalin Anderson
How to find the levels that create the biggest moves...This is a lesson and a breakdown of a way to view levels that I see no one else talking about. Years of looking at charts and patter recognition has helped me uncover a new way to think about levels. I promise this video will insightful and worth your time! All trade examples were real trades that I identified or took. Thank You!
ZRO LONG — 12H ALMA Setup (WR 78%)█ SETUP
BINANCE:ZROUSDT · 12H · long only.
(Context: LayerZero — cross-chain / infra beta; trades with alt liquidity and bridge-narrative flows.)
ALMA Averaging Strategy: ALMA 3 / σ2, SD band 2, min diff 6 bars to add / 3 bars to exit, 25% per bar, up to 4 adds, hard stop −10% from average entry.
Strategy Tester (ZRO 12H):
Win rate 78% · profit factor 3.4 · max drawdown 13%
Avg winning trade +21.9% · avg losing trade −9.8%
Typical hold ~19×12H bars on winners — infra / bridge mean-reversion grid · 40-trade sample
═
█ WHY NOW
Friday 12-hour cluster — two ALMA long lots on the same 78% WR template:
· 17 Jul 00:00 UTC ~ $0.813
· 17 Jul 12:00 UTC ~ $0.784 (second add · pyramid 2 of 4)
Working blend ~ $0.7985 . Bar-close scale-in into the BTC risk-off wash — not a discretionary LayerZero roadmap trade.
Hard stop zone −10% from blended average ~ $0.719 . Exits follow Pine ALMA flip + min diff or the hard stop.
═
█ MACRO
Sector: ZRO = LayerZero omnichain messaging / OFT rails — beta to bridge volume, alt liquidity, and interoperability share vs Chainlink CCIP / Wormhole / Axelar.
Fundamental (30d → 18 Jul): Partnerships still Bid — Robinhood Chain named LayerZero as native cross-chain bridge (01–02 Jul · ZRO +~10% 24h); 14 Jul LayerZero Labs joins Linux Foundation x402 as General Member (AI-agent payments). Competitive overhang: >$7.2B announced migrations LayerZero → Chainlink CCIP since May · Mantle Super Portal (~$2.5B MNT) OFT→CCT Jul 9–15. Reputation tape: Bonzo/Hedera exploit loot bridged via LayerZero (11 Jul · not a protocol bug) · Executor-wallet scare then clarified as routine ops (15 Jul). Supply: ~25.71M ZRO unlock ~20 Jul (~2.6% supply · ~$24M notional). Price path in window: ~$0.735 (28 Jun) → ~$1.01 early Jul → ~$0.78–0.81 into fills.
Tape (17 Jul): Bitcoin under ~$62.5K on Iran / US-equities pressure — alt/infra beta soft with BTC; unlock day is still ahead of the fill cluster.
Window read: mixed — Robinhood + x402 +, CCIP exodus + unlock + security headlines + macro beta −.
Execution is 12H ALMA at the ~$0.78–0.81 cluster — not a roadmap, migration, or unlock forecast.
═
█ OUTLOOK
Positive factors
- 78% WR · PF 3.4 · avg win +21.9% vs avg loss −9.8% · ~19×12H bars — solid payoff skew in a 40-trade sample
- Fresh twin adds inside the 24h window on the same Averaging template
- Fundamental — partnership stack: Robinhood Chain native-bridge narrative + x402 Foundation membership keep the long-cycle infra story alive under the wash
- ALMA — 4H / 1D stretch below: 4H Signal SHORT · S:4 vs SAvg:3.5 · OVERHEAT-S · 1D Signal SHORT · S:10 vs SAvg:4.0 · OVERHEAT-S — time stretched below the band into the add (mean-reversion fuel)
- EMA — below-session stretch: 1H Below · 1H Cur S:49 vs Avg S:6.5 · +1.4% dev · 4H Below · 4H Cur S:36 vs Avg S:13.5 · +7.7% · 3D Below · 3D Cur S:31 vs Avg S:9.8 · +42% — sell-time overheated on the execution ladder
- SMC — demand at the add: 4H FVG Raid Bull ~ $0.784 (17 Jul) — bid-side tag on the second fill print
- 1W EMA deep Below: 1W Cur S:109 · +115% stretch — slow mean still far overhead; discount context for the 12H grid
Negative factors
- Fundamental — CCIP share loss: >$7.2B migrations to Chainlink · Mantle portal exit — market-share / OFT narrative headwind into any bounce
- Supply calendar: ~25.71M ZRO unlock ~20 Jul (~2.6% supply) sits inside a typical ~19×12H hold — vesting overhang before “Zero” L1 narrative (fall 2026)
- Reputation tape: Hedera loot routed via LayerZero + mid-Jul Executor scare (later clarified) keep bridge-risk headlines sticky
- ALMA — slow grids not fully stretched: 3D Signal SHORT · S:3 vs SAvg:4.1 — young below-session on the 3D clock; bounce may not be mature there
- EMA — daily below still young vs average: 1D Below · 1D Cur S:9 vs Avg S:13.8 · +13.9% — daily sell-time not overheated yet; downside can extend before mean-reversion completes
- SMC — daily bull FVG referenced higher: 1D FVG Enter Bull ~ $0.821 — demand pocket sits above spot; reclaim needed for a clean expansion
- PA: HTF bear FVG formed + fractal low broken — two-way housekeeping, not a clean one-way reclaim
- 12H bars can gap on geo / BTC headline risk — stop slippage on BINANCE spot
- Past backtest ≠ live fills; 40-trade sample is thin vs large-cap equity templates
Takeaway: the 12H ALMA strategy and 78% WR skew support the long into a stretched 4H/1D short-phase band, and Robinhood/x402 keep a constructive partnership floor — but CCIP exodus, the ~20 Jul unlock, young 1D/3D below-sessions, and weekly bear OB near ~$0.775 cap upside — net read is a strategy-backed mean-reversion grind into a mixed fund + risk-off window, not a clean multi-TF reclaim; nominal risk stays on the −10% hard stop / Pine exit path.
Base case: 12H ALMA holds · 4H/1D OVERHEAT-S mean-reverts · drift toward the ~$0.82 daily FVG shelf if alt-beta stabilises with BTC after the unlock print.
Bear case: fail 12H ALMA · unlock / CCIP headlines extend · weekly bear OB ~$0.775 reasserts · −10% from ~$0.7985 blend toward ~$0.719 · BTC geo headline whipsaw through the spot book.
Chart: BINANCE:ZROUSDT 12H — ALMA Averaging Strategy.
Educational idea. Live position — past backtest ≠ future results. NFA.
Ethereum - Here comes the bear market bottom!✨Ethereum ( CRYPTO:ETHUSD ) is retesting incredible support:
🔎Analysis summary:
Over the past two weeks alone, Ethereum is already up a decent +20%. And with this first push higher, Ethereum is nicely starting to respect a clear higher timeframe support area. This could very well be the bottom and Ethereum is starting another +150% bullrun soon.
📝Levels to watch:
$1,500 and $4,500
Keep your #LONGTERMVISION🙏
— Phil (@TheTraderPhil)
BTCUSD: Stoch RSI indicates bottom by October around $45000.Bitcoin is heavily bearish on its 1W technical outlook (RSI = 38.421, MACD = -7131.700, ADX = 23.358) with the 1M RSI also bearish at 43.772. Based on the STOCH RSI, we have already started the bottoming process. In past Cycles since 2014, the minimum duration from the first STOCH RSI Bullish Cross under 20.00 until the Cycle bottom has been 214 days. According to the 1 year Bear Cycle Model, this aligns perfectly with an October 2026 bottom. With the 1M MA100 never broken, a bottom right over it around $45000, seems optimal at the moment.
## If you like our free content follow our profile to get more daily ideas. ##
## Comments and likes are greatly appreciated. ##
DOGEUSD: Entered the bottom process. $0.5500 can be max pain.DOGE is almost oversold on its 1W technical outlook (RSI = 33..163, MACD = -0.019, ADX = 25.177). It has completed a month of trading under the bottom band of the Mayer Multiple Bands. during the 2022 Bear Cycle, it first pierced below that level in June 2022 (same time as this Cycle) and spent 4 months ranging around it before it formed the macro bottom. Worst case scenario is for Dogecoin to reach 0.0550. Besides that, we are close to the ultimate starting levels to buy for the long term in preparation of the next Bull Cycle.
## If you like our free content follow our profile to get more daily ideas. ##
## Comments and likes are greatly appreciated. ##
95% of traders buy the Worst Possible Time - Dont be one of ThemHave you ever bought Bitcoin, watched it rise for a few days… and then suddenly crash?
You're not alone, brother. We've all been through this.
Most beginners enter the market at exactly the moment when experienced investors are taking profits. Why? Because they don't understand one simple thing: every liquid market moves in cycles.
Once you learn to recognize these cycles, you'll stop chasing the crowd and start understanding where the real opportunities are.
Every market follows the same cycle:
🟦 1. Accumulation
After a long decline, fear is everywhere. The news is negative, most people have given up, and almost nobody wants to buy.
This is exactly where long-term investors quietly begin accumulating positions.
📈 2. Markup (Uptrend)
Demand starts to exceed supply.
The price begins making higher highs and higher lows. Confidence slowly returns, but the majority still doesn't believe the rally.
🚀 3. Euphoria
This is where FOMO takes over.
Everyone is talking about Bitcoin. Social media is full of screenshots showing huge profits. Friends who never cared about crypto suddenly want to buy.
This is where most beginners enter the market.
Ironically, it's often one of the riskiest places to buy.
⚖️ 4. Distribution
The price is still near its highs, but smart money is already selling.
Large investors gradually unload their positions while the public continues buying, convinced that "this time it's different."
📉 5. Markdown (Decline)
Buyers disappear. Fear replaces greed, prices fall, panic selling begins, and many investors sell near the bottom... right before a new accumulation phase starts.
Bitcoin BITGET:BTCUSDT is a perfect example
Think back to the 2023-2025 Bitcoin bull market.
Accumulation: Throughout Jun 2022– Mar 2023, while interest in Bitcoin was relatively low, long-term investors were steadily buying.
Market UP: From late Mar 2023 - Aug 2024, Bitcoin entered a strong uptrend and attracted increasing attention.
Euphoria: Around Sep 2024 - Jun 2025, when Bitcoin reached nearly $69,000, mainstream media, celebrities, and first-time investors rushed into the market.
Distribution: Jul 2025 - Nov 2025, Large holders gradually sold into that wave of optimism while prices remained near the highs.
Markdown: Since Oct 2025 - from NOW, Bitcoin fell by more than 50%, shaking out many late buyers.
New Accumulation: i think during Jul 2026– Oct 2026, while interest faded and fear dominated, the next accumulation phase quietly began—setting the stage for the following bull market.
The main lesson:
Price doesn't move randomly. Human emotions don't change.
Greed creates tops.
Fear creates bottoms.
The traders who understand market cycles don't ask:
"Should I buy?"
They ask:
"Which stage of the cycle are we in right now?"
That single question can completely change your life and the way you invest.
On my channel you will find many educational posts about investments With which you can improve your results from trading and investing.
Stay out of the crowd!
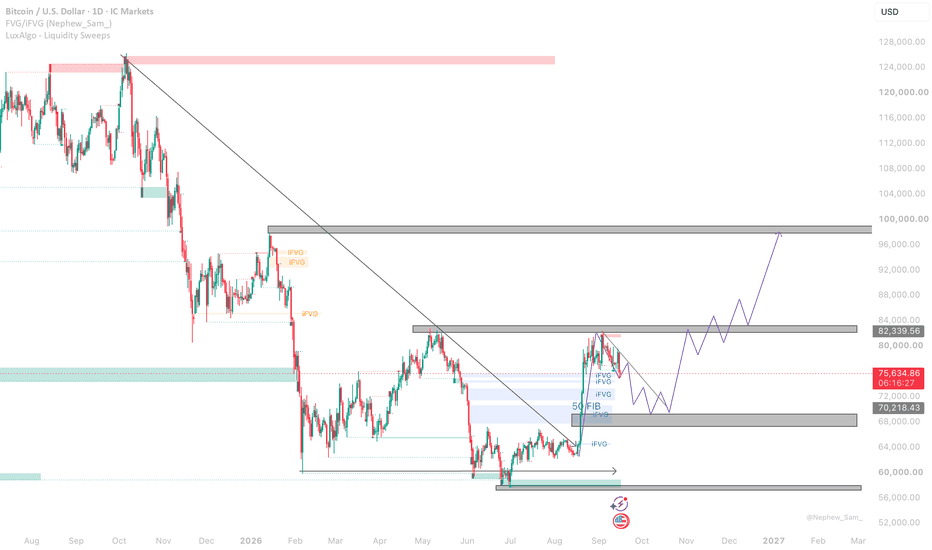
BTC/USD Bearish Rejection at Channel Resistance | 64.2K Supply ZBTC/USD 15-Minute Technical Analysis (Educational)
Market Bias: Bearish 📉
The chart shows BTC/USD trading inside an ascending channel after a strong recovery from the breakout area. Price is now testing the upper boundary where sellers have previously stepped in. The rejection from this resistance suggests weakening bullish momentum and increases the probability of a downside correction.
Key Technical Observations
Ascending Channel: Price has respected the rising channel throughout the recovery.
Breakout & Retest: The breakout zone around 62,500-62,700 acted as the launch point for the rally.
Resistance Zone: 64,230-64,400 is a strong supply area where multiple rejections are visible.
Support Turned Resistance: The marked support near 64,231 is now critical. A sustained break below it would strengthen the bearish case.
Momentum: Higher highs are becoming less aggressive, indicating buyer exhaustion near channel resistance.
Trade Setup (Short Idea)
Entry: Around 64,200-64,300 after bearish confirmation.
Stop Loss: 64,990 (above recent swing high and channel resistance).
Target 1: 63,500
Target 2: 62,800
Target 3: 62,016 (major support and measured move target shown on the chart).
Invalidation
If BTC closes strongly above 64,990, the bearish setup becomes invalid, opening the door for continuation toward higher resistance levels.
Conclusion
As long as price remains below 64,400-64,990, the short-term outlook favors a pullback toward 63,500 and potentially 62,016. Wait for bearish candlestick confirmation before entering rather than selling into support.
MANTAUSDT: Exhaustion Rally? Short Setup at Key ResistanceMANTAUSDT has rallied aggressively into a major resistance zone after a strong bullish run. Momentum is slowing, making this an interesting area to watch for a potential pullback.
A rejection from the current level could send the price toward 0.06247, while a break above 0.06504 would invalidate the bearish setup.
Trade Setup
Entry: 0.06444
Target: 0.06247
Stop Loss: 0.06504
I'll wait for bearish confirmation and increasing selling volume before expecting continuation.
BTC/USD H1 Analysis, Smart Money Concept (SMC)Bearish Pullback .BTC/USD is currently trading inside a premium price zone, where institutional selling pressure is more likely. After creating a Higher High (HH) near 65,500, the market failed to continue upward, indicating that buyers are losing momentum.
The chart shows a clear Bearish Order Block between 64,700–65,000, which is expected to act as a strong resistance area. Just below this zone lies a Fair Value Gap (FVG) around 64,300–64,400. Price is expected to retrace into this imbalance before continuing its bearish move.
The market structure has shifted from bullish to bearish after a Break of Structure (BOS) and Change of Character (ChoCH), confirming that sellers are currently in control. The recent bullish candles appear to be a retracement rather than the start of a new uptrend.
Trade Setup
Entry Zone:
64,300 – 64,400 (FVG Retest)
Stop Loss (SL):
64,880
Take Profit Targets:
TP1: 63,796
TP2: 63,141
TP3: 62,395
Key Technical Points
✅ Higher High formed near 65,500.
✅ Price entered the Premium Supply Zone.
✅ Bearish Order Block acting as resistance.
✅ Fair Value Gap provides a high-probability sell entry.
✅ BOS and ChoCH confirm bearish market structure.
✅ Selling from the FVG offers a favorable risk-to-reward setup.
Trading Outlook
As long as price remains below the Bearish Order Block and 64,880, the overall bias remains bearish. A retracement into the FVG can provide a high-probability selling opportunity, with downside targets at 63,796, 63,141, and 62,395. A confirmed breakout above 64,880 would invalidate this bearish setup and suggest a potential continuation toward the premium supply zone.
BTC/USD Short Setup: Momentum Turning Bearish📉 BTC/USD 1H Trading Perspective — Bearish Momentum
BTC/USD is currently trading around the $64,000 area after failing to sustain its recent push toward the $65.5K weak high. The chart shows that price rallied strongly, but sellers stepped in around the upper supply region and have since pushed the market lower. The current rebound into the $64K area looks like a potential retest of resistance rather than a confirmed bullish reversal.
The key idea is that Bitcoin is forming a bearish structure after rejecting from the premium/high-price area. Unless buyers reclaim the marked resistance zone with strength, the probability remains tilted toward another move lower. ⚠️
Key resistance / supply zones
$64,400–$64,950: Main resistance and supply area. This is where sellers previously became active; a rejection here could provide bearish confirmation.
$65,300–$65,550: Higher resistance and the chart’s weak-high zone. A clean break and sustained hourly close above this area would weaken the bearish setup significantly.
Support and downside target zones
$62,450–$62,650: First major downside target. This is the highlighted target zone and an important reaction area where price could pause, consolidate, or produce a short-term bounce. 🎯
$61,600–$62,050: Stronger lower support/demand zone. If the first target fails to hold, this becomes the next important area for buyers to defend. The volume profile and previous price action make it a key decision zone.
Potential trade plan
A conservative bearish approach would be to wait for price to retrace into the $64.4K–$64.9K resistance zone and look for clear rejection signals on lower timeframes—such as a bearish engulfing candle, lower high, loss of intraday support, or a market-structure shift downward.
Possible bearish objectives:
TP1: $63,600 area
TP2: $62,500 target zone
TP3: $62,000–$61,600 demand zone
If price does not retrace and instead breaks below nearby intraday support with strong volume, a continuation short may be considered—but chasing a large red candle is generally lower quality than waiting for a retest. Patience is part of the setup. 🧠
Invalidation
The bearish idea becomes less convincing if BTC reclaims and holds above $64,950, especially if price starts accepting above the resistance area. A decisive break above $65,300–$65,550 would suggest that the market may be targeting liquidity above the previous high rather than continuing downward.
Risk management
Keep risk controlled on every position:
Risk only a small, predefined percentage of capital per trade—commonly 0.5%–1%.
Place the stop-loss above the relevant resistance/swing high, not at an arbitrary distance.
Consider moving stops to breakeven after TP1 if the market confirms the move.
Take partial profits into support rather than assuming price will reach every target.
Avoid overleveraging: BTC can move sharply around news, liquidity sweeps, and major session opens. 🛡️
Overall, the chart favors a bearish continuation scenario while price remains below the marked supply zone. The preferred expectation is a rejection from resistance followed by a move toward $62.5K, with the $62K–$61.6K range acting as the deeper support area. This is a technical perspective, not financial advice—always wait for confirmation and manage risk carefully.
Weekend Head & Shoulders. Neckline broken. Retest. Short ETH.📊 Trade Plan:
🔻 Entry: 1844
🛑 Stop Loss: 1894
🎯 Take Profit 1: 1802
🎯 Take Profit 2: 1751
📉 Technical Picture (H1):
Head & Shoulders: Textbook pattern. Neckline broken, price pulled back to retest it from below — classic confirmation.
Friday close: Pattern triggered heading into the weekend. Low liquidity could accelerate the move.
🗞️ Fundamental Note:
Why ETH has been outperforming lately:
Robinhood Chain (L2) launched July 1 — ETH bridged surged 10x in a week to $164M. Token launchpads, memecoin activity — echoes Solana's 2024 run.
ETF inflows returning: +$96M in 3 days. Last week broke an 8-week outflow streak with +$84.4M. Only 2 outflow days in July.
BitMine accumulated ~70,000 ETH in 2 weeks. Meanwhile, Strategy sold $216M BTC — institutional flows diverging.
Clarity Act sentiment boosting Ethereum as the dominant L1: $40.9B TVL, $14.8B tokenized assets.
But: Bitfinex warns inflows are still too small vs $220B market cap. Onchain activity is the real catalyst. Broader market fragile — geopolitics and Oil surge keep risk assets under pressure.
❌ Invalidation:
A daily close above the right shoulder voids the pattern.
BTC Ready for a Big Drop? Bears Gaining MomentumBitcoin is facing increasing selling pressure as bullish momentum starts to fade. ⚠️
🔹 Resistance continues to hold strong
🔹 Lower highs suggest weakening demand
🔹 Momentum indicators are turning bearish
🔹 A breakdown could trigger a sharp correction
Will BTC lose support and move lower, or can bulls regain control? 👀
ETH Ready for a Major Drop? Bears Taking ControlEthereum is showing signs of weakness as selling pressure starts to build. ⚠️
🔹 Resistance continues to reject price
🔹 Momentum is shifting bearish
🔹 Lower highs are forming on the chart
🔹 A breakdown could trigger a sharp move lower
Is ETH preparing for a deeper correction, or will bulls defend support? 👀
HBAR: Bears Tighten Their GripKey Support Gives Way
HBAR has now broken below both the $0.072 support and the 0.786 Fibonacci level at $0.0676. Losing these levels reinforces the existing bearish structure and shifts attention towards the next major support lower down.
Long-Term Trend Remains Bearish
The 21/8-week EMAs remain bearishly crossed, with both moving averages continuing to slope lower. Until price can reclaim these averages, rallies are likely to be viewed as relief bounces within the broader downtrend.
Momentum Favours the Bears
RSI remains below the 50 level, highlighting that bearish momentum is still dominant. Meanwhile, the StochRSI is approaching oversold territory, suggesting downside momentum is becoming stretched but not yet reversing.
$0.13 Remains the Key Level
The former support/resistance zone around $0.13 continues to be the most important area for bulls to reclaim. Multiple reactions have occurred there previously, making it the first meaningful level that could begin to shift sentiment.
In Summary
HBAR continues to weaken after breaking beneath another important support level, with the bearishly crossed weekly EMAs and momentum indicators still favouring the downside. While the market is becoming increasingly oversold, the technical picture is unlikely to improve until bulls can reclaim the major $0.13 support/resistance zone.
SUI 4H – Rising Channel Holding at Horizontal PivotSUI on the 4H timeframe is currently trading around 0.7385 after pulling back from the upper channel boundary near 0.7750–0.7800 and finding support at the rising lower trendline near 0.7100–0.7200, with price now back at the 0.7380–0.7400 horizontal pivot that has defined the midline of the structure throughout the channel.
The chart shows a rising parallel channel originating from the late June low near 0.6510, with the lower trendline connecting the June 25 bottom through the July 8 low near 0.6990 and the July 14 low near 0.7100, while the upper trendline has capped the July 4 high near 0.7750–0.7800 and the July 15 high near 0.7650–0.7700. Price has made two full oscillations inside the channel, pushing from the lower boundary to the upper boundary and back twice. The horizontal level near 0.7380–0.7400 has acted as the central pivot throughout, with price repeatedly crossing through it in both directions. The most recent pullback from the upper boundary brought price back to the lower trendline near 0.7100 on July 14 before bouncing, and the current candle is now back at the 0.7380–0.7400 pivot with the upper boundary near 0.7650–0.7700 as the next target if the level holds.
The rising lower trendline has now been tested three times without a breakdown, each time producing a recovery back toward the upper boundary, keeping the bullish channel structure fully intact.
Key Levels To Watch
→ 0.7750–0.7800 – Upper channel boundary, major resistance (dynamic)
→ 0.7650–0.7700 – Prior upper boundary touch, resistance
→ 0.7500–0.7550 – Mid-upper channel zone, resistance
→ 0.7380–0.7400 – Horizontal pivot, current price zone
→ 0.7200–0.7250 – Mid-lower channel zone, support
→ 0.7100–0.7150 – Rising lower trendline, dynamic support (climbing)
→ Below 0.6990 – Channel breakdown, bullish structure invalidated
A hold above the 0.7380–0.7400 horizontal pivot and a push toward the upper channel boundary near 0.7650–0.7700 would continue the established pattern of channel oscillations and keep the bullish structure intact, with 0.7750–0.7800 as the full upper boundary target.
A loss of the 0.7380–0.7400 pivot and a return toward the rising lower trendline near 0.7100–0.7150 would be the fourth trendline test, and a confirmed close below it would break the channel structure that has held since late June, opening downside toward 0.6990 and below.
Third trendline hold produced bounce back to horizontal pivot, channel pattern consistent. Hold
0.7380–0.7400 → upper boundary near 0.7650–0.7800 back in play. Lose pivot and trendline near 0.7100 → channel structure broken, downside toward 0.6990. Bias bullish inside rising channel. Shift only on confirmed close below rising lower trendline.