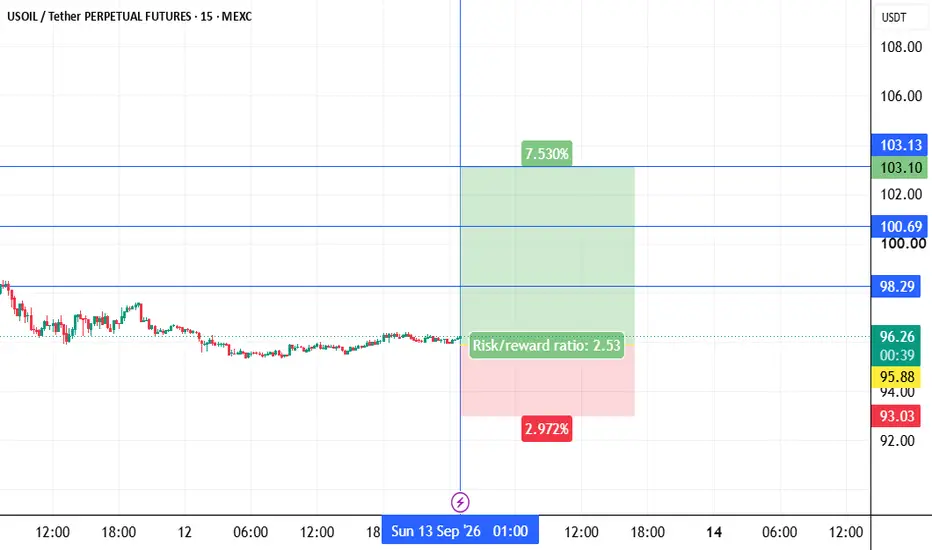
usoil longInstructions:
Entry point: yellow
Stop loss: red
Take profit: green
👉Leverage x 5-10-20 for crypto
👉Leverage x 20-50-100 for commodities, stocks, indices, and forex
👉Margin 1-5% max.
Always practice risk and money management.
Invest a maximum of 5% on any trade or across all your trades.
Invest only what you can afford to lose, as no one is in control of the market.
👉Our analyses are primarily based on:
breakouts: two trend lines (ascending and descending) and a line indicating a horizontal breakout.
chart patterns: shoulders and head, triangle parttern, elliott impulse, etc etc.
We don't always have the time to track them at all times or to represent them visibly, given the numerous signals, the number of channels to manage, and especially because of the often rapid pace of market movements.
indicators: We associate at least two indicators with this technique.
👉Depending on the circumstances, we use specific indicators, often setting 3 or more take profit levels.
👉Indeed, there are good days in trading and also bad days. No one can promise to win every trade, and like all traders worldwide, we also experience stop-loss orders. However, we win more than we lose and remain positive.
👉You can close the position before or after the take profit orders indicated by the green lines if you are personally satisfied; the same applies to stop loss orders.
👉We must stay positive, clear-headed, and humble.
we cannot provide all instructions or all trades here on this channel.
Good luck to us all, and may God guide us. Amen.  Long
Long
 Long
Long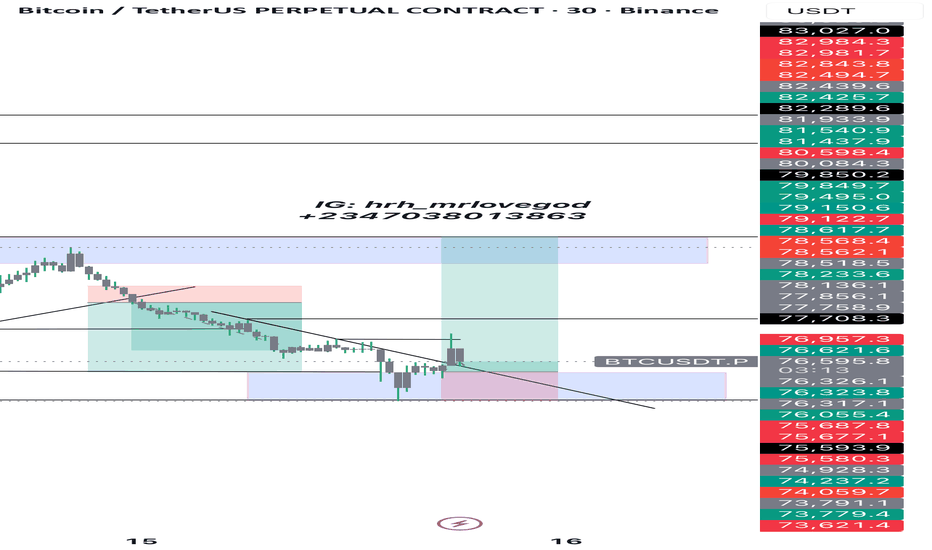
Short
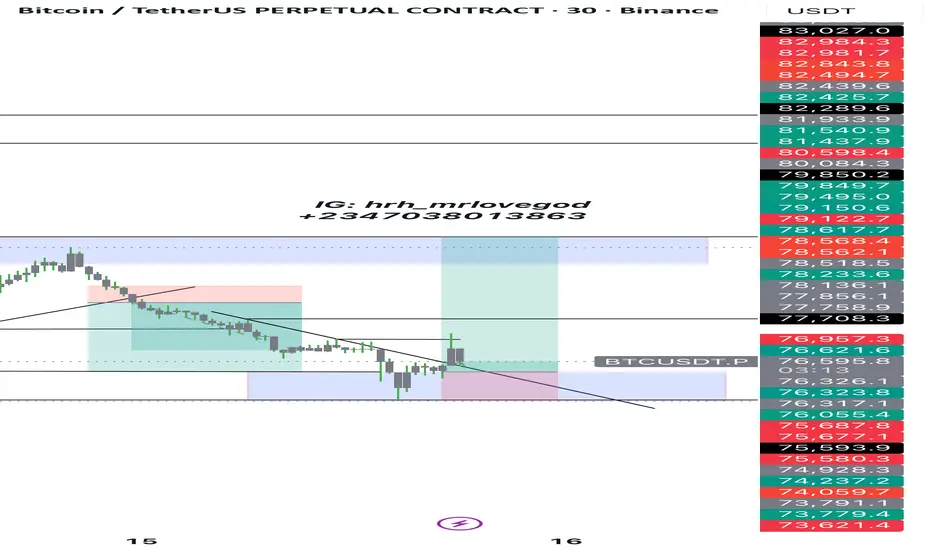
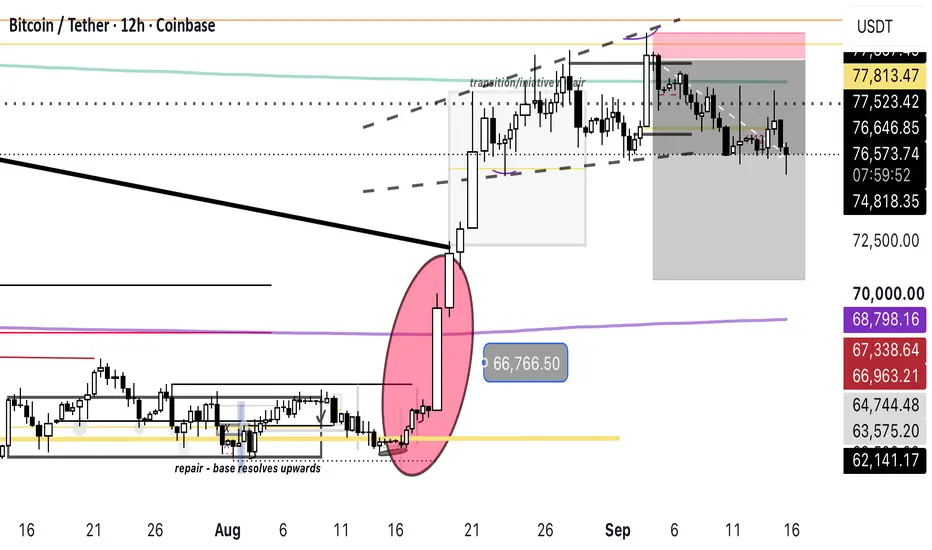
BTC 4H — cautiously bearishBTC remains under pressure on the 4H timeframe after rejecting the 78.8K–79.0K area. Price is trading near 76.9K and has not yet reclaimed the short-term moving averages. The local structure still looks weak, with BTC moving back toward the lower part of the range.
The key support is around 75,590. As long as BTC continues to close 4H candles above this level, the market still has room for a rebound. However, a confirmed 4H close below 75,590 would increase the risk of a deeper correction.
RSI remains in a weak zone, while the MACD histogram is still below zero. This confirms that bullish momentum has not fully returned on the 4H chart.
Upside resistance sits around 78,000–79,000. A 4H close back above this area would weaken the bearish scenario. Stronger bullish confirmation would require BTC to reclaim and hold above 81,900.
Conclusion: BTC 4H remains neutral-to-bearish. The risk remains tilted toward a retest of 75,590, but the scenario depends on confirmed 4H candle closes, not just intraday wicks.
⚠️ Not financial advice. Short 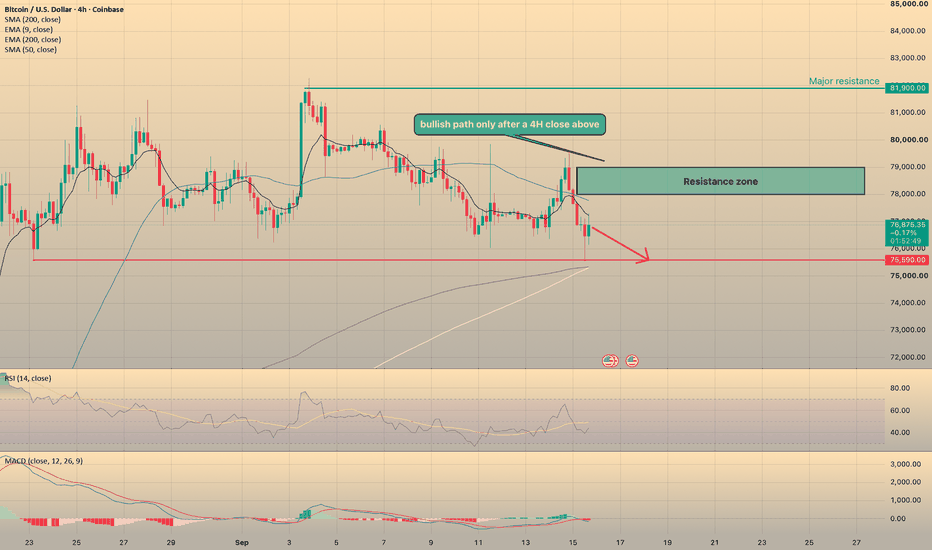
Short 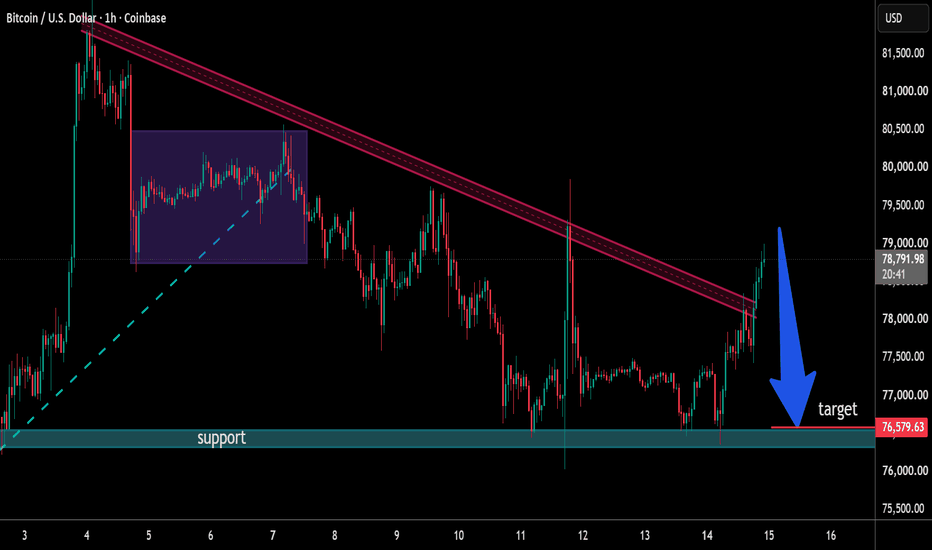
AVAX - Weekly Accumulation Outlook AVAX is in a clear long-term falling wedge. This structure has been building since the 2021 bull market, where price created a low around $10 in summer 2021 and rallied toward $150 by November 2021. Since then, AVAX has seen some decent rallies from the lows, but the structure currently forming could signal a move closer in scale to 2021 than anything price has seen recently.
The Structure
I have outlined the falling wedge with solid black trendlines. Every test of the upper boundary has been taken over by sellers (red arrows), except for the December 2024 peak, which I have labeled as a false break, since price then reclaimed the upper boundary as resistance with the January 2025 rejection. I have also outlined tests of the lower boundary as support with green arrows.
The Weekly RSI Bottom
What I find equally fascinating is the weekly RSI. Looking back at the last cycle, it is important to understand how momentum aligned with price to form that cycle's bottom.
AVAX formed its most oversold weekly RSI reading in June 2022, right after the Terra Luna collapse, printing a low of 29.47. This was the lowest the RSI would reach that cycle, but price still had slightly lower to go before AVAX formed its true cycle bottom. In November 2022, the infamous FTX collapse occurred, and at the same time, this event was helping to form the actual bottom for the broader crypto markets. I outlined this theory in a past idea you can find here:
What this did for AVAX's chart was help form its structural bottom. The RSI printed a higher low during the FTX collapse at 31.07, while price simultaneously printed a lower low right at the lower boundary of the falling wedge. This created a bullish divergence on the weekly chart, meaning that even though price was making a new low, the underlying selling pressure behind that low was actually weaker than the prior one. That kind of disagreement between price and momentum is one of the more reliable early signals that a downtrend is losing steam, and in this case it marked the exact starting point for AVAX's 650% rally that followed.
The Setup Forming Now
Something similar is forming in the charts today. Price has once again started holding the lows of the weekly falling wedge (green arrows), and the RSI is beginning to show a very similar reading to last cycle.
The RSI created its bottom once again right at oversold territory, printing a weekly reading of 29.34. Since then, both the RSI and price have continued climbing.
Now one of two things is likely to happen. Either momentum continues gaining strength and breaks above the solid black trendline, kicking off the bull market directly, or price creates another low or lower low at the trendline while the RSI forms yet another higher low, producing the same type of bullish divergence that kicked off the bull market last cycle.
The Targets
Either way, once AVAX is able to break out of its current range, it should push back toward the top of the wedge around $20 by January 2027. From there, it will come down to whether it has the strength to break above the upper boundary of the wedge entirely. That is when the kind of explosive gains witnessed in 2021 could occur once again.  Long
Long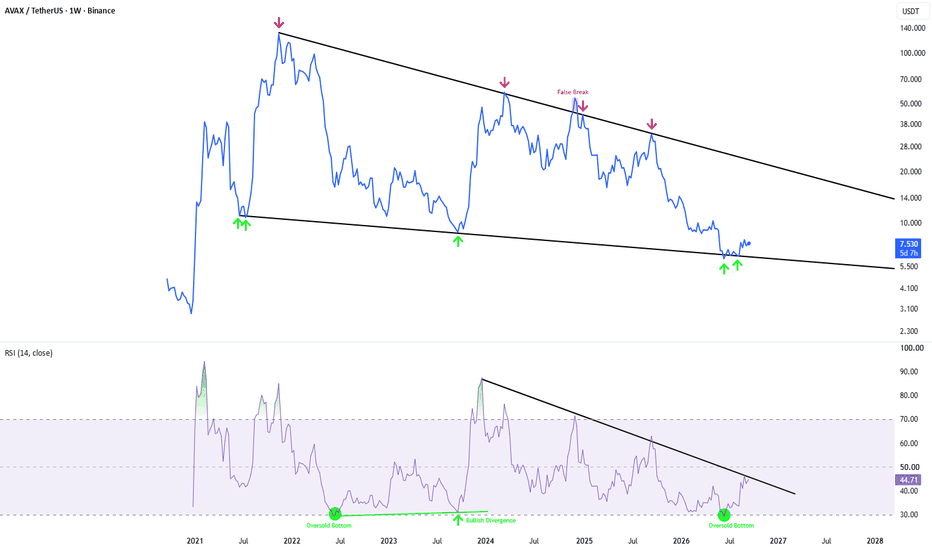
Short 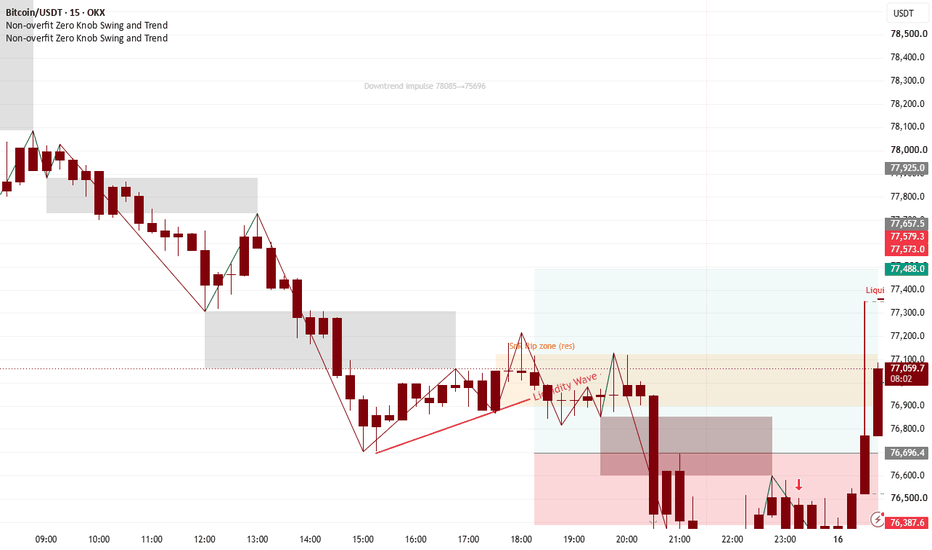
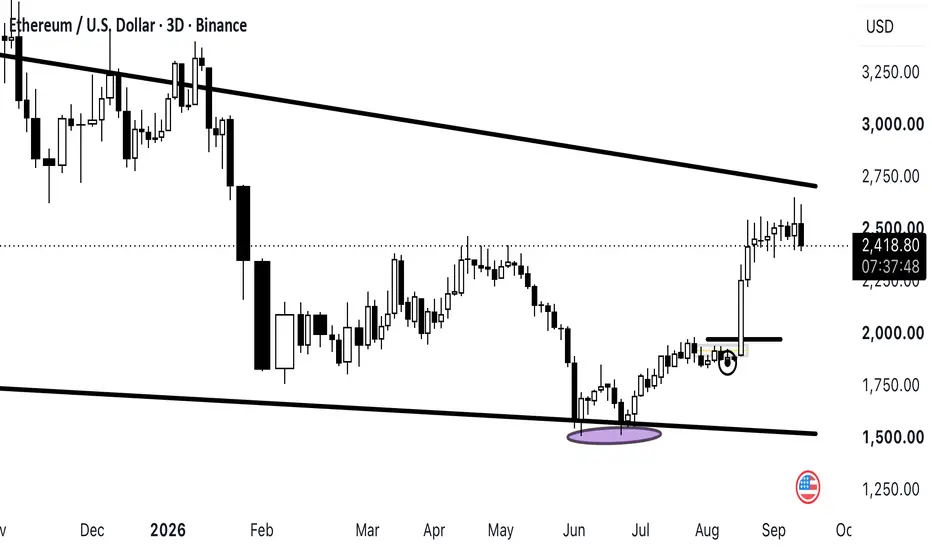
ETH- Macro Gravity shiftingEthereum has returned to the lower edge of its multi-year orbit, swept the same deep structural gravity well that arrested the previous cycle, and once again failed to remain there; the ~$1,500 deviation was not accepted, the subsequent reclaim established separation from the lows, and the developing higher low near ~$1,900 now leaves price migrating upward through an old field of memory rather than expanding into fresh downside. The descending macro boundary overhead remains the final gravitational constraint, but the geometry beneath price has changed: liquidity below was reached, absorbed and rejected while the upper boundary remains unresolved. Until the lower structure is surrendered, the larger trajectory remains macro bullish — not because ETH must rise, but because the market has already visited the darkness below and, for now, refused to live there  Long
Long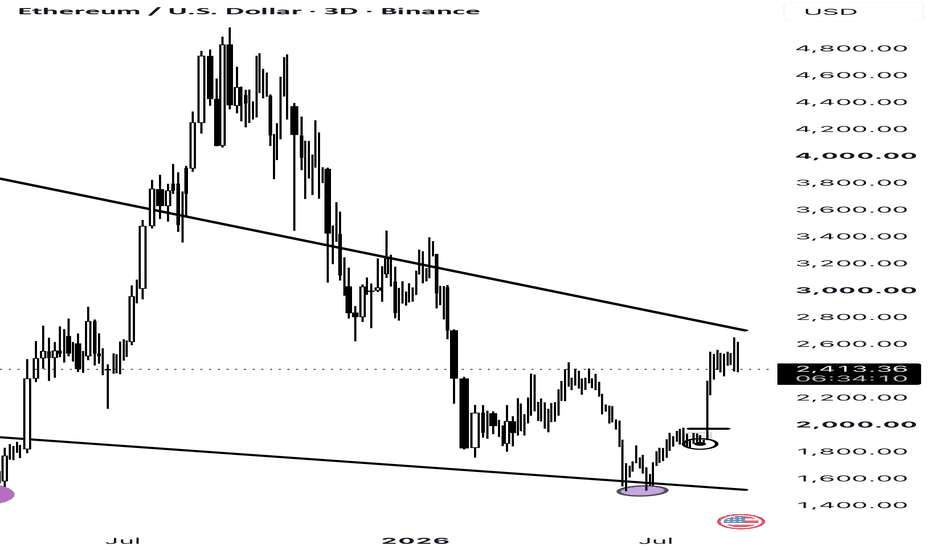
ETHEREUM ANALYSIS — WATCHING THE BOTTOM OF THE RANGEETHEREUM ANALYSIS — WATCHING THE BOTTOM OF THE RANGE
Let’s take a look at the #Ethereum chart.
As you can see, #ETH has been trading inside a large range between $2,566 and around $2,350 for almost 23 days.
Looking at the top of this range, we can see that price has formed a double top . Today, September 15, price broke below the double-top structure and is now trading around $2,420, moving closer to the bottom of the range.
Based on this range structure, we can expect price to continue moving lower toward the bottom area of the range, around $2,350. However, price could also move slightly lower, toward $2,300, before finding a reaction. So, I’m not looking at one exact number here — I’m watching the $2,350–$2,300 area as the bottom zone of the range.
Once price reaches this area, I’ll be watching closely for a reaction. I don’t want to enter blindly just because price reaches the bottom of the range.
Instead, I’ll wait for confirmation from the price action and candlesticksto see whether buyers are stepping in and whether the price is showing signs of moving back toward the top of the range.
So for now, $2,350–$2,300 is the key area I’m watching. Once price reaches this zone, I’ll look for confirmation. If I see a setup that gives me the confirmation I’m looking for, I’ll update you in the next analysis and share what I’m seeing.
Long 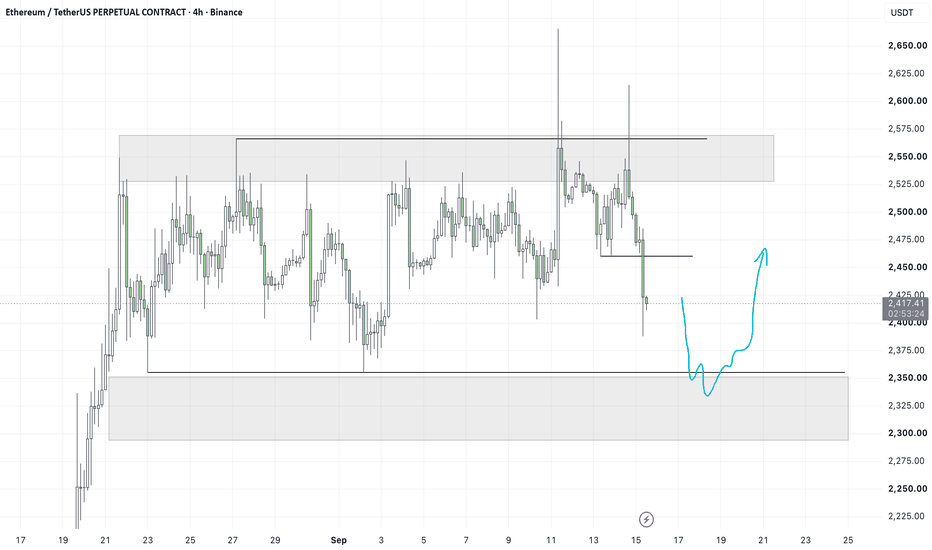
Long 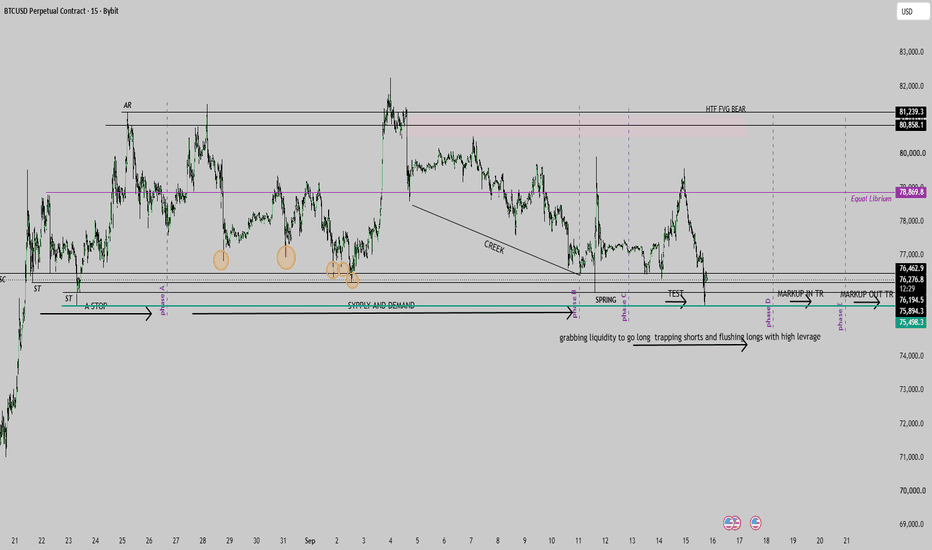
SUI - Poised for +150% Move by EOYRight now, SUI is developing the proper market structure that could lead price on a 150% move by the end of this year.
How the Bottom Is Forming
First, let's understand why a bottom appears to be forming around these prices. Review these two past SUI posts to understand the bottoming signals price is currently showing:
SUI vs BTC
Now let's look at SUI against BTC to determine whether it has the relative strength needed to start gaining value against Bitcoin. The answer is embedded on the 2-week chart, which I have outlined here:
I have a dotted black trendline outlined as the primary support trendline for the ratio. In addition to that, the ratio has double bottomed around 0.000009, with the first low coming in July 2024 and the most recent low holding that same level for the past month and a half.
At the same time, a gravestone doji has formed. Normally this candle signals bearish exhaustion after an uptrend, but since it is forming at the bottom of a downtrend rather than the top of a rally, it takes on a very different meaning here. A gravestone doji at support after a prolonged decline often reflects sellers pushing price down only to be met with strong enough buying pressure to close the candle back near its open, essentially a failed attempt by sellers to push the low any further. When this pattern appears at the base of a long downtrend rather than at a peak, it can actually function as an early reversal signal rather than a continuation one.
The Falling Wedge
Now let's look at the current chart. I have the weekly line chart outlined, which only accounts for candle body closes, alongside the weekly RSI. Both appear to be forming falling wedges (solid black trendlines), which carry a high likelihood of breaking out.
Once price is able to close weekly candles above the upper boundary of the falling wedge, that should mark the start of the breakout. Once that breakout occurs, I can project both where price is likely to reach and roughly when it will get there. To help with this, I have a dotted black trendline outlined, along with the 0.236 level of the current Fibonacci trend.
The Target and Timing
What is interesting is these levels converge around late November to early December 2026. This means that upon breaking out, SUI is likely to reach the 0.236 level near the end of Q4 this year! That should put price somewhere between $1.75 and $2, representing over a +150% move from current prices.
Would love to hear everyone's thoughts. Do you think this is reasonable, or does SUI still have lower to go first?  Long
Long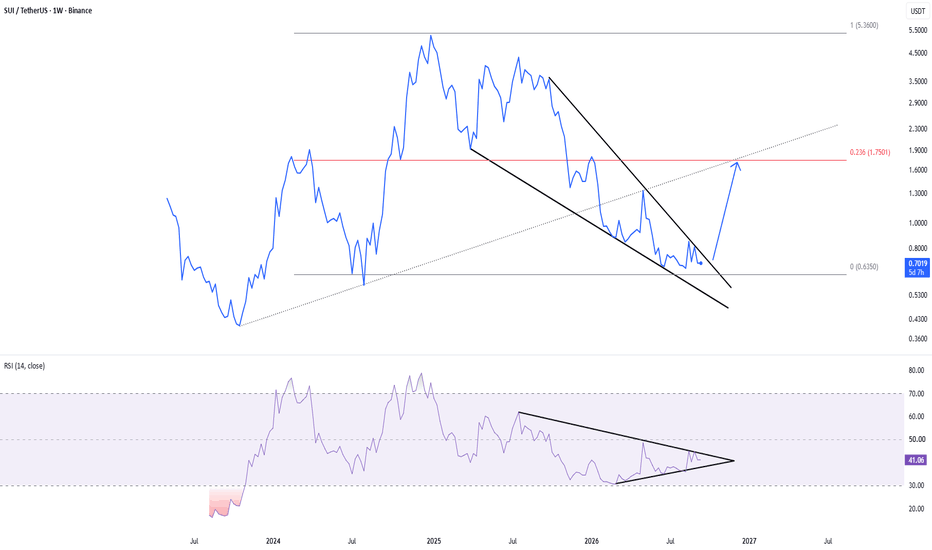
 Short
Short
 Long
Long
BTCUSD — Support Reaction & Potential Move Toward 77,400 FVG BTC is currently reacting from a key support zone around 75,750–76,000 after a strong bearish move. Price has shown a short-term rejection from this area, suggesting a possible recovery toward the 76,400–76,550
resistance zone.
If buyers regain momentum and structure holds, the next upside objective is the 77,250–77,400 FVG.
A sustained break above this zone could strengthen the bullish recovery scenario.
However, a clear break below the support zone would invalidate the recovery setup and could signal further downside.
This is a technical market analysis based on price structure, support/resistance, and FVGs—not financial advice. Short 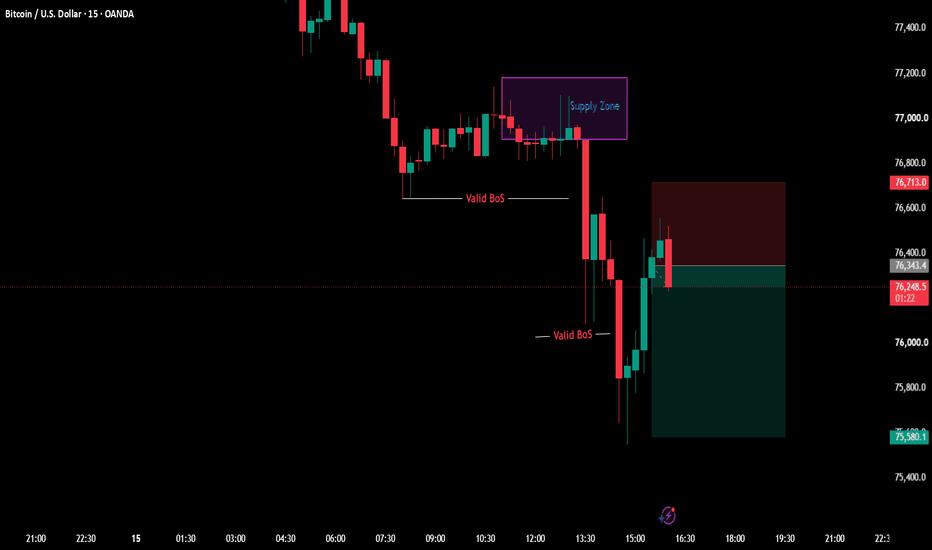
 Short
Short
Bitcoin — $76K Decision: Recovery or Breakdown?₿ Bitcoin has been trading inside a broad range after the previous recovery, but the latest rejection from the upper part of the structure has pushed price back toward a major demand zone.
Price is now testing the lower edge of the range around the $75,500–$76,500 area. This is a critical decision point: holding it could trigger another recovery, while a clean breakdown would expose the deeper kink zones below.
🏆 Previously:
📈 Bullish scenario
The current zone around $75,500–$76,500 is the main area buyers need to defend. Price has repeatedly reacted around this region, making it an important base for another potential recovery.
If BTC holds this zone and starts reclaiming the nearby range, the first major target would be the upper resistance around $82,000–$82,800. A clean breakout above that zone could open the door for another bullish expansion.
Demand hold → range reclaim → $82K+ breakout watch.
📉 Bearish scenario
The immediate risk is a confirmed breakdown below $75,500, which would weaken the current range structure and suggest that sellers are taking control.
If the breakdown continues, the first major area below is the $71,100–$72,000 kink. Losing that zone could expose the next kink around $69,000–$69,700, creating room for a much deeper bearish move.
$75.5K breakdown → $72K kink → $69K test.
🎯 Outlook
Bitcoin is sitting directly on a major decision zone after being rejected from the upper part of the range. The $75,500–$76,500 area is now the key defense for the bulls.
Holding this zone keeps the recovery scenario alive and puts $82,000–$82,800 back in focus. But if BTC loses the zone decisively, the $71,100–$72,000 kink becomes the next major area to watch.
Hold $75.5K–$76.5K → bullish recovery remains possible.
Reclaim the range → $82K–$82.8K becomes the next target.
Break below $75.5K → deeper downside opens up.
Zone test → reaction → $82K breakout or $72K breakdown. BCHUSDT Long: Bulls Ready to Strike?Yello Paradisers! is #BCH preparing for its next bullish impulse from this key retracement zone?
💎#BCH has started showing several signs that the bearish pressure may be weakening. Price first formed a hidden bullish divergence near the bottom and then shifted from printing lower lows into a higher-high structure. This change was followed by a strong bullish impulse, suggesting that momentum may be starting to shift in favor of buyers.
💎What makes the current structure even more interesting is the weakness of the corrective moves. After the first bullish impulse, #BCH moved lower only through a relatively weak correction, indicating limited selling pressure. The following bullish impulse was again strong, while the next correction once more failed to show meaningful bearish strength.
💎This type of price action often signals that sellers are gradually losing control while buyers are becoming more aggressive.
💎At the moment, BCHUSDT appears to be forming an ABC correction of the latest bullish impulse. More importantly, price has now reached the 0.618–0.786 Fibonacci retracement zone, an area where a new bullish impulse could potentially begin if buyers step back into the market.
💎For that reason, the current zone represents an attractive area to monitor for a potential long setup. However, entering blindly would be a mistake. We still want to see clear bullish confirmation from this zone before considering the setup validated.
The structure is becoming increasingly favorable for buyers, but patience remains essential. A strong trader does not chase the market; the priority is always to wait for confirmation and take only the highest-probability opportunities.
Strive for consistency Paradisers, not quick profits. Treat the market as a businessman, not as a gambler.
MyCryptoParadise
iFeel the success🌴
 Short
Short