Long
Long
FET Key Resistance Approaching — Breakout or Rejection?📊 Technical Analysis — Fetch.ai (FET/USDT)
⏳ Time Frame: 4D
📍 Current Price: around $0.1814
---
📉 Pattern: Descending Trendline
🔻 The chart shows a long-term Descending Trendline formed from the peak area around $2.1950, connecting a series of lower highs through the current period.
📌 As long as price continues to move below the descending trendline, the long-term structure remains under bearish pressure.
📉 However, price is currently approaching an important area around the Descending Trendline, making the potential for a breakout or rejection increasingly relevant to watch.
---
🟢 Bullish Scenario — Descending Trendline Breakout
🚀 The main bullish confirmation would occur if FET manages to break above the Descending Trendline and secure a convincing 4D candle close above it.
📈 Such a breakout could indicate that long-term bearish pressure is weakening and that the price structure may enter a recovery phase.
🎯 Resistance / Target Areas:
1️⃣ $0.2400
➡️ The initial resistance that needs to be reclaimed after the breakout.
2️⃣ $0.2750
➡️ The next resistance area and an important level for measuring momentum strength.
3️⃣ $0.3130
➡️ The next resistance that could become a potential profit-taking area.
4️⃣ $0.3450
➡️ The next major resistance zone.
5️⃣ $0.6000
🔥 If strong long-term bullish momentum develops and all previous resistance levels are successfully broken, the $0.6000 area becomes a significantly higher structural target.
📌 The more resistance levels that are successfully converted into support, the stronger the confirmation of a bullish structural shift.
---
🔴 Bearish Scenario — Rejection from the Descending Trendline
⚠️ If price reaches the Descending Trendline again but fails to break above it, this could indicate that sellers are still maintaining control.
📉 A rejection from the trendline could cause price to move lower again and retest previous support areas.
🎯 Key Areas to Watch:
🔻 $0.1450 — important short-term support.
🔻 $0.1130 — previous low area and a stronger structural support level on the chart.
🚨 If $0.1130 is convincingly broken, the bearish structure could regain stronger downside pressure and potentially lead to the formation of a new lower low.
---
⚔️ Key Chart Levels
🟡 $0.2400 — initial resistance
🟡 $0.2750 — next resistance
🟡 $0.3130 — next resistance
🟡 $0.3450 — major resistance
🟡 $0.6000 — long-term structural target
🔴 $0.1450 — important support
🔴 $0.1130 — major support / previous low
📉 Descending Trendline — key dynamic resistance
---
🔎 Conclusion
📊 FET/USDT remains within a long-term Descending Trendline structure, making a trendline breakout a very important technical factor to watch.
🟢 Bullish: Breakout + 4D close above the trendline → attention shifts toward $0.2400 → $0.2750 → $0.3130 → $0.3450, with $0.6000 as a long-term structural area.
🔴 Bearish: Rejection from the trendline → risk of retesting $0.1450, followed by $0.1130 if selling pressure continues.
⚠️ Key factor: Do not rely solely on a breakout wick. A confirmed 4D candle close and the ability of price to hold the breakout area as support will be important factors in distinguishing a valid breakout from a false breakout.
#FET #FetchAI #FETUSDT #Crypto  Long
Long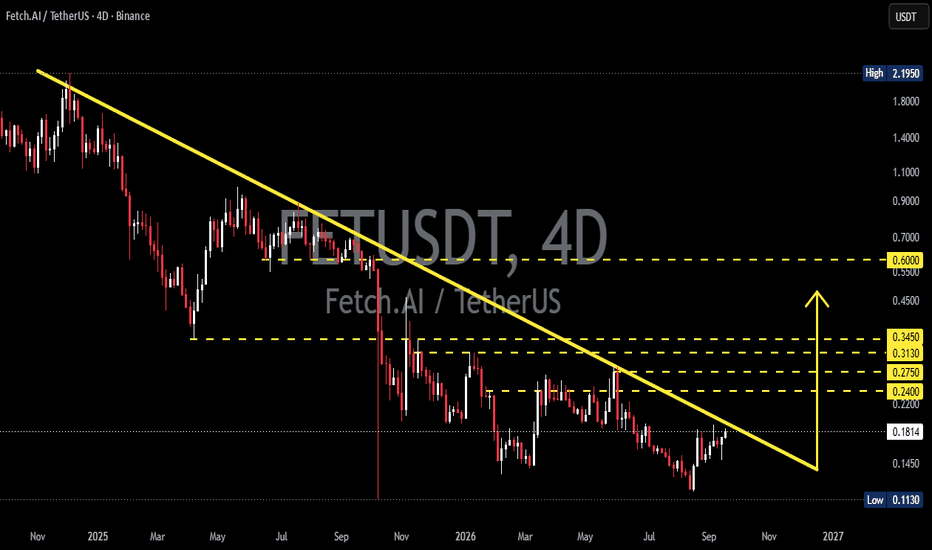
 Long
Long
 Long
Long
 Short
Short
Long 
BTCUSD at a critical zone — the next big move is comingCurrent Price: ~77,470
Timeframe: 4H
Market Bias: 🟢 Bullish above the 76,200 demand zone
🟢 Market Structure
BTCUSD has shown a strong reaction from the 76,200 demand zone after the recent decline. The chart highlights previous BOS (Break of Structure) areas, indicating that buyers have previously demonstrated the ability to shift short-term momentum upward.
Currently, price is consolidating above the demand area. This creates an important decision zone for the next major move.
🎯 Key Demand Zone — 76,200
76,200 is the most important support/demand level on this chart.
If BTC continues to hold this area and buyers regain momentum, the bullish structure remains valid.
A successful bullish reaction from this zone could initiate a move toward the higher resistance levels.
🔥 Key Resistance — 82,500
The major resistance is marked around 82,500.
This is a significant supply/resistance area and could attract sellers. However, a strong 4H breakout and close above 82,500 could indicate further bullish continuation.
🚀 Bullish Scenario
If BTC holds 76,200 and begins forming higher highs and higher lows, the potential path is:
77,500 → 78,500 → 80,000 → 81,500 → 82,500
A confirmed breakout above 82,500 could potentially open the way toward the chart's projected 85,000 level.
📈 Supertrend Confirmation
The Supertrend is currently around 78,481, while BTC is trading below it at approximately 77,470.
This means the immediate trend indicator has not yet confirmed the bullish move. Reclaiming and holding above 78,481 would provide stronger confirmation for the bullish scenario.
🔴 Bearish Invalidation
The bullish setup becomes significantly weaker if BTC breaks decisively below 76,200, particularly with a strong 4H close underneath the demand zone.
That would indicate that buyers failed to defend the key demand area and could lead to further downside.
🧠 Final SMC View
Demand Hold → Bullish Reclaim → BOS → Higher Highs → 82,500 Resistance
The setup is bullish from the demand-zone perspective, but confirmation is important because price is currently below the Supertrend.
Key Support: 76,200
Supertrend: ~78,481
Major Resistance: 82,500
Potential Major Target: 85,000
🔥 The critical battle is between 76,200 support and 82,500 resistance. Long 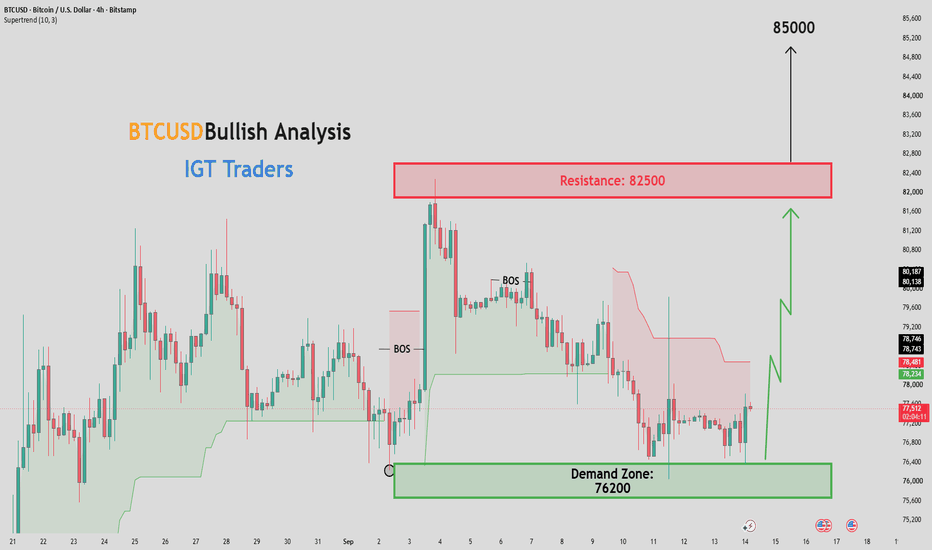
Long 
 Long
Long
Short 
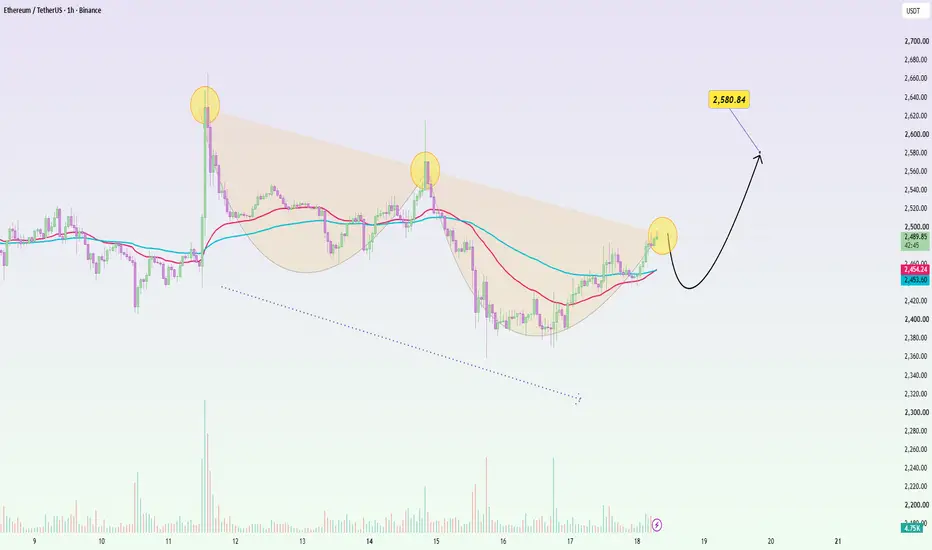
ETHUSDT: Bottom Structure, Recovery PhaseETHUSDT is trading around 2,492 USDT following a strong recovery from the 2,380–2,400 zone. The price has now reclaimed both the EMA34 and EMA89 (around 2,454), while the short-term structure is forming a distinct rounded bottom.
The 2,450–2,470 range is the area I am watching should a pullback occur. If the price holds above the EMA cluster and establishes a "higher low" here, the likelihood of breaking out past the 2,500–2,520 zone increases. In that event, the next target could extend to 2,550, followed by the key level around 2,580 USDT.
Macro factors today are providing mild support for this recovery: the 10-year Treasury yield has eased to approximately 4.94%, oil prices continue to fall, and the Nasdaq has risen nearly 1.7%, helping to improve risk-on sentiment.
The bullish scenario would weaken if ETH loses the 2,440–2,450 zone.
Will ETH retest the EMA cluster before continuing toward 2,580?  Long
Long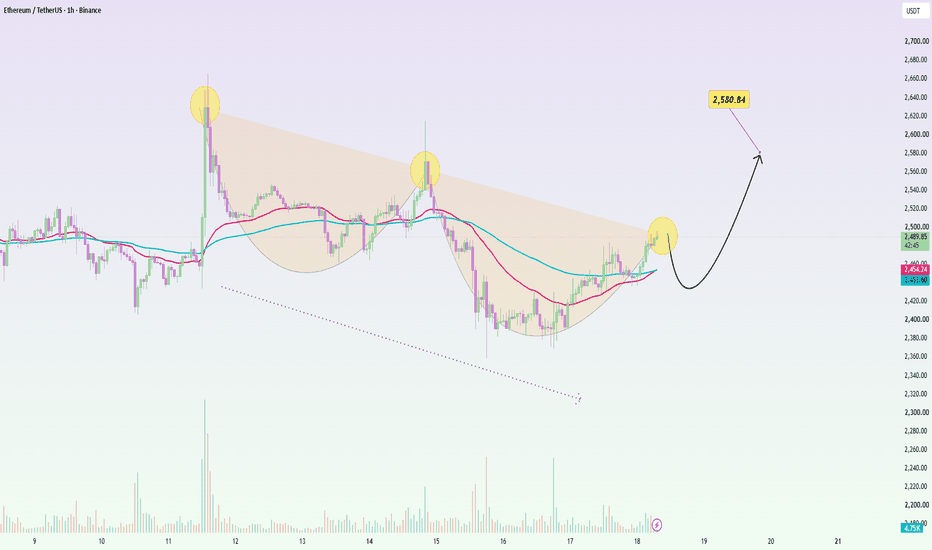
Bitcoin: Stabilisation, but No Confirmed Signal YetFollowing the Fed decision, the initial risk-off reaction across markets has eased. Bitcoin has stabilised as uncertainty recedes, but the previous sell-off has not yet been fully absorbed. A firmer US dollar and continued pressure from the bond market remain headwinds.
Between June and August, Bitcoin formed a second base with an increasingly narrow trading range. The breakout in mid-August came with noticeably higher volume and pushed price back above the previous correction high, bringing it into parity with the prior short-term downtrend. That improved the picture, but it did not yet establish a confirmed trend reversal.
The breakout impulse is now being consolidated. The failed Clarity Act added pressure, but so far it has not triggered a decisive move lower. Volume has recently been less supportive, although buyers have repeatedly stepped in near the lower end of the range.
The relevant levels are clear: support around $75,500 remains intact, while the upper range boundary near $81,500 continues to cap price. As long as Bitcoin remains between these two levels, there is no directional signal.
A sustained break below $75,500 would increase the probability of a return into the former base zone between roughly $60,000 and $65,000.
A break above $81,500 would shift attention back to a potential trend reversal. The next targets would be in the $92,000 to $96,000 area, followed by the psychologically important $100,000 level.
A sustained move above $100,000 would also clear the second correction high and confirm the broader reversal. That would make advances towards $110,000 and $120,000 increasingly likely.  Long
Long
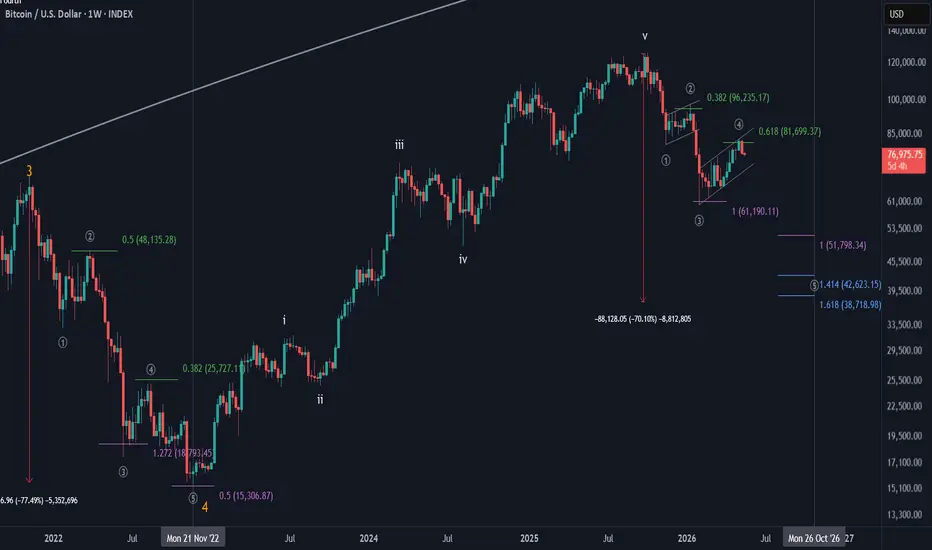
How much more Bitcoin can go down?How much more Bitcoin can go down?
This is a billion-dollar question. To answer it, a simple look at the previous correction phase can shed some light to the unknown future. Let’s dig in.
As can be seen in the chart, waves 2 and 4 in the previous correction phase retraced up to the 0.5 and 0.382 Fib levels, respectively. Interestingly, the waves 3 and 5 went down to the 1.272 and 0.5 Fib extension levels, respectively. This means the wave 3, which was the extended wave among waves 1, 3 and 5, had a deeper correction (wave 2) before going down. On the other hand, the weaker correction (wave 4) led to wave 5 going down only to the 0.5 Fib extension level.
Now, let’s see how the current correction phase has behaved so far. It can be seen that the wave 2 retraced up to the 0.382 Fib level; a weak retracement. Consequently, wave 3 went down to the Fib extension level equal to the wave 1. That means, in this scenario, the wave 3 is not the extended wave. On the other hand, wave 4 retraced up to the 0.618 Fib level; a strong retracement. This can only mean that wave 5 could be the extended wave and go down much more than wave 3 has went; at least to the Fib extension level 1. Therefore, guessing that wave 5 could go down to the area around 1.414 and 1.618 Fib extension levels is not farfetched. Let's see what happens.
Short 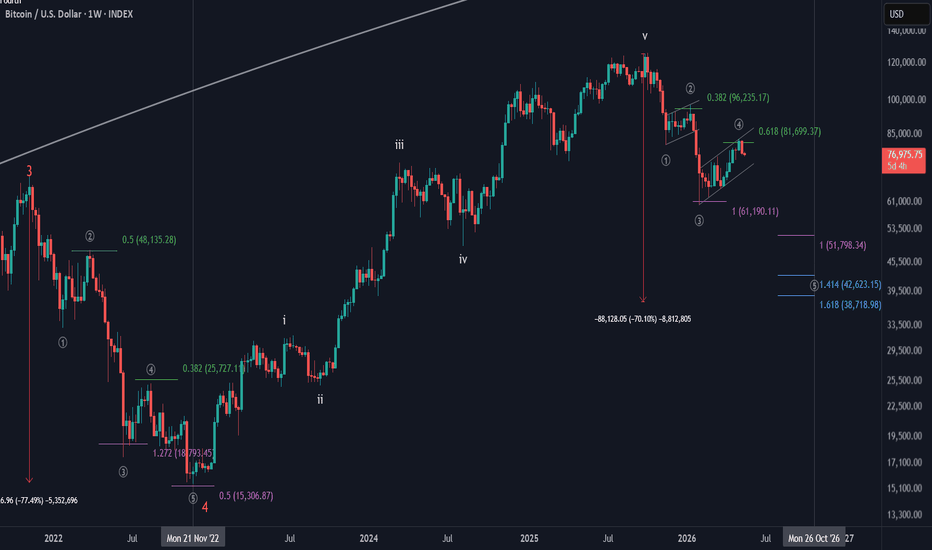
 Long
Long
 Long
Long
 Long
Long
BTCUSDT: Bearish Take Control, Downward Wave!BTCUSDT is trading around 76,230 USDT and remains within a descending channel. The current rebound lacks the strength to alter the market structure, as the price stays below the EMA34 (approx. 76,530) and EMA89 (approx. 77,200), while the pattern of lower highs persists.
The 76,800–77,800 zone is a critical resistance area to watch. If BTC rallies to this region but faces rejection below the EMA cluster and the channel's upper boundary, I lean towards a scenario where the price drops to 75,000, followed by an extension toward the primary target near 74,000 USDT.
Today's macroeconomic data reinforces the bearish outlook. The Fed has raised interest rates by 25 bps to the 3.75%–4.00% range, with most officials anticipating at least one more hike before year-end. Following this decision, the USD strengthened, Treasury yields rose, and US equities fell—creating an unfavorable environment for Bitcoin and risk-on assets.
The bearish scenario would lose momentum if BTC breaks out of the channel and holds firmly above the 77,800–78,000 level. Short 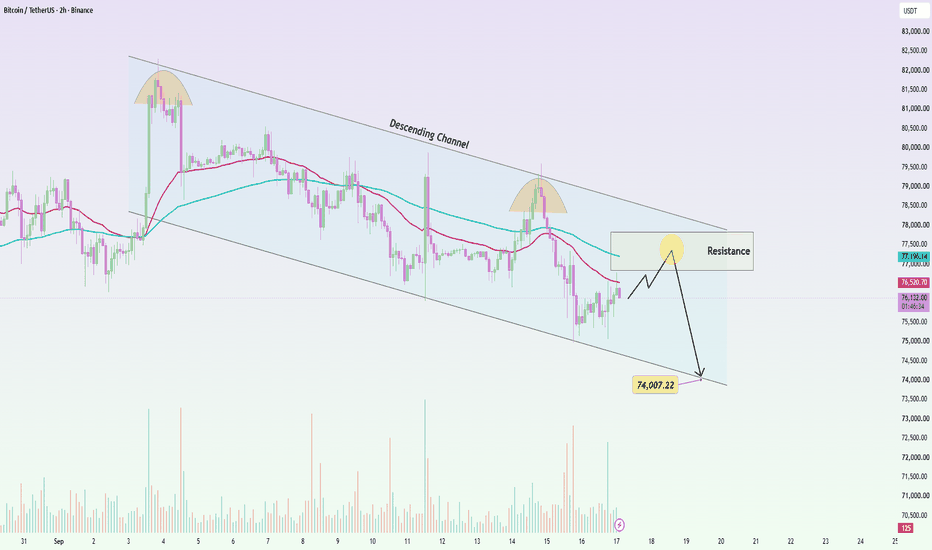
 Long
Long
BTC/USD (4H): Major Support Reclaim & Bullish Liquidity SweepTechnical Analysis
Key Support Zone Reclaimed ($76,000 – $76,273):
Bitcoin recently experienced a fakeout below the major horizontal support zone ($76.2K), sweeping liquidity down toward $75,000 before aggressively bouncing back above the box. This price action creates a Bullish Liquidity Sweep / Spring Pattern.
Resistance Levels to Watch:
Immediate Targets: $78,220 and $79,306 (local structural swing highs).
Major Target: $80,685 – $81,000 (upper supply / resistance zone where sellers previously rejected price multiple times).
Price Action & Structure:
The 4-hour timeframe displays higher-low momentum following the sweep beneath lower structural support. As long as price holds above the blue demand zone ($76,270), the path of least resistance remains biased toward the upside target of $80,685+.
Fundamental Analysis
Federal Reserve Rate Hike Shock: The Federal Reserve recently delivered a 25 bps interest rate hike, causing short-term market volatility and pushing BTC down to test major support levels. However, the quick absorption of sell-side pressure indicates underlying market strength.
Spot ETF Outflows & Regulatory Setbacks: Crypto markets recently faced headwinds from US spot Bitcoin ETF net outflows alongside legislative delays regarding the US CLARITY Act. Despite $500M+ in single-day ETF redemptions, Bitcoin successfully defended the key $75K–$76K floor.
Miner Production Floor: Cost-of-production analysis indicates average miner cash costs sit near the $75,500 mark. Trading right above miner production costs historically forms a strong macro value zone for accumulators.
Trade Idea / Execution Plan
Bias: Bullish
Invalidation / Stop-Loss: Below $75,000 (a clean close under recent sweep lows invalidates the setup).
Take-Profit Targets:
TP1: $78,220
TP2: $79,306
TP3: $80,685
Disclaimer: This analysis is strictly for educational purposes and does not constitute financial or investment advice. Crypto assets are highly volatile. Always manage your risk, do your own research (DYOR), and trade with proper position sizing.
Long 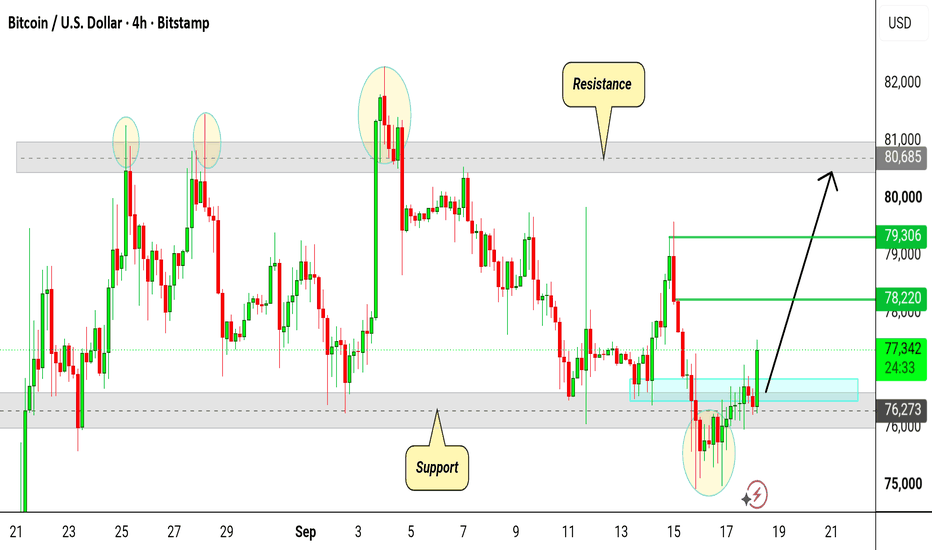
 Long
Long