ETH: Why This Range Trade Still Favors the BullsWhile the S&P, Nasdaq, and Dow sold off following this week's FOMC rate decision, Ethereum held firm. That divergence is a signal.
In this breakdown we walk through our two foundational tools, Previous Period High/Low/Mid/Close and PriceMap, to build and stress test a market thesis in real time.
Price is holding above its monthly directional, the classic pivot that defines trend bias. With the R level sitting beneath the market, sentiment reads bullish. As long as the R level acts as a support floor rather than flipping to a resistance ceiling, the uptrend structure stays intact.
The near term trigger is the previous week's low. Holding above it, even as broader risk assets sell off, signals underlying strength and keeps the bull case alive. Losing it doesn't kill the thesis, it just shifts the read toward the deeper monthly R level as the next area to reassess risk.
Bottom line: this isn't about calling a breakout. It's about knowing exactly where the thesis breaks, and trading with that clarity instead of the noise.

SMC vs ICT — What’s the Difference? SMC (Smart Money Concepts) and ICT (Inner Circle Trader) are closely related approaches to understanding how price moves, liquidity is created, and where potential trading opportunities may appear. They share many concepts, but their terminology and overall approach can differ.
🔹 SMC — Smart Money Concepts
SMC mainly focuses on market structure and price behavior.
Important SMC concepts include:
• Market Structure — Higher Highs (HH), Higher Lows (HL), Lower Highs (LH), and Lower Lows (LL).
• BOS (Break of Structure) — a break that can indicate continuation of the existing structure.
• CHOCH (Change of Character) — a potential indication that market structure is changing.
• Liquidity — areas where stop orders may be concentrated, such as equal highs and equal lows.
• Order Blocks — price areas traders may watch for potential reactions.
• FVG (Fair Value Gap) — an imbalance created by strong price movement.
SMC can therefore be used to build a broader view of structure, liquidity, and potential reaction zones.
🔹 ICT — Inner Circle Trader
ICT is a trading methodology developed by Michael J. Huddleston. It also uses liquidity and market-structure concepts, but places significant emphasis on time, sessions, price delivery, and specific entry models.
Common ICT concepts include:
• Liquidity Pools — areas around important highs and lows.
• Liquidity Sweep — price temporarily taking liquidity before potentially reversing or continuing.
• Kill Zones — specific time windows that traders watch for increased activity.
• Fair Value Gaps (FVGs) — imbalances that can become areas of interest.
• PD Arrays — a group of price-delivery concepts used to identify potential areas of interest.
• Session Highs & Lows — important levels from Asian, London, and New York sessions.
• Displacement — strong price movement that can provide confirmation of a shift in price delivery.
📌 Simple Example
Imagine price is moving upward and creates a series of Higher Highs and Higher Lows.
An SMC trader may focus on:
Liquidity → BOS → Order Block → FVG → Entry
An ICT-style analysis may add another layer:
Session timing → Liquidity sweep → Displacement → FVG/PD Array → Entry
The exact setup depends on the trader’s model and rules.
⚡ Key Difference
SMC: More commonly presented around market structure, liquidity, Order Blocks, FVGs, BOS, and CHOCH.
ICT: Uses many overlapping ideas but places additional emphasis on time, sessions, liquidity delivery, PD Arrays, and specific execution models.
🧠 Final Takeaway
SMC and ICT are not completely separate worlds. There is substantial overlap between the concepts used in both approaches. The main difference is often how the concepts are organized, defined, and applied.
The goal should not be to memorize every term. First understand market structure → liquidity → displacement → imbalance → confirmation → risk management.  Education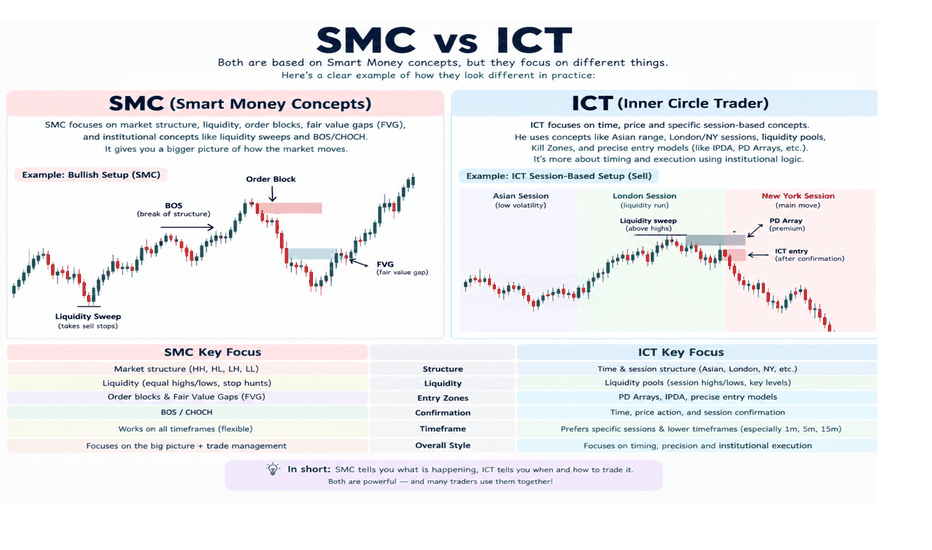
TradeCityPro | Bitcoin Daily Analysis #367👋 Welcome to TradeCity Pro!
Let’s take a look at Bitcoin. The interest rate decision was released today, and we can now see how price reacted to the news.
⌛️ 1H Timeframe
On the 1-hour timeframe, Bitcoin is attempting to establish a close below 76,630. After breaking this support, price is currently reacting to the 75,440 level.
⛏ Today’s interest rate news did not have a significant impact on Bitcoin. Price simply formed a Doji candle, and we can now say that the news-driven volatility has faded.
⭐ If the 75,440 level breaks, we can look for a short position. A break of this level could initiate a new bearish move.
✨ On the other hand, if price manages to reclaim 76,630, the bullish move could resume, and we can look for a long trigger.
❌ Disclaimer ❌
Trading futures is highly risky and dangerous. If you're not an expert, these triggers may not be suitable for you. You should first learn risk and capital management. You can also use the educational content from this channel.
Finally, these triggers reflect my personal opinions on price action, and the market may move completely against this analysis. So, do your own research before opening any position. $7,000 Ether & Why (the New All-Time High!)This is why!
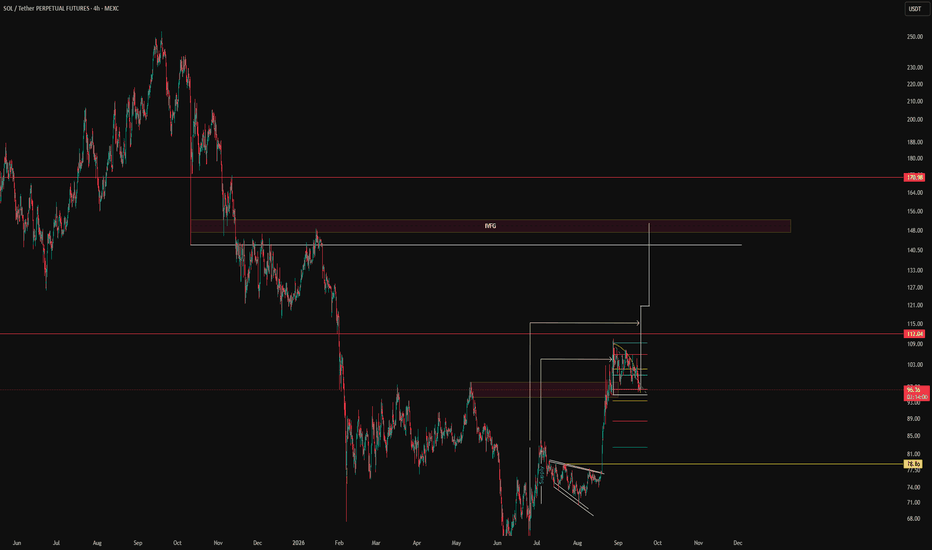
Now I see a repeat of the May-July 2025 bullish consolidation period, it is the exact same but much better of course.
ETHUSDT started to rise then went sideways, then nothing is happening now.
Where is the market headed next?
Here I am calling for a bullish continuation and for obvious reasons.
Why would ETH produced a long-term higher low (June 2026 vs April 2025) to start rising just to produce a lower low next?
Support has been confirmed and fully established, a new and higher long-term support base. The market does this in order to reach new highs, to go much farther. Higher support, higher challenges on the way up. We are headed for a new all-time high.
ETHUSDT is trading below MA200 on the 2D timeframe. At the same time, the action is happening above EMA89 and EMA144, both of these support long-term growth.
As long as ETHUSDT 2D trades above EMA144 & EMA89 ($2,300 & $2,180), we can consider this chart setup hyper-bullish.
While the market can be expecting a long-term resolution to the current state of affairs, it can happen that growth starts within days or weeks rather than months as it happened back in 2025.
This time, plenty of accumulation is present at the bear market bottom. This period of accumulation can in turn reduce the need for a prolonged duration to the current consolidation phase.
All doubt has been removed. The numbers are out. The news is already old.
Now that everything is out of the way, regardless of the results and expectations, the Cryptocurrency market will continue growing for sure! (?)
We are going up and this is truly only the start. From the bottom we grow.
Thanks a lot for your continued support, it is appreciated.
Namaste.  Long
Long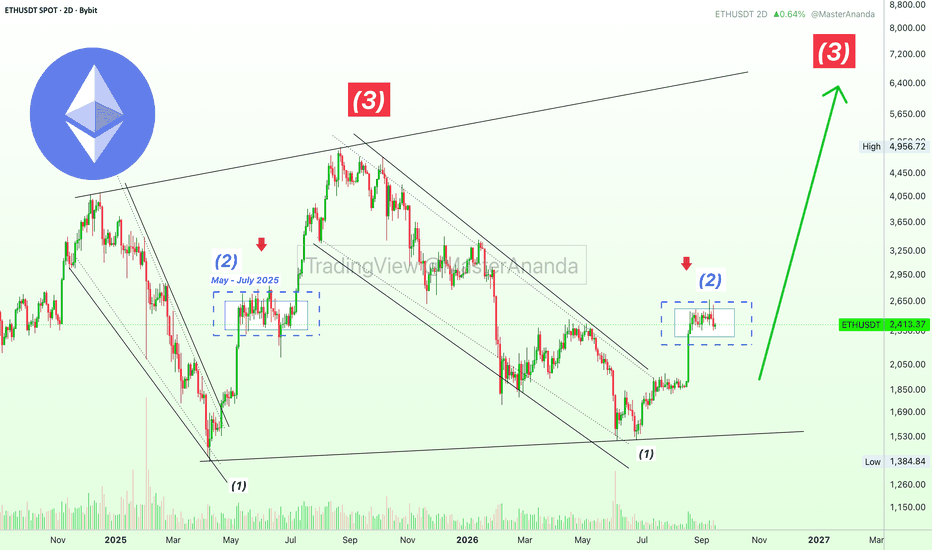
ETH 4H Bearish: The Flock Bought the First Green CandleOne green candle below resistance, and the flock has already misplaced the life jackets.
ETH bounced from a low near $2,366 and trades around $2,405. The panic has cooled, but the structure has not reversed: price remains below the 4H 9 EMA at $2,420 and below the level that changes the mood — $2,436.
The 4H 200 SMA near $2,370 is holding underneath price. That keeps the pond from breaking, but it does not yet give buyers control.
AI Agent read: 4H momentum remains bearish — RSI is 35.1 and MACD histogram is -10.431. Volatility remains normal; the AI Agent does not see an elevated-volatility regime yet.
📍 AI Agent Trade Map
Signal: 4H Bearish
Trigger: A failed 4H attempt to reclaim $2,436
Target: 🎯 $2,357
Key Resistance: $2,436
Support Zone: $2,357 — candidate support; it needs a reaction, not blind faith
If buyers take control: $2,531–2,546 — major supply zone
Invalidation: A sustained 4H close above $2,436. The AI bearish reading ends only if RSI closes above 45 or MACD histogram returns to zero or higher.
❓ Is the 200 SMA absorbing the fear — or is this simply a calmer place for sellers to return?
The flock quacks. The level answers.
Personal market commentary, not financial advice. Short 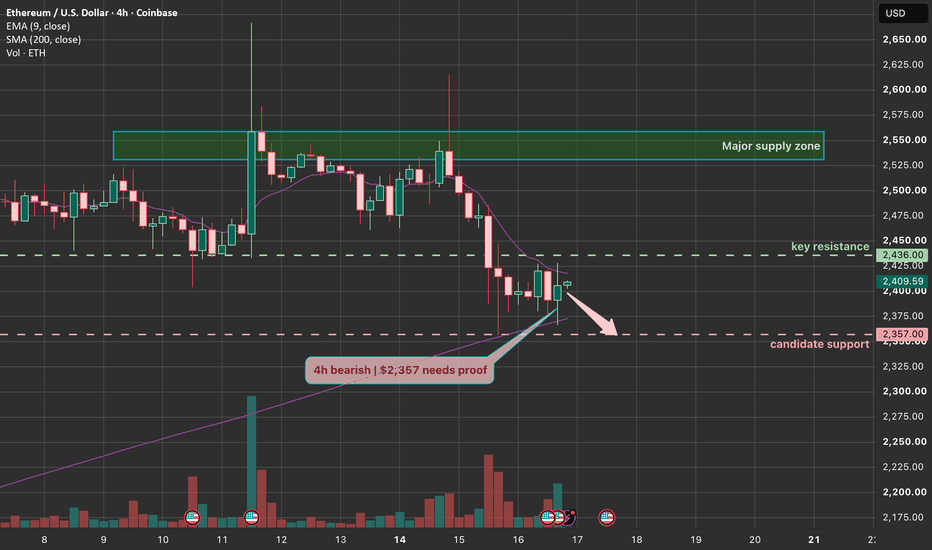
Short 
 Long
Long
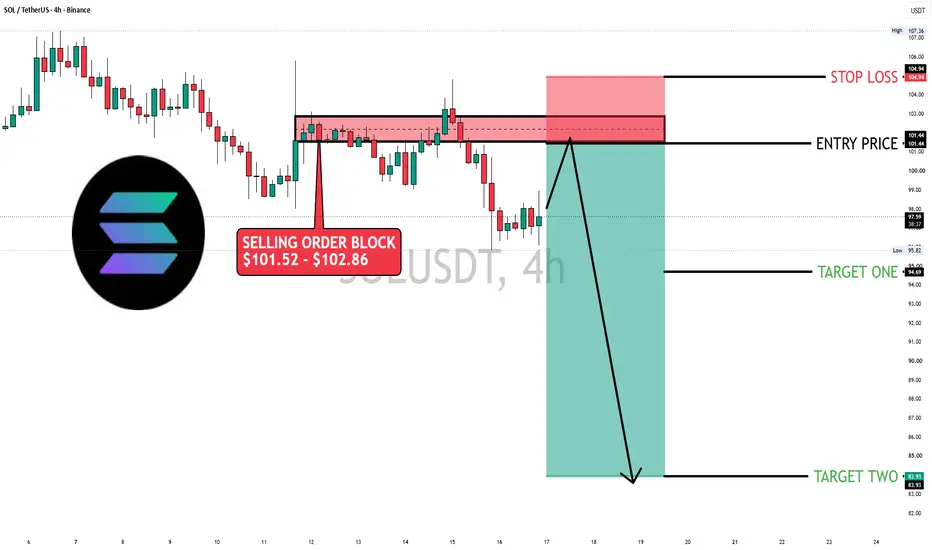
$SOL | 4D | SELL SETUP |While the retail crowd thinks Solana's recent 2% recovery is the start of a massive breakout, the 4-hour chart is setting up a textbook short retest of its selling order block with an asymmetric 1:5 risk-to-reward ratio. 🚨
Current Structure:
Price: $97.87
Reaction: Rebounded a minor +2.14% from its local low ($95.82) after a -10.75% dump from its local peak ($107.36).
Pattern: Corrective Relief Rally inside a descending channel.
Bias: Bearish below the $101.44 resistance zone.
"The Level That Decides Everything":
The $101.52 - $102.86 Selling Order Block. Bids are queued at the $101.44 entry price. If this supply zone rejects the relief rally, it clears the way for a deeper correction to take out local swing support. A daily close above $104.94 invalidates the setup.
Targets: Target One at $94.69, Target Two at $83.93.
The Move So Far:
Dumped -10.75% from its $107.36 local high to its $95.82 low. On the macro scale, CRYPTOCAP:SOL is down 66.75% from its $294.33 All-Time High (Jan 2025) and up a massive +19,442.73% from its $0.5008 All-Time Low (May 2020).
Fundraising Breakdown:
Total Raised: $359.7 Million across 7 funding rounds.
Key Rounds: Private seed sale raised $3.17 Million (price $0.04), Series A raised $20 Million, and the private sale in June 2021 raised $314.15 Million led by Andreessen Horowitz (a16z).
ICO/IEO Entry Prices:
Public ICO on Coinlist (March 2020) raised $1.76 Million at an entry price of $0.22. Early ICO participants are currently sitting on a massive ~445x return on investment.
Unlock Pressure Ahead:
Locked Supply: 0% locked. Solana is fully unlocked, meaning all legacy team, founder, and seed rounds are completely circulating.
Supply Mechanics: Programmatic inflation is the sole driver of new supply. On August 28, 2026, the SGP-0002 "Double Disinflation" vote passed (67.001% approval), doubling annual disinflation from 15% to 30%, which massively accelerates its path to a 1.5% terminal floor.
Key Levels:
Resistance 1 / Resistance 2: $101.52 / $102.86
Entry: $101.44 (SHORT setup)
Support (range): $94.69 - $83.93
Invalidation / Stop Loss: $104.94
Closing Thesis:
Solana’s tokenomics are now fully unburdened by legacy VC unlock cliffs, and the network’s successful "Double Disinflation" vote significantly reduces future dilution. However, technicals rule the short-term. The 4-hour relief rally is running straight into an aggressive overhead selling block. Rejection at $101.44 sets up a perfect 1:5.00 short trade down to $83.93. Below it, the bearish thesis is locked in. 🎯
Bearish below $101.44. Above it, the story flips.
Not Financial Advice. ALWAYS DYOR.  Short
Short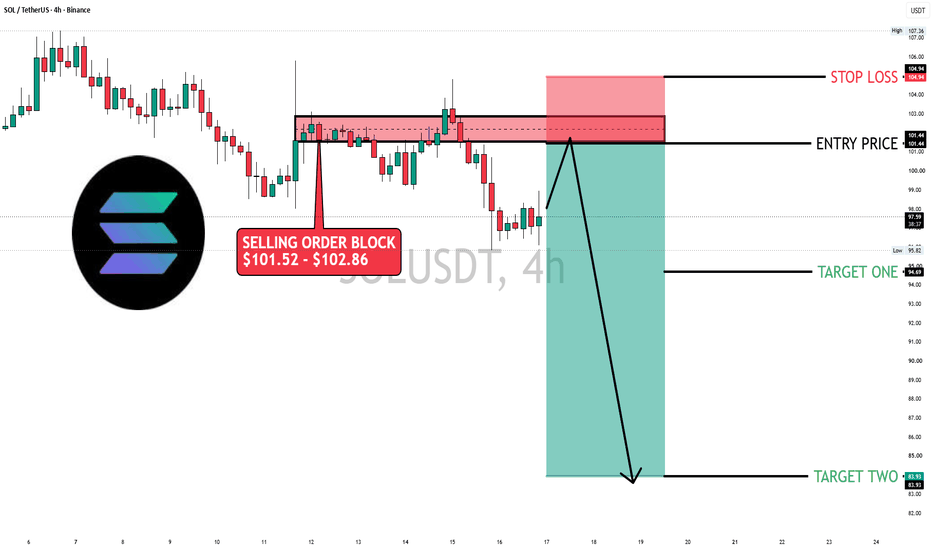
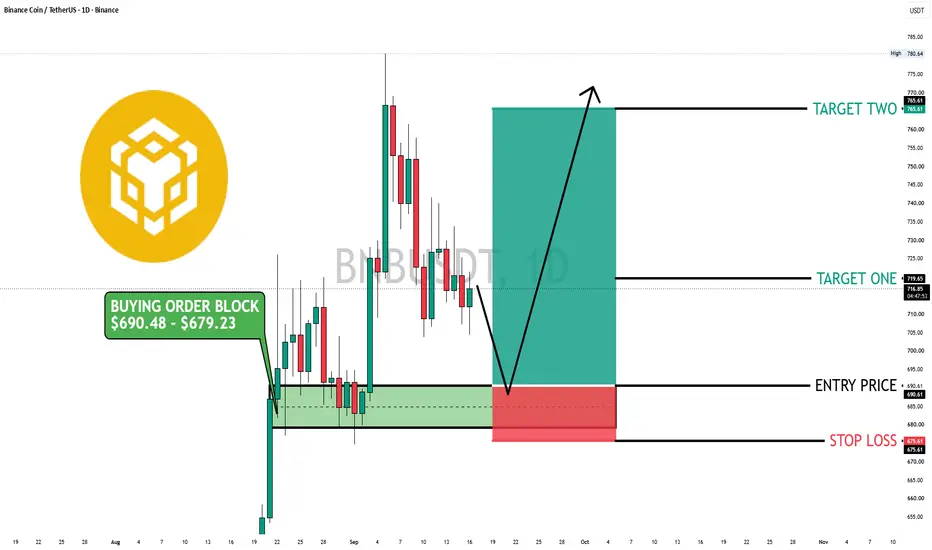
$BNB| 1D | BUY SETUP |While the retail crowd panics over a minor -8.00% correction, the daily chart shows a textbook institutional accumulation block forming at a highly favorable 1:5.00 risk-to-reward ratio. 🚨
Current Structure:
Price: $718.19
Reaction: Rejected and pulled back -8.00% from its local high of $780.64 on Sep 12/13.
Pattern: Daily Horizontal Support Range / Accumulation Block.
Bias: Bullish as long as the $679.23 key support floor holds.
"The Level That Decides Everything":
The $690.48 - $679.23 Daily Buying Order Block. Bids are queued at the $690.61 entry price. If this floor holds on a retest, it confirms a strong trend reversal to clear local range resistance. A daily close below $675.61 invalidates the setup.
Targets: Target 1 at $719.65, Target 2 at $765.61.
The Move So Far:
Down 8.00% from its local high of $780.64. On the macro scale, CRYPTOCAP:BNB is down 47.77% from its $1,375.11 All-Time High (Oct 2025) and up a massive +1,803,491% from its $0.03982 All-Time Low (Aug 2017).
Fundraising Breakdown:
Total Raised: $15 Million via public ICO in July 2017.
Implied Launch Valuation: $30 Million. Public sale allocation: 50% (100M BNB), founding team: 40% (80M BNB), angel investors: 10% (20M BNB).
ICO/IEO Entry Prices:
Public sale participants entered at an average price of $0.15 per BNB on Ethereum. ICO buyers are currently sitting on an astronomical ~4,788x return on investment against USD today.
Unlock Pressure Ahead:
Locked Supply: 0% locked. The final vesting schedule for team and angel investors successfully concluded on July 25, 2021. No lockup cliffs or insider dilution risks remain.
Supply Dynamics: Deflationary. Features real-time gas burns (BEP-95) and formulaic Auto-Burns continuously reducing circulating supply toward a target of 100 Million BNB.
Key Levels:
Resistance 1 / Resistance 2: $719.65 / $765.61
Entry: $690.61 (inside Order Block)
Support (range): $690.48 - $679.23
Invalidation / Stop Loss: $675.61
Closing Thesis:
BINANCE:BNBUSDT remains one of the safest L1 ecosystem plays, featuring 100% of supply fully unlocked, VC cliff risks at absolute zero, and an active auto-burn mechanism keeping it purely deflationary. Technically, the daily retest of the green order block offers a highly favorable 1:5.00 risk-to-reward ratio for swing traders. If the $679.23 support holds, the path to $765.61 is clear. Below it, the story flips. 🎯
Bullish above $679.23. Below it, the story flips.
Not Financial Advice. ALWAYS DYOR.  Long
Long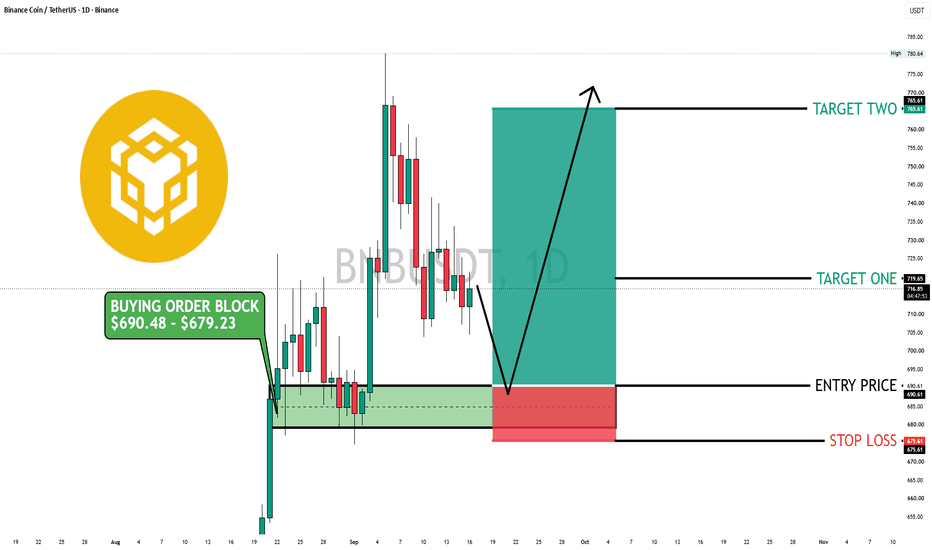
Bitcoin PA and US Fed Rate Rises since 2021 - the Effects
So, The USA Federal Reserve just raised rates by 25 points as expected.
And the question on most peoples minds is "Will this upset my trading?"
And if, Like Me, you focus on BITCOIN, you should pay attention but more to what it does to OTHER ASSETS.
The Main chart shows Bitcoin INDEX and All the Rate decisions, when they happened. ( It is a weekly chart so the EXACT day is not there but it is in that week)
The whole Chart is to Big to fit on one screen so here is the chart from the 2021 ATH to the Mid 2024 range.
What are these RED and GREEN Boxes?
In the Chart from 2021, the first RED Box is where the US FED raised Rates and Bitcoin PA Dropped.
Many would say this would be expected as borrowing got more expensive. The Fed Effect
However, the GREEN box that Follows is were the FED CONTINUED to Raise Rates but Bitcoin PA ROSE or Ranged. It DID NOT Drop like a Stone as previously. NO FED EFFECT
The Main chart also has a RED box,
As you can see, this is were Bitcoin Dropped after that October 2025 ATH.
But the FED Was Lowering the interest Rate for Borrowing !
Why was Bitcoin not paying attention ?
Again, NO FED EFFECT
There are many reasons, other assets were more favourable, Mostly due to Bitcoin being OVER BOUGHT on may time frames and Due a Bear Market after ATH.
So, as you can See, BITCOIN Follows its own rules and one reason for that, and this needs to be remembered, BITCOIN IS NON CENTRALIZED>
IT IS NOT BASED IN THE USA
IT DOES NOT NEED TO BE EFFECTED BY THE FED and as you can very clearlly see here, It often Is not.
That is NOT a insult to the USA, just a Fact.
There are many HUGE American Bitcoin investors and YES, for them ,borrowing to buy Bitcoin costs more....
WE just have to wait and see where Bitcoin WANTS to go next.......but I do not think that recent BULLISH moves will be undone by raises in interest Rates in the USA
BUT WE DO NEED TO REMAIN CAUTIOUS AS GLOBAL MACRO WILL HAVE EFFECTS.
And yes I was shouting Sorry
Stay Safe, Love one another and BUY BITCOIN
$ETH| 1D | BUY SETUP |While the retail crowd panics over a 9% pullback triggered by the Senate's CLARITY Act failure, the daily chart is print-perfect, retesting its primary buying block with an asymmetric 1:4 risk-to-reward setup. 🚨
Current Structure:
Price: $2,417.55
Reaction: Rejected and pulled back -9.32% from its local high of $2,665.99 on Sep 12.
Pattern: Daily Horizontal Support Range / Accumulation Block.
Bias: Bullish as long as the $2,249.71 support floor holds.
"The Level That Decides Everything":
The $2,326.77 - $2,249.71 Daily Buying Order Block. Bids are queued at the $2,328.22 entry price. If this floor holds on a retest, it confirms a strong trend reversal to clear local range resistance. A daily close below $2,228.22 invalidates the setup.
Targets: Target 1 at $2,507.06, Target 2 at $2,728.22.
The Move So Far:
Down 9.32% from its local high of $2,665.99. On the macro scale, CRYPTOCAP:ETH is down 51.2% from its $4,953.73 All-Time High (Aug 2025) and up over +575,500% from its $0.42 All-Time Low (Oct 2015).
Fundraising Breakdown:
Total Raised: ~$18.3 Million worth of Bitcoin (approx. 31,591 BTC) in 2014.
Implied Launch Valuation: ~$22 Million at genesis. No venture capital rounds or private seed allocations existed prior to the public crowdsale.
ICO/IEO Entry Prices:
Public ICO finished in September 2014 at an average price of $0.311 per ETH. ICO investors received over 60M ETH. Today, this represents an annualized return on investment of over 270%, or a ~7,773x return on capital.
Unlock Pressure Ahead:
Locked Supply: 0% locked. 100% of the 122 Million supply has successfully vested. No early founder, team, or foundation cliff allocations remain to dilute holders.
Vesting: Fully circulating. New supply enters via programmatic staking validation (~3-6% APR), offset dynamically by EIP-1559 base-fee gas burns.
Key Levels:
Resistance 1 / Resistance 2: $2,507.06 / $2,728.22
Entry: $2,328.22 (inside Order Block)
Support (range): $2,326.77 - $2,249.71
Invalidation / Stop Loss: $2,228.22
Closing Thesis:
CRYPTOCAP:ETH ’s near-term price was temporarily hit by Washington’s regulatory gridlock, but the long-term fundamentals of the smart-contract economy remain untouched. Technically, the daily retest of the green order block offers a highly favorable 1:4.00 risk-to-reward ratio for swing traders. If the $2,249.71 support floor holds, the path to $2,728.22 is wide open. Below it, the story flips. 🎯
Bullish above $2,249.71. Below it, the story flips.
Not Financial Advice. ALWAYS DYOR. Long 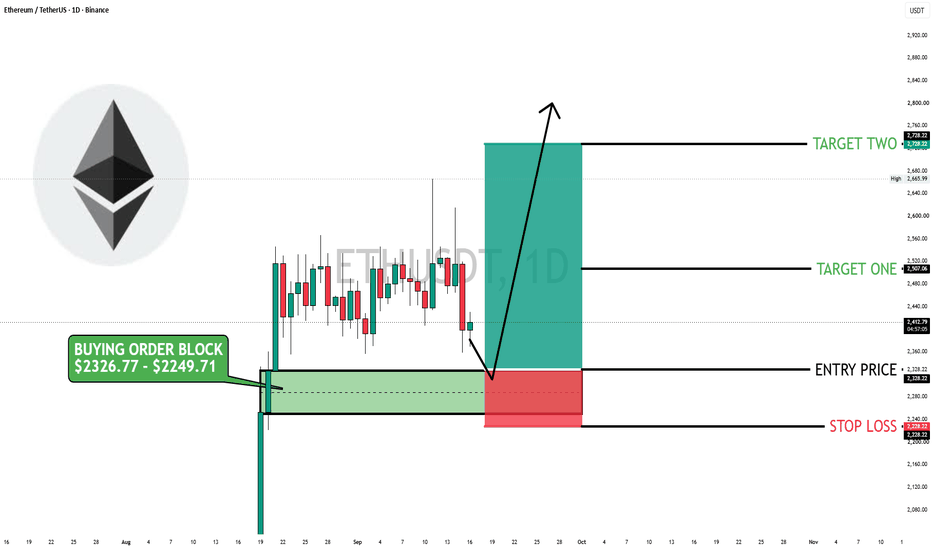
 Short
Short
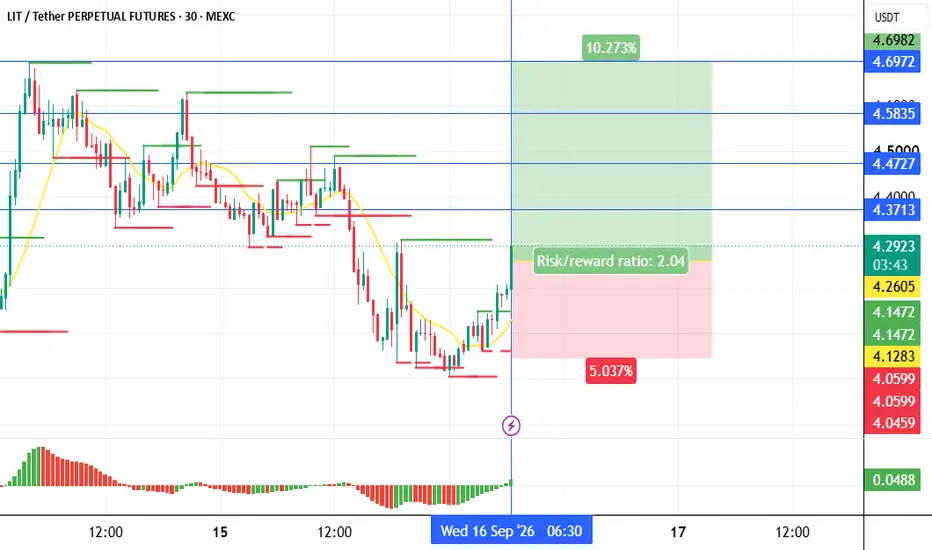
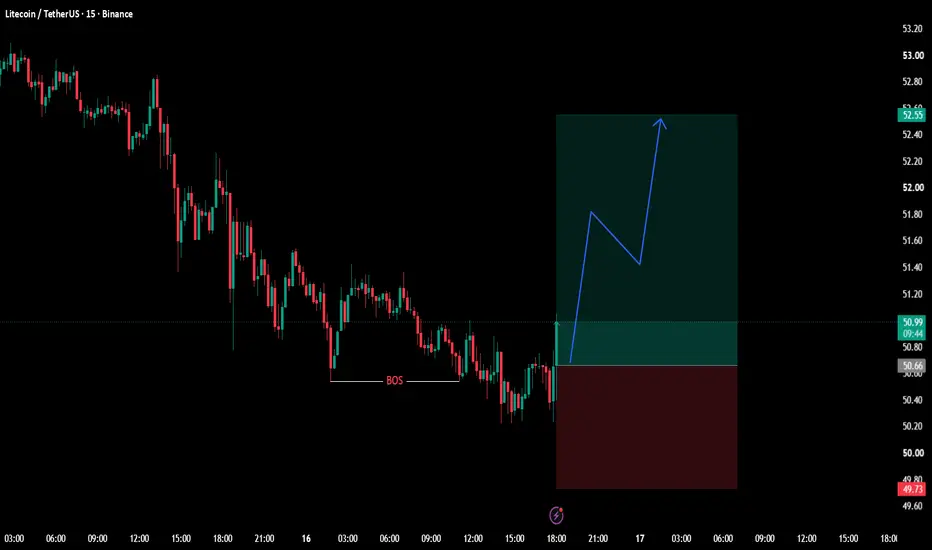
litusdt longInstructions:
Entry point: yellow
Stop loss: red
Take profit: green or blue
👉Leverage x 5-10-20 for crypto
👉Leverage x 20-50-100 for commodities, stocks, indices, and forex
👉Margin 1-5% max.
Always practice risk and money management.
Invest a maximum of 5% on any trade or across all your trades.
Invest only what you can afford to lose, as no one is in control of the market.
👉Our analyses are primarily based on:
breakouts: two trend lines (ascending and descending) and a line indicating a horizontal breakout.
chart patterns: shoulders and head, triangle parttern, elliott impulse, etc etc.
We don't always have the time to track them at all times or to represent them visibly, given the numerous signals, the number of channels to manage, and especially because of the often rapid pace of market movements.
indicators: We associate at least two indicators with this technique.
👉Depending on the circumstances, we use specific indicators, often setting 3 or more take profit levels.
👉Indeed, there are good days in trading and also bad days. No one can promise to win every trade, and like all traders worldwide, we also experience stop-loss orders. However, we win more than we lose and remain positive.
👉You can close the position before or after the take profit orders indicated by the green lines if you are personally satisfied; the same applies to stop loss orders.
👉We must stay positive, clear-headed, and humble.
we cannot provide all instructions or all trades here on this channel.
Good luck to us all, and may God guide us. Amen.  Long
Long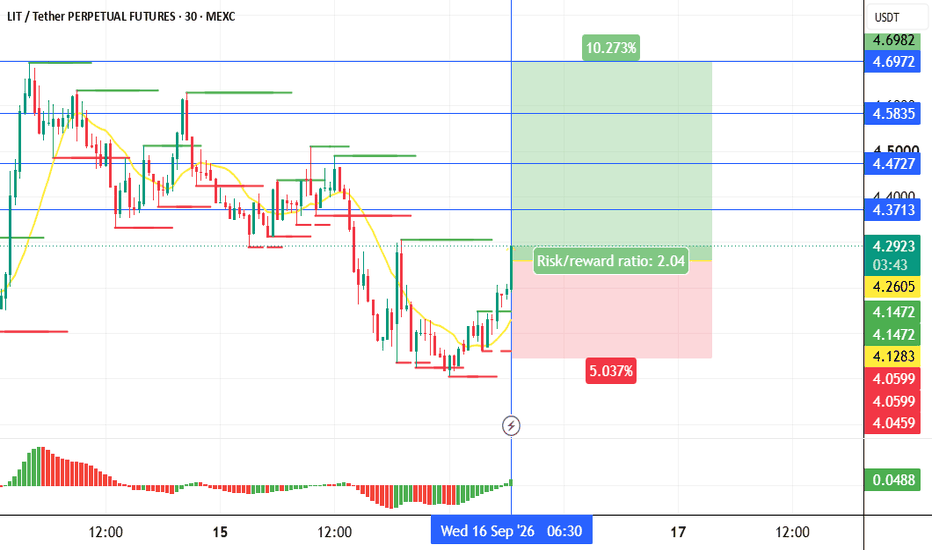
BTC/USD — Support Zone Reaction With Upside TargetBTC/USD is currently testing a marked support/demand zone around 75,550–76,050. Price has shown consolidation in this area after the recent decline, making it an important level to watch for a potential reaction.
The chart highlights a possible upside scenario from this zone:
Entry area: 75,550–76,050
Invalidation / Stop: below 75,487
Target: around 78,698
Key resistance area: approximately 78,700–79,200
The idea is based on price holding the marked support zone and moving toward the higher resistance area. If price breaks and holds below the support/invalidation level, the setup would no longer be valid. Long 
BTC - Ultimate Swing Short - Refined Targets & LevelsI have taken time to refine this parallel ascending channel structure, looking at the areas most consolidated, and structured on by support and resistance - as well as matching with volume confluences and other confluences.
Details for the short:
Entry zone - 76,200 to 76,700
Stop Loss - 82,800
Targets (Refined and Updated):
1) 66,700
2) 57,300
3) 47,700
4) 34,900
5) 21,800
6) 6,800 to 7,250
Happy Trading,
Technical Anarchist (Formerly D. Dandy) Short 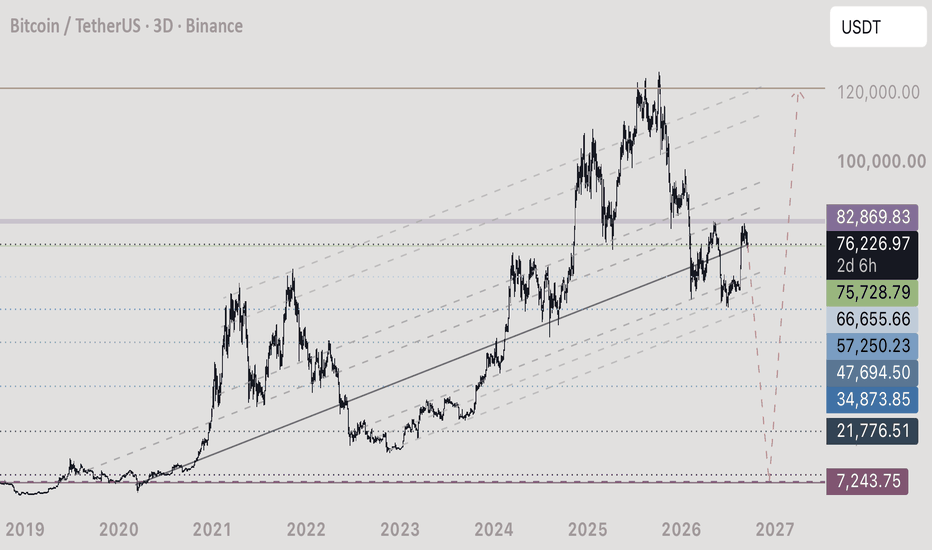
Long 
 Long
Long
 Short
Short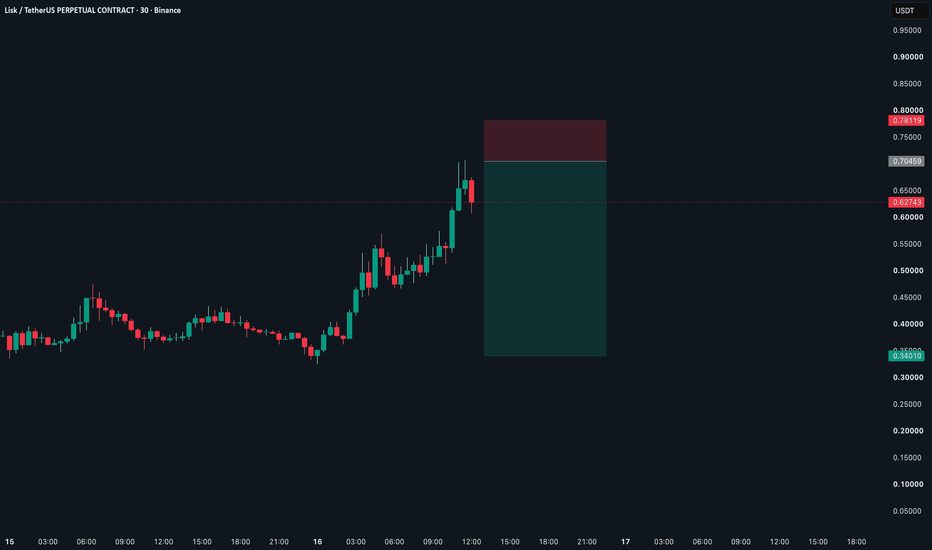
 Short
Short
Long 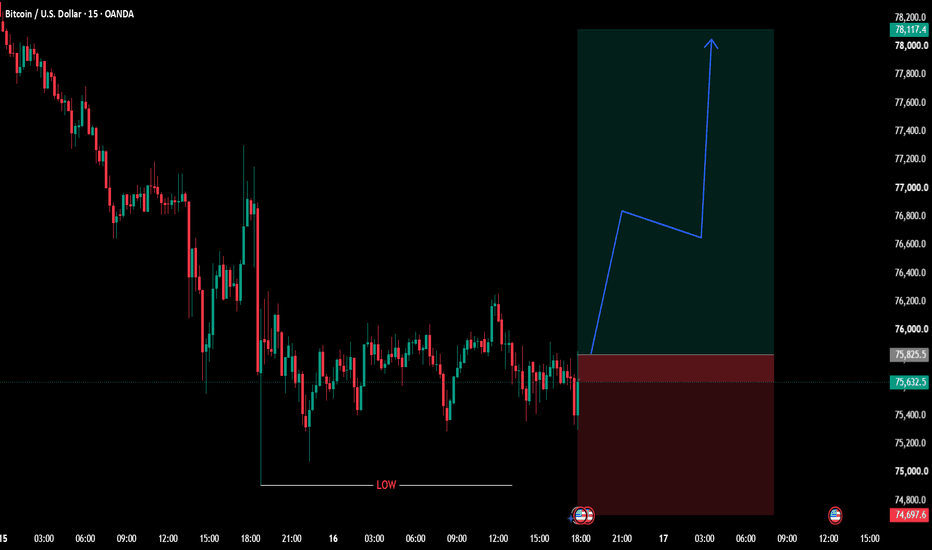
Long