USDT.D The Calm Before the Storm?This is my personal view of the current market structure.
I believe USDT Dominance is currently forming Wave 5 of the Elliott Wave structure. At the moment, USDT.D is sitting on a strong confluence of support:
๐น Horizontal support
๐น Bull Flag
๐น SHA support
We've been consolidating in this area for around two weeks, suggesting that the market is still building energy before the next major move.
I expect July may still allow some upside for altcoins, meaning USDT.D could continue to range in this zone for a bit longer. However, I think August could mark the beginning of another move higher for USDT.D, which would likely put renewed pressure on the altcoin market.
The projected path and dates are only an approximation of how I currently see the structure developing; they're not meant to predict exact timing.
I decided to share this because lately I've been seeing "Altseason is here!" almost everywhere. Personally, I think many traders are getting ahead of themselves.
If USDT.D continues to rise, I'll keep DCAing into projects I strongly believe in, especially ETH and a few other long-term holdings.
Good luck, everyone! ๐๐
Crypto market
TradeCityPro | Bitcoin Daily Analysis #333๐ Welcome to TradeCityPro!
Let's analyze Bitcoin. The market is still trading inside a range.
โณ 4H Timeframe
On the 4-hour timeframe, Bitcoin is currently trading inside a large range between 60,802 and 67,278.
โ๏ธ After the fake breakdown below 60,802 on the higher timeframes, our expectation was for price to rally toward the top of the range with strong bullish momentum.
โจ However, since returning to the range, bullish momentum has been noticeably weak. The market is lacking conviction, and the uptrend is showing clear signs of weakness.
๐ฅ The RSI has also formed a bearish divergence, while trading volume has remained relatively flat. If buying volume starts to decline, the probability of a trend reversal will increase.
โก๏ธ In that case, if Bitcoin closes below 62,783, a new bearish move could begin. Since price failed to reach the top of the range and instead formed a lower high, the probability of a sharper downside move has increased, potentially marking the beginning of the next bearish wave on the higher timeframes.
๐งฎ So, 62,783 is our first short trigger. The next key downside levels to watch are 60,802 and 58,321.
โญ On the other hand, if this weakness disappears and price holds above 65,475, bullish momentum could return. In that scenario, a breakout above 67,278 would provide a long entry, with the potential for Bitcoin to continue its move higher.
โ Disclaimer โ
Trading futures is highly risky and dangerous. If you're not an expert, these triggers may not be suitable for you. You should first learn risk and capital management. You can also use the educational content from this channel.
Finally, these triggers reflect my personal opinions on price action, and the market may move completely against this analysis. So, do your own research before opening any position.
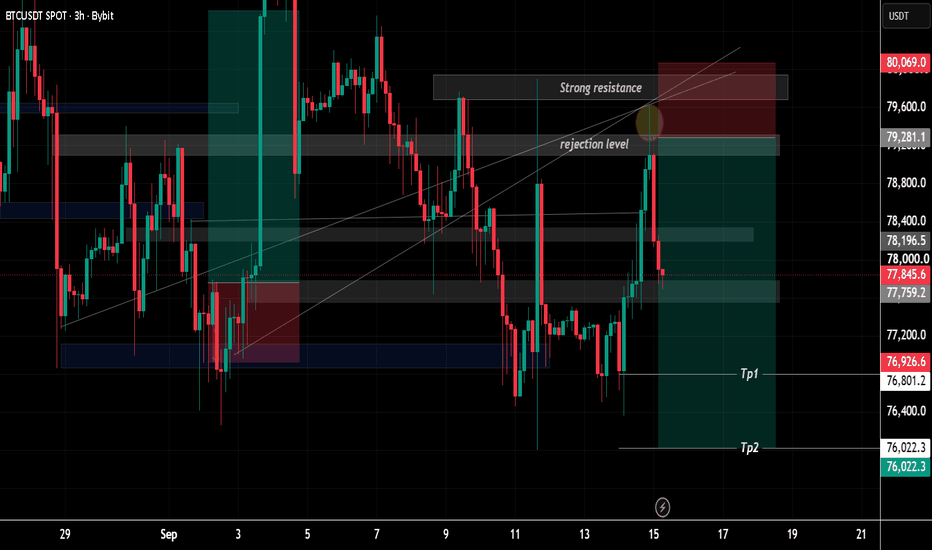
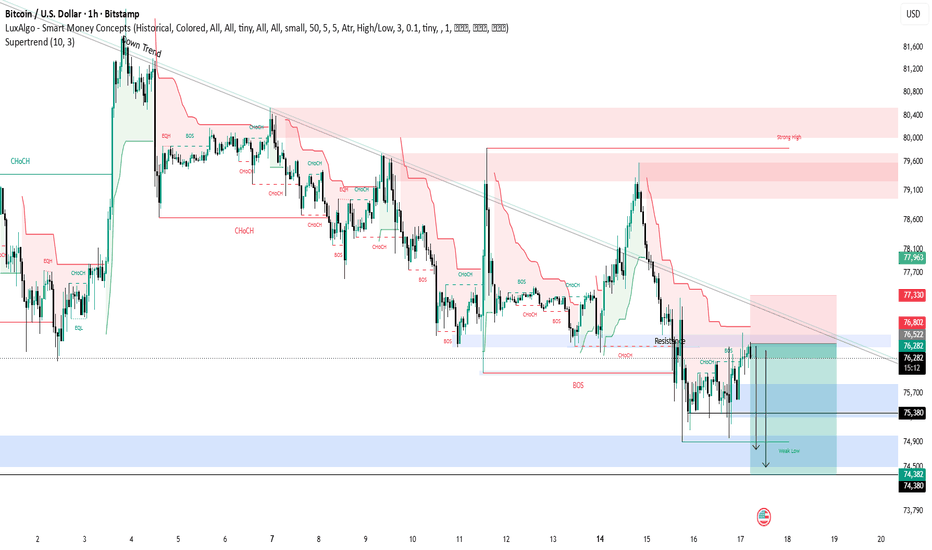
$BTC 30MinBitcoin has formed a Double Top pattern on the 30-minute timeframe โณ and looks ready for further downside ๐.
Considering the current global market conditions ๐โ ๏ธ, I believe a further drop is more likely.
๐ฏ You can take your Take Profit levels in 3 stages:
โ
TP1
โ
TP2
โ
TP3
(Gradually secure your profits ๐๐ฐ)
NEARUSDT: Key Imbalance Formed | 1.414 External Expansion TargetMarket Context & Order Flow
On the 15-minute timeframe, NEAR has established a distinct institutional market structure shift. Following a liquidity hunt into discount arrays, a key imbalance has been formed, confirming the presence of strong institutional buying pressure and an aggressive shift in Order Flow.
Technical Highlights:
Imbalance Confirmation: The recent impulsive move left a clear price inefficiency (imbalance), validating our local POI.
Fibonacci Confluence: The order delivery is engineered to target premium liquidity pools above the recent swing highs.
Execution Plan:
We are anticipating a sustained bullish expansion directly toward the 1.414 external Fibonacci expansion level, offering a projected ~7.32% move from the current structural accumulation zone.
Position management will be executed strictly in accordance with institutional key levels as the trade develops.
๐ Boost this idea if you agree with the analysis, and feel free to share your thoughts in the comments below!
BTCUSD OPPORTUNITY YOU DONT WANNA MISS!Price has provided us with a potential buy opportunity. in this video I explained step by step, all the possible reason for the next potential buy opportunity in this pair. We identified the following
1. The overall market trend using the H1 Timeframe (Covering 3 months data) where we saw that price could make a correction after a prolonged bearish market condition.
2. We identified the prevailing timeframe using the 30 Minutes Timeframe (covering 1 month data) where we saw a bullish price action characterized by higher highs and higher lows.
3. We identified a Chart Pattern known as Wedge pattern that support the Prevailing idea that we envisaged in 30 minutes timeframe which in this scenario, was a buy using the 5 minutes chart (covering a 5 days data)
After these couples of technical analysis, i came up with a decision to open buy positions from the current market price as at the time this idea was published.
NB- This is my own view of the market and doesn't constitute a financial advice. DYOR!
TRADE SAFE!!
SHIB: Bearish Continuation ConfirmedSHIB: Bearish Continuation Confirmed โ Optimal Trend-Following Short Positioning Strategy
SHIB is moving highly accurately in line with the long-term macro downtrend scenario projected in our previous technical calls, maintaining an absolute edge for the bears. The market structure at this juncture is thoroughly broken as the buyers' short-term recovery attempts continuously falter. The repeated emergence of fake breakouts (fakebreak) on the chart serves as clear evidence that buying demand is completely exhausted, successfully trapping late longs ahead of a deeper structural decline.
Based on the visual data from chart , selling pressure is compressing tightly. The price action is currently structuring a brief descending triangle pattern while consistently hugging the underside of the dynamic MA100 moving average line. Being heavily suppressed by this dynamic barrier confirms that the bulls lack the necessary strength to reverse the trajectory, turning this specific cluster into a perfect launchpad to trigger or accumulate trend-following Short positions.
The current technical location secures a massive trading advantage, optimizing the trade with highly elevated risk-to-reward (RR) parameters. Traders can map out direct sell entries within this compressed zone with an exceptionally tight stop-loss placement positioned just above the dynamic MA100 line to protect capital effectively, extending take-profit targets toward the deeper support floors below.
Disclaimer: This is not financial advice, DYOR.
XAI/USDT (4h) Approaching the Apex of a Descending TriangleXAI/USDT is compressing inside a descending triangle on the 4H chart, with price gradually approaching the apex.
A confirmed breakout above the descending resistance could signal a bullish reversal. A breakdown below horizontal support would confirm bearish continuation and open the way for further downside.
ALPINE/USDT (1h) Approaching the Apex of a Falling WedgeALPINE/USDT is compressing inside a falling wedge on the 1H chart, with price moving closer to the apex after a gradual decline.
A confirmed breakout above the descending resistance could signal a bullish reversal. A breakdown below the lower trendline would invalidate the setup and favor further downside.
YB/USDT (1h) Testing Support Inside a Symmetrical TriangleYB/USDT is consolidating inside a symmetrical triangle on the 1H chart. Price has pulled back toward the ascending support after another rejection from the upper trendline.
Holding the lower boundary could lead to another test of descending resistance. A confirmed breakout above the triangle would favor bullish continuation, while a breakdown below support would weaken the structure and open the way for further downside.
SOL/USD: EMA55 Rejection Keeps Downtrend Pointed at 74.10 Swing SOL's stuck in a clean 4H downtrend and the chart's telling the same story it has for the last week. Price is 74.67, sitting in the lower half of the volatility band with EMA21 at 75.62 and EMA55 at 76.53 stacked above as layered resistance. The last confirmed event on the indicator is a bearish BoS at 76.29 from 33 bars back, and every push since has failed to reclaim EMA55 โ the trend backbone's doing its job on the sell side.
Why it matters: the swing high at 79.04 is still open 18 bars later, meaning bulls haven't managed a structural break despite two attempts. Meanwhile the swing low at 74.10 is also still intact, which puts price right on top of the last defended floor. With ATR at 0.92, we're one clean 4H candle away from testing that low, and the band lower at 74.24 is basically kissing it โ a magnet zone.
The setup I'm watching: a 4H close back above EMA55 (76.53) with an ATR-buffered break of the 76.29 BoS level would flip the near-term read and put 79.04 back in play. Absent that, any pop into 75.60โ76.50 is a lower-high test inside the existing downtrend.
Invalidation for the bearish continuation read: a 4H close above 76.53 that holds โ the EMA55 reclaim ends the downtrend argument.
Targets on continuation: 74.10 โ swing low and band lower confluence; 72.20 โ clean air below the floor; 64.04 โ window low if the whole leg unwinds.
Setup: Rejection off EMA55 keeps bearish BoS structure intact; watching for a break of the 74.10 swing low.
Invalidation: 4H close back above EMA55 at 76.53 that holds.
Targets: 74.10 โ swing low and band-lower confluence, first real test ยท 72.20 โ open air once the floor gives way ยท 64.04 โ window low, only relevant if the leg fully unwinds
BTCUSDT: Ascending Channel Confronts Supply ZoneHi!
Pattern: Price is moving inside an ascending channel and has completed a three-drives pattern.
Zone: The market is hitting a major Supply & Demand (S&D) zone at $65,600, showing signs of rejection.
Bias: Bearish. The focus is on short positions aiming for the lower channel support near $62,500, unless a clean breakout above resistance invalidates the move.
Iโm excited to announce that Iโm now a Brand Ambassador for AvaTrade!
0.3208โ0.3242 Support Will Likely Determine the Short-Term Trend
Hello traders,
Follow for more market updates and trading insights.
Hope you all have a great trading day.
-------------------------------------
TRX is currently trading at a key technical area where multiple support and resistance levels overlap. The most important support zone is 0.3208โ0.3242.
As long as this zone holds and buyers step in, higher targets remain on the table.
๐ฏ Key Upside Targets
1st Resistance: 0.3410โ0.3445
2nd Resistance: 0.3657โ0.3756
The main bullish signal will be whether price can break above and establish support within these resistance zones.
๐ Levels to Watch if Support Fails
If the 0.3208โ0.3242 support zone breaks down, the next support areas become important.
1st Support: 0.3080
2nd Support: 1M Chart M-Signal
A breakdown below the 1M chart M-Signal could significantly increase the probability of a medium-to-long-term bearish trend reversal, making risk management essential.
๐ Indicator Analysis
At the moment, the market can be interpreted as being in a short-term consolidation phase, either moving sideways or building a base.
- StochRSI: Entering oversold territory
- OBV: Positioned between the Low Line and High Line
- BSSC: Below the zero line
Key conditions to monitor:
โ
StochRSI forms a bullish golden cross from the oversold zone
โ
OBV breaks above the High Line
โ
BSSC recovers above 0 and maintains strength
If these conditions are met, the probability of a bullish trend reversal increases considerably.
๐ก Buying Strategy
The 1D HA-Low has already risen to around the 0.3208 area. If support is confirmed here, a long-biased approach can be considered.
However, if price falls below the HA-Low, a staircase-style decline may develop. For that reason, scaling into positions remains important.
Under current conditions, gradually accumulating down to 0.3080 appears reasonable. Below that level, additional entries should be considered only after confirming a trend reversal signal.
๐ Selling Strategy
The HA-High and DOM(60) zones can be regarded as short-term take-profit areas.
- Consider scaling out in these zones
- A breakout may lead to a staircase-style advance
- Continue taking partial profits as price moves higher
Every uptrend eventually experiences a correction, so locking in profits along the way is an essential part of risk management.
๐ฐ Medium- to Long-Term Investment Perspective
For investors holding TRX over the longer term, a principal-recovery strategy may be effective.
Selling enough to recover your initial investment and letting the remaining position run can help reduce psychological pressure while maintaining exposure to potential upside.
๐ TRX Market Assessment
In my view, TRX is better suited for active strategic trading than a pure long-term hold.
That said, several factors remain constructive:
- Ongoing demand for stablecoins within the TRON ecosystem
- Expansion efforts into the U.S. market
- Consistent network usage and activity
TRX is particularly sensitive to stablecoin circulation metrics and often shows price action that differs from Bitcoin.
Therefore, traders should not rely solely on BTC's direction. Monitoring TRX-specific flows, on-chain activity, and capital rotation is equally important.
Overall, compared with many altcoins trading near or below their listing prices, TRX still appears relatively attractive from an investment standpoint.
The key level remains 0.3208โ0.3242.
If this support zone holds, the probability of testing higher resistance levels remains open.
-----
Thank you for reading.
Wishing everyone successful trades and strong risk management.
BTCUSD Technical Analysis! SELL!
My dear friends,
BTCUSD looks like it will make a good move, and here are the details:
The market is trading on 64162 pivot level.
Bias - Bearish
Technical Indicators: Supper Trend generates a clear short signal while Pivot Point HL is currently determining the overall Bearish trend of the market.
Goal - 63622
Recommended Stop Loss - 64502
About Used Indicators:
Pivot points are a great way to identify areas of support and resistance, but they work best when combined with other kinds of technical analysis
Disclosure: I am part of Trade Nation's Influencer program and receive a monthly fee for using their TradingView charts in my analysis.
โโโโโโโโโโโ
WISH YOU ALL LUCK
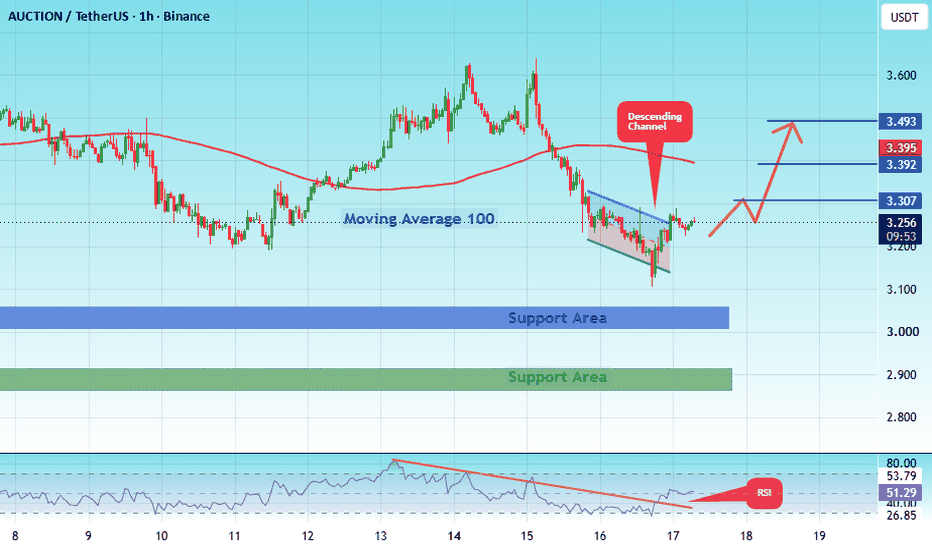
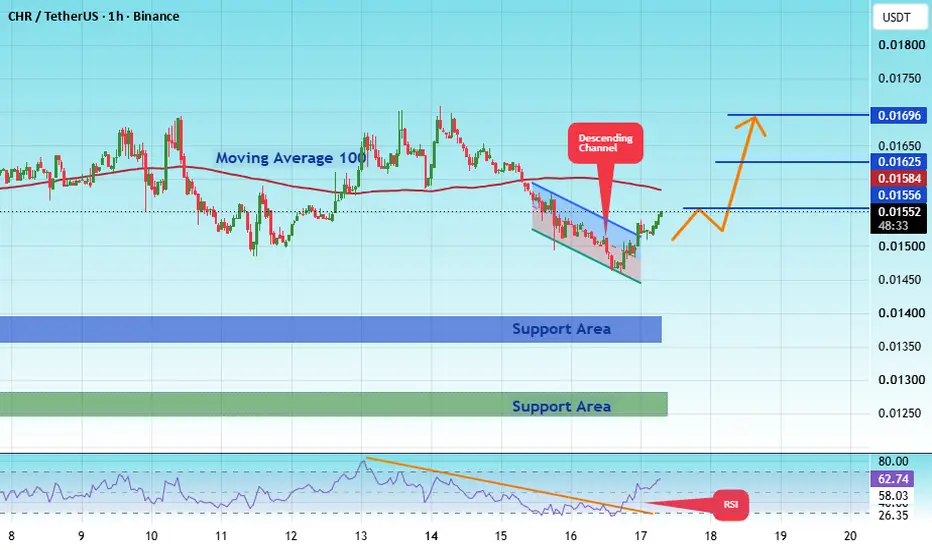
#JASMYUSDT GOOD TIME TO BUY JASMY I MARK THE TARGETS#JASMY
The price is moving within a descending channel on the 1-hour timeframe and has reached the lower boundary. It is now poised for a bounce and is expected to retest this boundary.
The Relative Strength Index (RSI) indicates a downward trend, which is likely to continue given the overbought conditions.
There is a key support zone (in green) at 0.00400. The price has bounced off this zone several times, making it a strong support level.
The price is trending towards the 100-period moving average, which we are approaching. This trend supports an upward move.
Entry Price: 0.00445
Target 1: 0.00454
Target 2: 0.00464
Target 3: 0.00478
Stop Loss: At the resistance zone (in green)
Remember this simple rule: Money management.
Any questions? Please leave a comment.
Thank you.
Trading Roadmap | Classical TA ยท Lesson 12 โ Intro to FibonacciLesson 12 - Introduction to Fibonacci
Difficulty: Intermediate
Fibonacci levels do not predict price โ they offer a structured way to map where pullbacks may pause and where trends may reach. In this final lesson of the course, we tie them into the structure, trends, and confirmation tools you've built through the whole roadmap.
๐ต WHERE THE LEVELS COME FROM
The Fibonacci sequence produces a set of ratios โ 23.6%, 38.2%, 61.8%, 78.6% โ that traders project onto price swings. The 50% level is not a Fibonacci ratio, but it is so widely watched that most tools include it.
Why do these levels matter? Not because markets obey mathematics โ but because enough traders watch the same levels that price can react around them. Treat them as zones of interest, not magnets.
๐ต FIBONACCI RETRACEMENT โ HOW TO DRAW IT
The retracement tool measures how deep a pullback goes relative to the previous swing:
- In an uptrend โ anchor from the swing low to the swing high ; the levels map potential support zones for the pullback
- In a downtrend โ anchor from the swing high to the swing low ; the levels map potential resistance zones for the bounce
Consistency matters more than perfection: pick clear, meaningful swings (the ones you'd mark with the structure skills from Lesson 2 and 3) and anchor the same way every time โ wick to wick is the common choice.
One practical note: depending on which anchor you click first, the tool may print the 0 and 1 labels in reverse. The zones between the levels are what many traders focus on โ the label direction matters less than applying your own method consistently.
- Shallow pullbacks (23.6%โ38.2%) โ can suggest a strong trend where buyers/sellers step in early
- Deeper pullbacks (50%โ61.8%) โ common in healthy trends; often watched for continuation setups
- Very deep pullbacks (78.6%) โ the trend may be in question; many traders demand extra confirmation here
๐ต THE GOLDEN POCKET
The area around the 50%โ61.8% retracement โ with some traders extending it to 65% โ is often called the "golden pocket": one of the most widely watched zones for trend-continuation setups.
It works in both directions. In an uptrend, pullbacks into the zone can find support. In a downtrend, bounces into the zone can meet resistance โ the reaction there may offer a continuation setup in the direction of the larger trend.
In the chart above: after the swing from high to low, the bounce reached the 0.5โ0.618 zone and printed a reaction candle. The pocket acted as resistance โ because the larger trend was down โ and the move lower resumed. Same zone, mirrored logic.
A level alone is not a signal. What many traders look for inside the pocket:
- A reversal candle from Lesson 5 (hammer, engulfing) forming at the zone
- Volume stepping in as price reaches the area (Lesson 9)
- The zone overlapping a prior support/resistance level (Lesson 3)
Two common entry styles:
- Aggressive โ enter on the first clear reaction candle inside the pocket, with a stop beyond the zone
- Conservative โ wait for price to break minor structure in the trend direction before entering
๐ต FIBONACCI EXTENSIONS โ MAPPING TARGETS
Retracements help with entries; extensions can help with exits. Once a pullback holds and the trend resumes, extension levels โ commonly 1.272 and 1.618 โ project where the next leg may reach.
A practical approach many traders use:
- Take partial profit at the 1.272 extension
- Let the rest run toward 1.618, trailing the stop behind structure
Extensions are estimates, not promises โ when price approaches an extension level with fading momentum (Lesson 11's divergence concept), that can be a reasonable place to lighten up.
In the chart above: after the September swing and a deep pullback, the trend resumed and reached the 1.272โ1.618 extension zone. Notice what followed the tag of the extended target โ a sharp drop. Taking partials into extension zones, rather than holding for more, is exactly what this tool is for.
๐ต CONFLUENCE โ WHERE FIB TENDS TO WORK BEST
A Fibonacci level on its own is just a line. Its usefulness often comes from confluence โ when it lines up with things you already learned to read:
- A prior support/resistance level (Lesson 3) sitting inside the golden pocket
- A rising moving average (Lesson 10) crossing through the same zone
- A trendline or channel boundary (Lesson 4) meeting the retracement
- A reversal pattern (Lesson 7) completing at the level
When several independent tools point to the same area, the zone carries more weight than any single line.
In the chart above: the fib level lands inside a horizontal zone that had already acted as resistance earlier โ a prior level flipping into support (Lesson 3). The pullback tagged the overlap, held, and the trend resumed. Two independent tools, one zone.
๐ต COMMON MISTAKES
- Drawing fibs on every minor wiggle โ the tool works best on clear, significant swings
- Switching anchor style (wicks vs bodies) chart to chart, then wondering why levels look off
- Treating a level touch as an automatic entry with no confirmation
- Using retracements against the larger trend โ a 61.8% bounce in a strong downtrend is still a counter-trend trade
- Stacking so many fib drawings that every price is "at a level"
Above: the first mistake in action โ a fib drawn on a minor swing in the middle of a larger trend. The levels are crammed into a few hundred dollars of range and price barely notices them.
Same chart, same tool โ anchored on the major swing instead. The levels now map zones the market actually reacted to. The swing you measure decides whether the tool says anything useful.
๐ณ PRO TIPS
- Fib levels drawn on higher-timeframe swings (daily, weekly) tend to carry more weight than those on 5-minute charts.
- If you can't decide which swing to anchor, you may be forcing it โ the swings worth measuring are usually the obvious ones.
- Mark your fib zone before price reaches it, then let the candles at the zone make the decision. Planning ahead of the touch tends to produce calmer execution than reacting to it.
- This is the last lesson of the Classical TA course โ the strongest setups usually come from combining lessons, not from any single tool. Structure first, confirmation second, indicators and fibs as context.
That wraps the Classical TA course. ๐ If it helped you, drop a comment with the lesson that improved your trading most โ and tell us what course you'd like to see next. ๐ณ
Full Trading Roadmap | Classical TA Course
Trading Roadmap | Classical TA ยท Lesson 01 โ Mastering the Chart
Trading Roadmap | Classical TA ยท Lesson 02 โ Mastering Trends
Trading Roadmap | Classical TA ยท Lesson 03 โ Support & Resistance
Trading Roadmap | Classical TA ยท Lesson 04 โ Price Channels
Trading Roadmap | Classical TA ยท Lesson 05 โ Single Candle Patterns
Trading Roadmap | Classical TA ยท Lesson 06 โ Multi-Candle Patterns
Trading Roadmap | Classical TA ยท Lesson 07 โ Reversal Chart Patterns
Trading Roadmap | Classical TA ยท Lesson 08 โ Continuation Chart Patterns
Trading Roadmap | Classical TA ยท Lesson 09 โ Volume Analysis
Trading Roadmap | Classical TA ยท Lesson 10 โ Moving Averages
Trading Roadmap | Classical TA ยท Lesson 11 โ Core Indicators (RSI, MACD, Stochastic, Bollinger Bands)
Best Regards, BigBeluga ๐ณ
Bitcoin slowly goes upHi traders,
Last week Bitcoin slowly went up making a higher low and higher high.
So we could see more upside into the bearish Weekly BPR, but first price has to break the bearish Daily FVG.
Let's see what the market does and react.
Trade idea: Wait for a close abive the bearish Daily FVG, a small correction down and a bullish change in orderflow on a lower timeframe to trade longs.
This shared post is only my point of view on what could be the next move in this pair based on my technical analysis.
But I react and trade on what I see in the chart, not what I've predicted or expect.
Manage your emotions, trade your edge!
Eduwave
#SLPUSDT Ready to go higher#SLP
The price is moving within a descending channel on the 1-hour timeframe and has reached the lower boundary. It is now poised for a bounce and is expected to retest this boundary.
The Relative Strength Index (RSI) indicates a downward trend, which is likely to continue given the overbought conditions.
There is a key support zone in green at 0.000452. The price has bounced off this zone several times, making it a strong support level.
The price is trending towards the 100-period moving average, which we are approaching. This trend supports an upward move.
Entry Price: 0.000520
Target 1: 0.000536
Target 2: 0.000554
Target 3: 0.000577
Stop Loss: At the resistance zone in green
Remember this simple rule: Money management.
Any questions? Please leave a comment.
Thank you.
#ENAUSDT Ready for a Breakout? Analysis of a Long Accumulatio#ENA
The price is moving within a descending channel on the 1-hour timeframe and has reached the lower boundary. It is now poised for a bounce and is expected to retest this boundary.
The Relative Strength Index (RSI) indicates a downward trend, which is likely to continue given the overbought conditions.
There is a key support zone (in green) at 0.0582. The price has bounced off this zone several times, making it a strong support level.
The price is trending towards the 100-period moving average, which we are approaching. This trend supports an upward move.
Entry Price: 0.0729
Target 1: 0.0768
Target 2: 0.0809
Target 3: 0.0863
Stop Loss: At the resistance zone (in green)
Remember this simple rule: Money management.
Any questions? Please leave a comment.
Thank you.
#DOTUSDT Ready to go higher#DOT
The price is moving within a descending channel on the 1-hour timeframe and has reached the lower boundary. It is now poised for a bounce and is expected to retest this boundary.
The Relative Strength Index (RSI) indicates a downward trend, which is likely to continue given the overbought conditions.
There is a key support zone in green at 0.800. The price has bounced off this zone several times, making it a strong support level.
The price is trending towards the 100-period moving average, which we are approaching. This trend supports an upward move.
Entry Price: 0.832
Target 1: 0.846
Target 2: 0.856
Target 3: 0.870
Stop Loss: At the resistance zone in green
Remember this simple rule: Money management.
Any questions? Please leave a comment.
Thank you.