Long
Long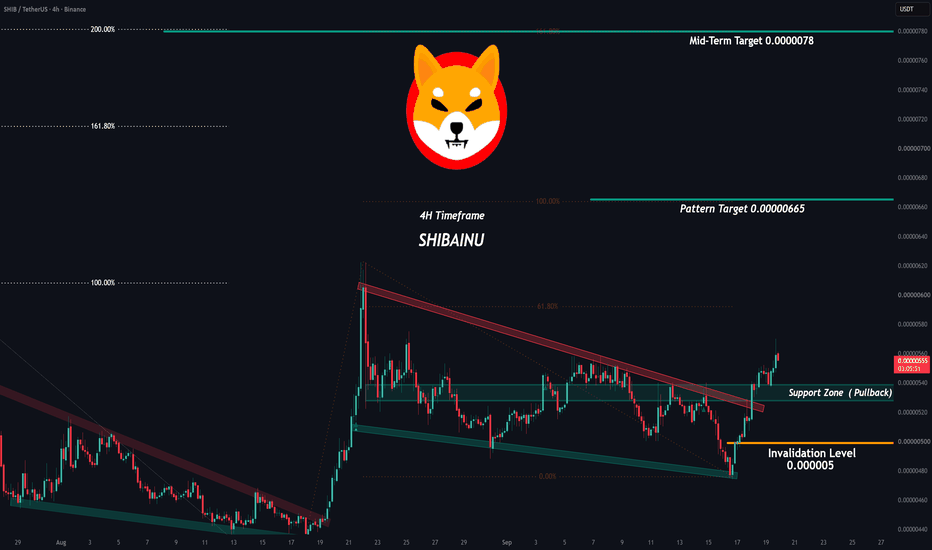
 Short
Short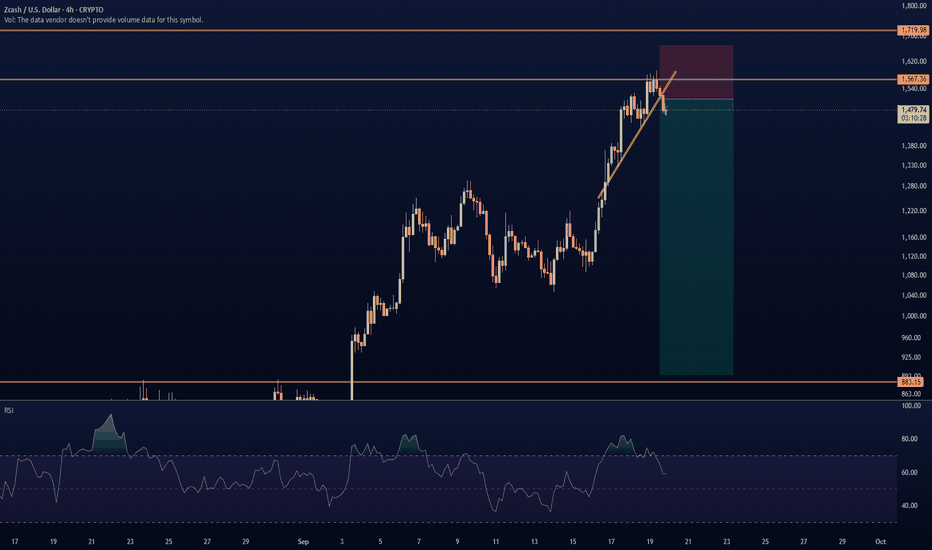
 Long
Long
 Long
Long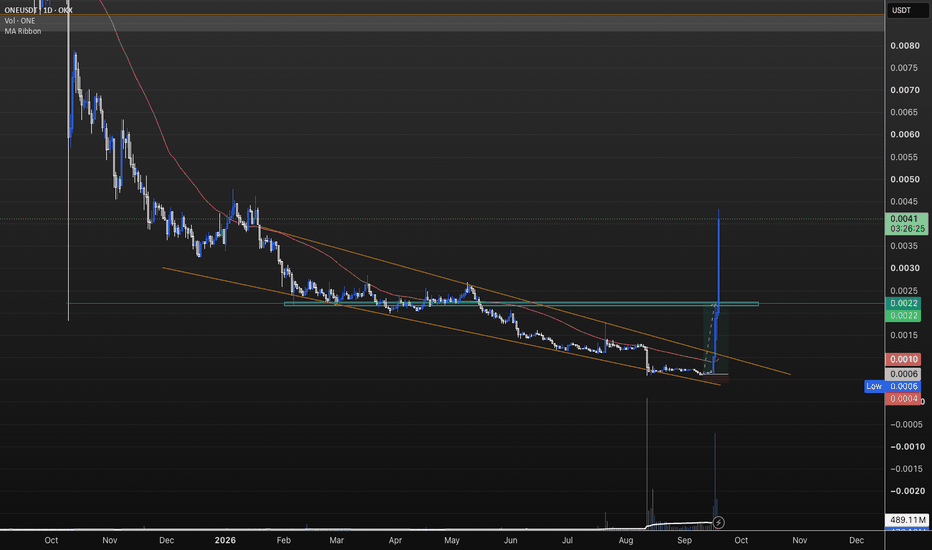
VVV/USDC, Buyer Dominance and the Anatomy of a Coiled SpringMost traders spend their days chasing candles. They wait for the green bar, they FOMO in at the top, they panic-sell the wick. They're reactive. They're late. They're the liquidity.
The traders who actually win the ones who build positions before the crowd even knows a setup exists they read a different language. They read the order book. They read imbalance. They read the silence between the candles, where the real story is being written.
And right now, on VVV/USDC over on Coinbase Advanced Spot, that story is screaming.
The Setup: Numbers That Don't Lie
Let's start with the headline, because it deserves to be said plainly:
Order Book Imbalance: +98.8%
Read that again. Ninety-eight point eight percent. That's not a tilt. That's not a lean. That's a flood. Displayed buy-side liquidity is so overwhelmingly dominant that the sell side is essentially a ghost town. Almost every dollar of visible liquidity on the book right now belongs to buyers.
In all my time watching order flow, readings like this are rare. They don't sit around. They don't wait for you to finish your coffee and decide. They resolve — violently, and usually upward.
Price > 200 EMA ✅
Price > 200 SMA ✅
Order Book Imbalance: +98.8% (≥30% required)
Volume Spike: ≥2.0x ✅
Trend: Neutral (breakout pending)
Entry Price: 27.0334
Take-Profit Target : 28.11473 (+4.00%)
Session: US (16:00–21:00 UTC)
Why This Isn't Just a Number It's a Story
Let me walk you through what's actually happening here, because the why matters more than the what.
First the trend is not fighting us. Price is trading above both the 200 EMA and the 200 SMA on the daily. That's the macro line in the sand. When an asset holds above both of these, the path of least resistance is up. It's not a guarantee nothing is but it stacks the deck. You're swimming with the current, not against it.
Second the volume spike confirms participation. A breakout without volume is a mirage. But here, we're seeing a ≥2.0x spike. That's not retail noise. That's size. That's someone with real capital deciding that this is the level where they want in.
Third and this is the part that gets me excited the 24h change is only -0.2%.
Think about that for a moment.
Nearly 100% buy-side dominance. A confirmed volume spike. Price sitting above every major moving average. And yet price hasn't moved. It's flat. Down a fraction of a percent.
That's not weakness. That's not indecision. That's absorption. That's a coiled spring.
When you see extreme imbalance without price movement, it means someone is deliberately holding the price down while they fill their bags. They don't want the candle to run yet. They're not done buying. Every seller who steps in gets eaten. Every ask gets absorbed. The book gets thinner on the sell side with each passing hour.
And then when they're ready the spring releases.
The breakout is already confirmed. The move just hasn't fully expressed itself yet. That's the window. That's where you want to be.
That's not a weakness in the signal. That's a distinction. The Whale doesn't fire on noise. It fires when the footprint is unmistakable when the accumulation pattern, the imbalance, and the volume spike align in a way that's characteristic of large players positioning themselves.
When whales load up, they don't slam market buys and spike the chart. That would tip their hand. Instead, they work patiently iceberg orders, hidden size, letting the book absorb their accumulation while price stays pinned. The fingerprint of that behavior is exactly what we're looking at here.
+98.8% imbalance with a -0.2% daily change is not a coincidence. It's a signature.
Price holding above 27.0334 if buyers defend this zone, the structure stays intact
Volume expansion on the push toward 28.11473 real breakouts need fuel
The imbalance staying elevated if it collapses, the thesis weakens fast
Reaction at the target if volume keeps surging past it, I'll consider scaling rather than exiting entirely
Whether the "Neutral" trend classification flips bullish that would be the final confirmation
The Bigger Lesson
I want to leave you with something more valuable than a single trade idea.
The reason setups like this work isn't magic. It's not luck. It's not a secret indicator. It's reading the market at the level where the real decisions are made the order book, the volume, the imbalance.
Most people look at a chart and see a squiggly line. The traders who consistently win look at the same chart and see a story: who's buying, who's selling, who's hiding, and who's about to be caught off guard.
VVV/USDC right now is telling a very specific story. Nearly 100% of the visible liquidity is on the buy side. Volume is spiking. Price is coiled above every major average. The breakout is confirmed. And the crowd hasn't arrived yet.
The best trades are the ones you see before everyone else does.
Stay sharp. Read the book, not just the candle. And remember patience isn't passive. It's the discipline to wait for setups where the imbalance, the volume, and the trend all align.
This is one of those setups.  Long
Long
 Long
Long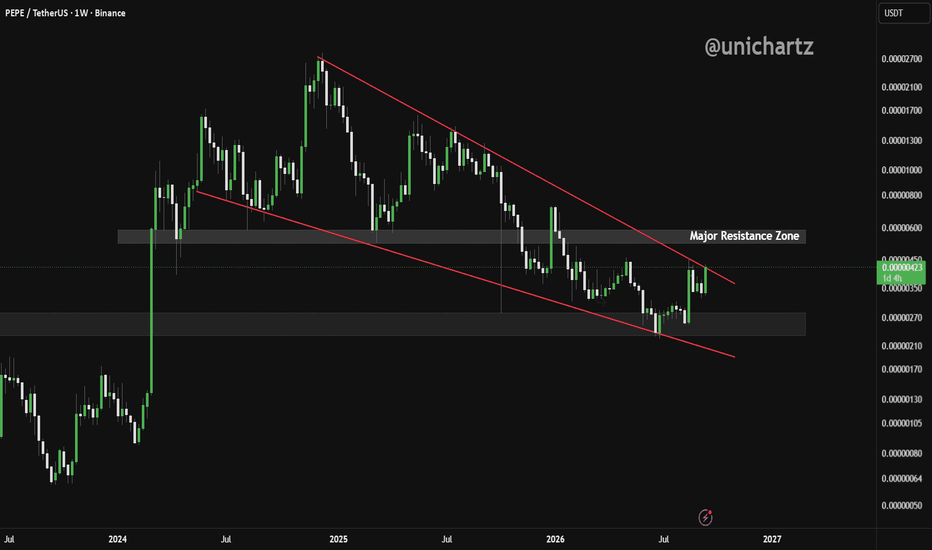
 Long
Long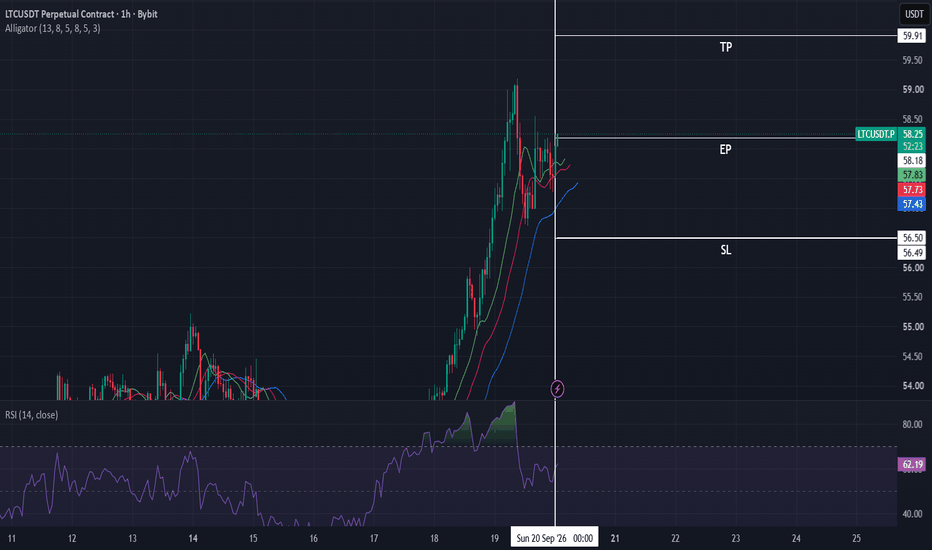
 Short
Short
Short 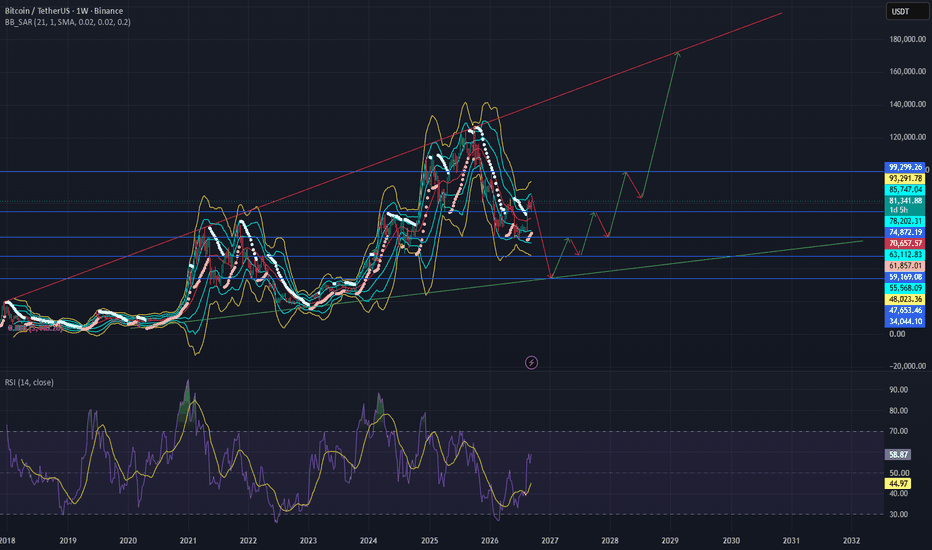
Short 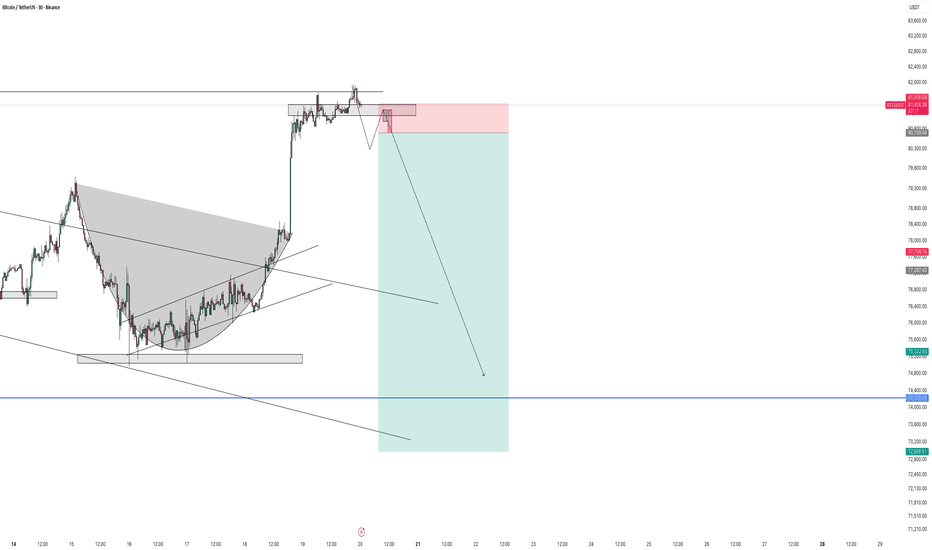
Short 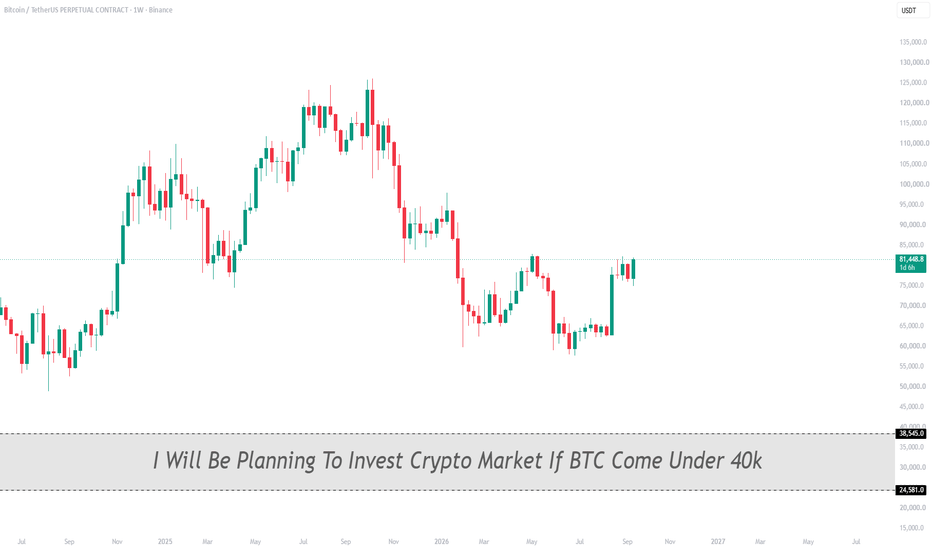
 Long
Long
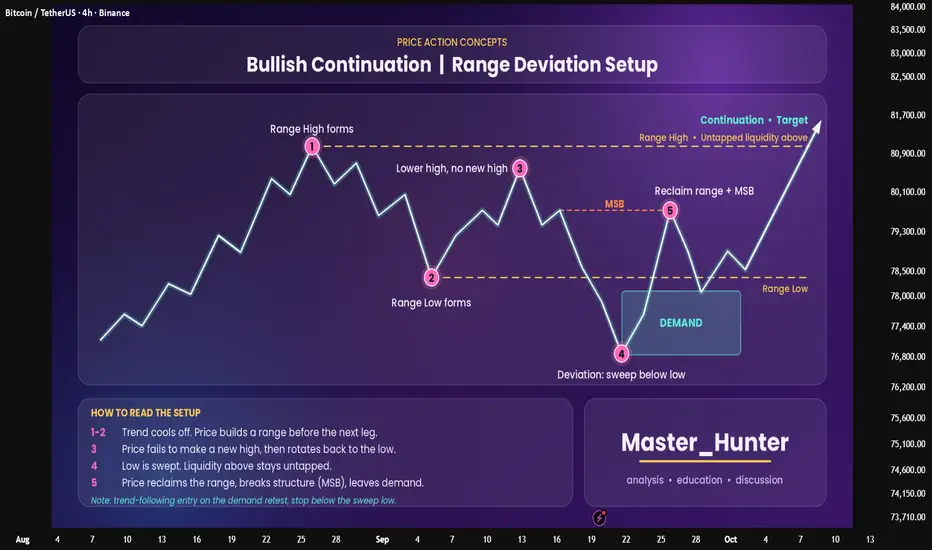
Bullish Continuation | Range Deviation SetupTrends don't move in a straight line. They pause, build a range, and often trap traders on both sides before the next leg. This setup shows how to read that pause and trade it with structure.
The 5 steps
Range High : the trend cools off and price prints a clear high.
Range Low : price rotates down and defines the bottom of the range.
Lower High : price fails to make a new high and drops back to the low. Buyers look weak here, and that's the trap.
Deviation (liquidity sweep) : price pushes below the range low and triggers stops. Liquidity above the range stays untapped.
Reclaim + MSB + Demand : price closes back inside the range and breaks the last lower high (Market Structure Break). The move leaves a Demand zone behind.
Why it works
The sweep below the low grabs sell-side liquidity. Once the low is reclaimed, the trapped sellers fuel the move up. The untapped liquidity above the range high becomes the natural target.
How to trade it
Entry : retest of the Demand zone after the MSB.
Stop-loss : below the sweep low.
Targets : scale out in stages: mid-range, then range high, then beyond it.
Confirmation : candle close back inside the range, plus volume or momentum shift.
Common mistakes
Entering on the sweep before price reclaims the range.
Trading it against a higher-timeframe downtrend.
Skipping the MSB and buying the first bounce.
This works on forex, crypto and indices, on any timeframe. Always confirm with higher-timeframe context.
Educational content only, not financial advice.
Where do you place your stop on a deviation setup: below the sweep low, or below the demand zone? Share your view and your own examples in the comments, and let's discuss. Education 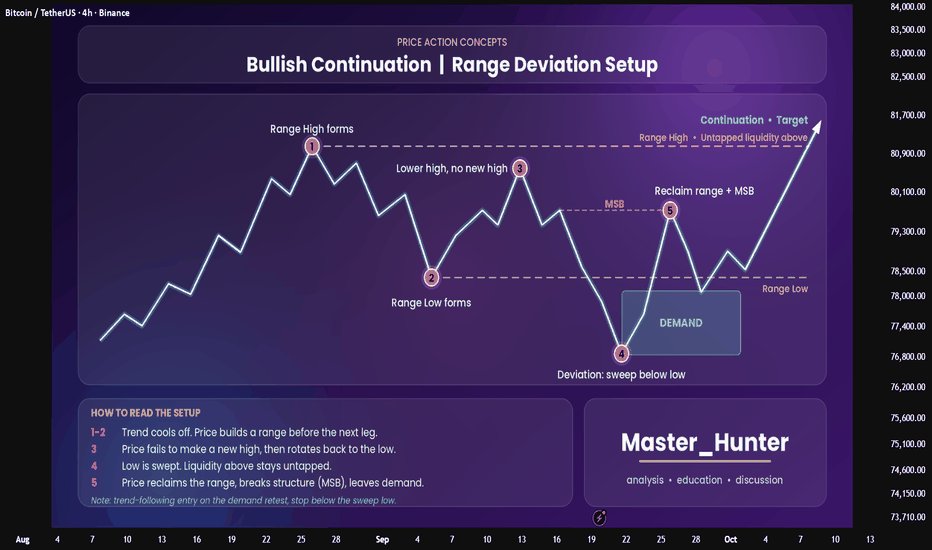
crypto isn’t just tradingThe Crypto Income Map: How Capital Actually Works in Digital Assets
Crypto is no longer just a market where you buy Bitcoin and wait for the price to rise.
A large digital-asset economy has developed around trading, lending, staking, infrastructure, software, liquidity, information, attention and speculation.
Where can economic value actually be captured in crypto?
The answer is broader than most people realize.
But there is an important distinction.
Not every crypto income stream is passive, not every yield is sustainable, not every reward is profit and not every strategy requires capital.
Some require skill, technology, time and attention.
Inside the Crypto Economy: Where Value Is Created.
1. Market Speculation
The most obvious category is also one of the most competitive.
Traders attempt to profit from price movements, volatility, liquidity imbalances or relative mispricing.
This includes:
* Spot trading * Swing trading * Scalping * Perpetual futures * Options * Funding-rate strategies * Basis trades * Triangular arbitrage * CEX/DEX arbitrage * Algorithmic and bot trading * Copy trading
The underlying engine is simple:
Capital is exposed to market risk in exchange for potential trading returns.
But the risk profile changes dramatically between strategies.
Spot trading generally avoids liquidation from leverage, while perpetual futures introduce funding costs and liquidation risk.
Options add another layer: volatility, time decay and the interaction between price and implied volatility.
Arbitrage strategies attempt to capture price differences rather than simply betting on direction, but execution, fees, liquidity, counterparty risk and technology can determine whether an apparent spread is actually profitable.
@currencynerd lesson:
A strategy that looks market-neutral on paper can still contain substantial operational or financial risk.
2. Capital Allocation
Crypto also has a long-duration investment layer.
Instead of repeatedly trading price movements, investors can allocate capital toward assets or companies they believe may appreciate over longer periods.
This includes:
* Core portfolio holdings * Seed and private rounds * ICOs, IDOs and IEOs * Governance-token accumulation * Index and basket strategies * Angel investing in crypto start-ups.
Here, the primary objective changes from:
“Where is price going next?”
to:
“What could this asset, network or company become?”
3. On-Chain Yield
Decentralized finance created another way for capital to potentially generate returns.
Examples include:
* Native staking * Liquid staking * Restaking * Lending and borrowing spreads * Liquidity provision * Yield farming * Delta-neutral vaults * Stablecoin strategies * Structured products
The critical question here is:
Where does the yield actually come from?
It may come from transaction fees, borrower interest, trading fees, token emissions, funding payments. Or some combination of these.
A yield paid from genuine economic activity is fundamentally different from a reward primarily funded by newly issued tokens and even apparently attractive yields can contain smart-contract risk, liquidation risk, depen risk, governance risk, counterparty exposure or impermanent loss.
Yield is not the same thing as free money.
4. Incentive Hunting
Crypto also created an economy around rewarding early users.
This includes:
* Airdrop farming * Testnet participation * Mainnet activity * Points programs
Referral programs * Node and DePIN rewards * Quest and loyalty platforms
The participant may contribute capital, transactions, liquidity, attention or network activity in the hope of receiving future rewards.
But there is a crucial distinction:
A reward expectation is not guaranteed income.
The economic model is therefore closer to speculative compensation for early participation than traditional passive income.
5. Attention & Influence
One of the most interesting developments in crypto is that information itself can become an economic asset.
People can potentially monetize:
* Market research * Writing * X/Twitter content * YouTube * Newsletters * Creator campaigns * Bounty platforms * Data labeling * Community reputation * Research-for-hire
Platforms and protocols increasingly compete for attention.
That creates a market where distribution can become valuable.
Someone with no large trading account can potentially create economic value through analysis, education, research, media or community building.
6. Information Markets
Another emerging category is the market for forecasts.
Participants can express views on:
* Crypto prices * Sports * Politics * Macroeconomic outcomes * Other measurable events
There can also be:
* Forecasting tournaments * Market making * Cross-market arbitrage
These markets turn information and probability assessment into something that can be traded.
7. Computational Mining
Before much of today's DeFi and token ecosystem existed, crypto already had a physical economy. Mining remains an important example.
Participants can operate:
* ASIC miners * GPU systems * Mining pools * Solo-mining operations * DePIN hardware
The business model is fundamentally different from buying a token.
Now the operator is managing:
hardware + electricity + infrastructure + network economics + asset prices
For miners, electricity cost can be particularly important.
A machine can produce coins while simultaneously destroying economic value if operating costs exceed revenue.
8. Digital Ownership
NFTs created another market around digital ownership.
Potential income models have included:
* Flipping * Minting * Lending * Fractional markets * Royalties * Collection creation
But this is one of the clearest examples of why activity should not automatically be confused with sustainable income.
The opportunity exists but so does significant market and liquidity risk.
9. Virtual Economies
Blockchain-based gaming introduced economic models around digital assets.
These have included:
* Play-to-earn * In-game asset trading * Asset farming * Guild scholarships * Tournament prizes
The broader experiment is fascinating because it attempts to connect digital activity with financial ownership.
10. Professional Expertise
You don't necessarily need to trade crypto to earn from the crypto industry.
Businesses need:
* Smart-contract developers * Security researchers * Auditors * Designers * Video editors * Growth specialists * Marketers * Business-development professionals * Community managers * Support staff
This turns crypto into an industry to work in , rather than merely an asset class to speculate on.
For many people, this may be the most direct relationship between crypto and income:
sell a valuable skill to the industry.
11. Protocol Creation
The next layer is entrepreneurship.
People can build:
* dApps * Protocols * Trading tools * Analytics platforms * Bots * Wallets * Infrastructure * AI × crypto applications * Crypto SaaS
Here, the economic model changes again.
You are no longer simply trying to extract returns from an existing market.
You are attempting to create something that the market will pay to use.
12. Decentralized Organizations
Decentralized organizations have also created new ways to participate economically.
Examples include:
* Contributor roles * Governance participation * Bounties * Ambassador programs * Moderation
Compensation can take different forms depending on the organization and program.
The underlying idea is simple:
contribute useful work → receive economic or reputational value.
13. User Acquisition
Another model is distribution.
Participants can earn through:
* Exchange referrals * Platform affiliate programs * Wallet referrals * App referrals * Creator partnerships
The product already exists.
Your role is to introduce users to it.
The economics therefore resemble traditional affiliate marketing, but inside a crypto-native ecosystem.
14. Network Infrastructure
Perhaps the least visible category is also one of the most important.
Crypto networks require infrastructure.
That includes:
* Validators * RPC nodes * Archival nodes * Indexers * Oracles * Storage providers * Bandwidth providers * Compute providers * Sequencers * Relayers
This is the picks-and-shovels layer of digital assets.
Instead of betting on which token wins, infrastructure operators can potentially earn by providing the services networks and applications require.
@currencynerd bigger picture for @TradingView community :
The crypto economy can therefore be viewed through four broad resources:
CAPITAL
Trading, investing, lending, staking, liquidity provision and arbitrage.
SKILL
Programming, research, trading, analysis, security, design and professional services.
ATTENTION
Content, communities, referrals, reputation and distribution.
INFRASTRUCTURE
Hardware, nodes, compute, storage, indexing and network services.
And the most powerful businesses often combine several.
thank you for your attention to the matter...
put together by : Pako Phutietsile as @currencynerd Education 
 Short
Short
A wider stop made our results look better and our edge disappearStop width is usually argued as a matter of taste. Tight stops for people who like precision, wide stops for people who like breathing room, and somewhere in the middle a compromise nobody can defend with a number.
It is not a matter of taste. Stop width sets two things at once, and they move in opposite directions.
The first thing it sets is your bill
If your size comes from your risk, and it should, then size is the risk budget divided by the stop distance. Halve the stop and you double the position. Double the position and you double every fee you pay on it.
Written as a fraction of the risk you took, the fee is simply the round trip cost divided by the stop distance.
On this sample, with a stop measured in ATR and a round trip cost of 0.0967 percent read off thirty five real fills:
half an ATR of stop costs 0.070 R in fees one ATR costs 0.035 R two ATR costs 0.018 R three ATR costs 0.012 R
Nothing about the trade improved when the stop widened. The invoice shrank, that is all.
So we swept it, with a control
Five thousand nine hundred and ninety stamped four hour setups across seventy three symbols. Each one replayed forward twelve bars, which is forty eight hours, against every combination of stop width and target distance. Bars where price could have touched both sides were resolved as losses, which is the conservative choice.
Then the same grid was run on random entries, on the identical bars. That is the part that matters. A grid with no control tells you what the market did. A grid with a control tells you what you did.
The widest stops produced the best numbers
At a three ATR stop with a one and a half ATR target, the setups netted plus 0.077 R per trade after fees. That is the best cell on the board, and it would be the obvious conclusion of any sweep run without a control.
The random entries on those same bars netted plus 0.075 R.
The difference, which is everything the selection contributed, is plus 0.002 R.
And the tightest stops produced the worst numbers, holding the whole edge
At half an ATR of stop with a one and a half ATR target, the setups netted plus 0.019 R. Ten times worse than the wide cell.
The random entries on those same bars netted minus 0.159 R.
The difference is plus 0.177 R, and it runs to plus 0.221 R at wider targets. The gap between what we did and what chance did is at its largest exactly where the fee is heaviest and the headline result is at its worst.
The pattern is monotone. Half an ATR carries an edge between plus 0.02 and plus 0.22 R depending on target. One ATR carries plus 0.03 to plus 0.10. By two ATR it is inside noise. By three ATR it is zero to plus 0.03, and the cell that looks most profitable is the cell where the method contributed nothing.
Why that happens
A wide stop is a low information trade. Give price enough room and almost everything reaches the target before it reaches the stop, so the win rate climbs toward certainty and the reward per win falls to match. The outcome stops depending on which bar you entered, which is another way of saying it stops depending on you.
A tight stop puts the decision where the information is. It also puts your money in front of the fee, which is why the honest version of the finding is uncomfortable: the width that shows your edge is the width that charges you the most to use it.
What this does not license
It does not license widening a stop to make a backtest positive. That cell pays the same to a coin flip.
It does not license tightening a stop to a number this grid likes. A stop belongs beyond the structure that invalidates the trade, and no grid can see that structure. A stop chosen because a spreadsheet liked it, sitting in open space with nothing behind it, is the most common way to be right about arithmetic and wrong about the trade.
The caveats, in full
In sample. One horizon of forty eight hours. A chosen grid of stops and targets. Ambiguous bars counted as losses. No costs modelled beyond the round trip fee, so funding and slippage are absent. And plus 0.019 R on the best tight cell is not a strategy, it is a measurement with a control attached.
Observations, not recommendations. Education 
 Long
Long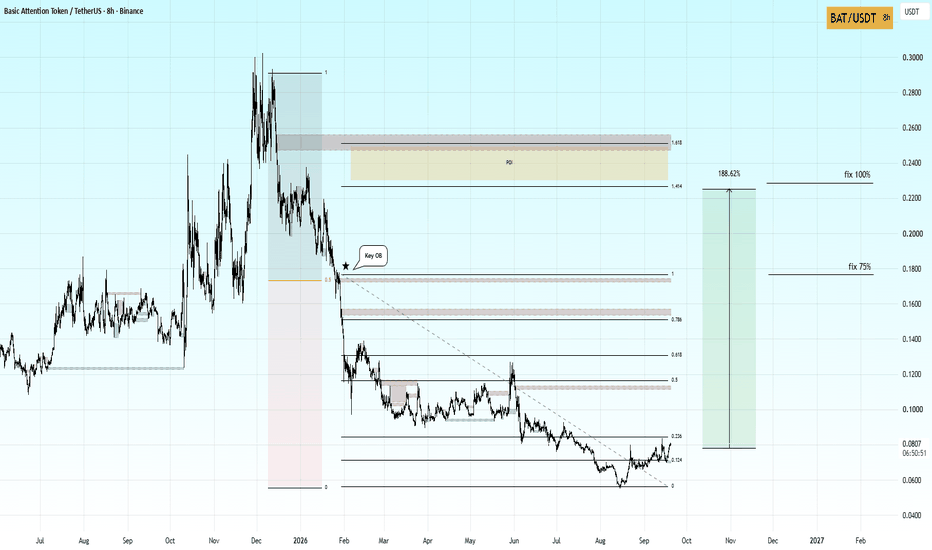
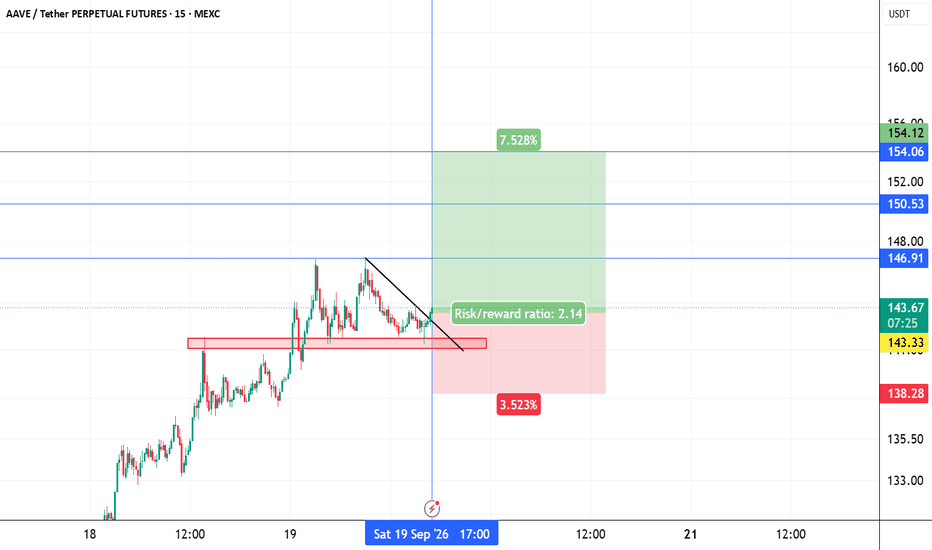
aaveusdt longINSTRUCTIONS TO READ AND TO FOLLOW:
Entry point: yellow
Stop loss: red
Take profit: green or blue
👉Leverage x 5-10-20 for crypto
👉Leverage x 20-50-100 for commodities, stocks, indices, and forex
👉Margin 1-5% max:
This limits your maximum loss to 5% and guarantees that you retain 95% of your portfolio in the event of a stop-loss.
🔥🔥🔥🔥🔥🔥🔥🔥🔥🔥🔥🔥🔥🔥
ALWAYS PRACTICE RISK AND MONEY MANAGEMENT:
🔥🔥🔥🔥🔥🔥🔥🔥🔥🔥🔥🔥🔥🔥
👉Invest a maximum of 5% on any trade or across all your trades.
Invest only what you can afford to lose, as no one is in control of the market.
👉I repeat: this limits your maximum loss to 5% and guarantees—or rather, allows you to retain—95% of your portfolio in the event of a stop-loss.
🎖️🎖️🎖️🎖️🎖️🎖️🎖️🎖️🎖️🎖️🎖️🎖️🎖️🎖️🎖️🎖️🎖️
LEARNING REMAINS THE BEST SOLUTION
🎖️🎖️🎖️🎖️🎖️🎖️🎖️🎖️🎖️🎖️🎖️🎖️🎖️🎖️🎖️🎖️
👉Learning from professionals remains the best solution: it enables you to understand signals, question them, and form your own opinion, as well as plan ahead should the signal provider be absent or inactive. In short, learning to trade grants you freedom and autonomy, making you responsible for both your gains and your losses.
👉Our analyses are primarily based on:
breakouts: two trend lines (ascending and descending) and a line indicating a horizontal breakout.
chart patterns: shoulders and head, triangle parttern, elliott impulse, etc etc.
We don't always have the time to track them at all times or to represent them visibly, given the numerous signals, the number of channels to manage, and especially because of the often rapid pace of market movements.
indicators: We associate at least two indicators with this technique.
👉considering the potential market risks and the likely short-term and long-term profits, we use specific indicators, often setting 3 or more take profit levels
👉depending on your psychological state, your beliefs, your goals or intuitions, you can close the position before or after the take profit orders indicated by the green lines if you are personally satisfied; the same applies to stop loss orders
👉Indeed, there are good days in trading and also bad days. No one can promise to win every trade, and like all traders worldwide, we also experience stop-loss orders. However, we win more than we lose and remain positive.
👉We must stay positive, clear-headed, and humble.
We must stay courageous and, above all, prudent regarding market reversals that no one can control
👉we cannot provide all instructions or all trades here on this channel.
such as:
⚡Move your stoploss
⚡Put B.E (break even)
⚡Add an additional take-profit
⚡Add a trailing stop
⚡re-entering the trade at the same entry point or lower.
⚡recovery signals provided in the event of—or following—a stop-loss (SL) hit.
⚡personalized discussions, instructions, and answers.
⚡revealing our high-performance indicators and teaching you how to configure and use them.
Good luck to us all, and may God guide us. Amen.  Long
Long