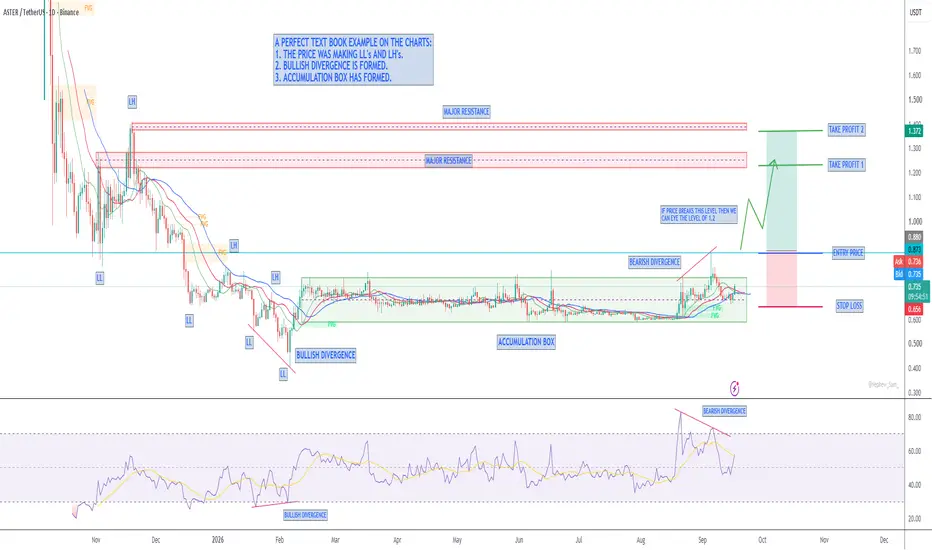
ASTER — Textbook Accumulation Meets Fundamentals- Breakout SetupASTER/USDT is printing one of the cleaner textbook reversal structures on the daily chart, and it lines up almost perfectly with the token's first TGE anniversary (17 Sep 2025).
Here is the sequence the market has walked through, step by step:
1. Exhaustion of the downtrend. From the November highs, price carved a series of lower lows and lower highs — a healthy, orderly markdown. This is the phase where late longs are flushed and supply is transferred to stronger hands.
2. Bullish divergence at the lows. As price pushed to fresh lows into February, the oscillator refused to confirm — momentum was rising while price was falling. That classic bullish divergence is typically the first tell that sellers are losing control.
3. Accumulation. Since February, price has traded sideways in a well-defined accumulation box between roughly 0.60 and 0.74. Volatility compressed, the moving averages coiled and flattened, and the range tightened — the signature of quiet distribution being absorbed before an expansion move.
4. On the brink of breakout. Price is now pressing the upper boundary of the box and has reclaimed the fast MAs. A daily close and hold above the entry trigger would confirm the range break and open the path toward the major resistance shelf.
One honest caveat: a short-term bearish divergence has formed on the recent local high (visible on both price and the oscillator). That argues for patience — I want confirmation above the trigger rather than front-running the box. If the breakout fails and price loses the range, the structure is invalidated and the thesis is off the table until it rebuilds.
FUNDAMENTAL BACKDROP
The technical setup does not exist in a vacuum — the fundamental tape for ASTER is unusually constructive:
What Aster is: a multi-chain perpetuals DEX (spot + perps across BNB Chain, Ethereum, Solana and Arbitrum) built from the 2024 merger of Astherus and APX Finance. It has positioned itself as a direct challenger to Hyperliquid, with hidden orders, MEV-resistant execution, stock/RWA perpetuals and yield-bearing collateral. It is backed by YZi Labs (formerly Binance Labs).
Aggressive deflationary tokenomics. Since the June 2026 overhaul, up to 99% of daily platform fees are routed into ASTER buybacks for stakers, with a matching burn from reserves — a self-reinforcing loop where higher trading volume directly tightens supply. Cumulative burns have run into the hundreds of millions of tokens.
Supply overhang removed. On 1 Sep 2026, the team extended the cliff on its 400M-token allocation (5% of supply) by a full year to 17 Sep 2027. Tokens that many feared would begin unlocking this month are now locked for another year — a materially cleaner near-term supply path than most peers carry.
Product expansion. The Aster Chain L1, on-chain governance, staking, and RWA market growth continue to broaden the fee base — which, under the current model, feeds directly back into buyback pressure.
Net read: strong deflationary mechanics plus a removed unlock overhang are exactly the kind of fundamental tailwinds that convert a technical accumulation into a sustained trend.
TRADE PLAN
Parameter Level
Entry (on confirmed breakout) ~0.873
Take Profit 1 ~1.20
Take Profit 2 ~1.372 (major resistance)
Stop Loss ~0.656 (below accumulation box)
Execution notes:
Trigger the long only on a decisive daily close and hold above ~0.873; avoid anticipating the box break given the local bearish divergence.
Reclaiming and holding this level opens the door to the 1.20 shelf, with 1.372 as the extended target into major resistance.
Scale out partials at TP1 and move stop to breakeven to lock in a risk-free runner toward TP2.
Invalidation is clean: a breakdown and daily close below the box lows negates the setup.
Not financial advice. This is a personal analysis shared for educational purposes — always do your own research and manage risk according to your own plan.  Long
Long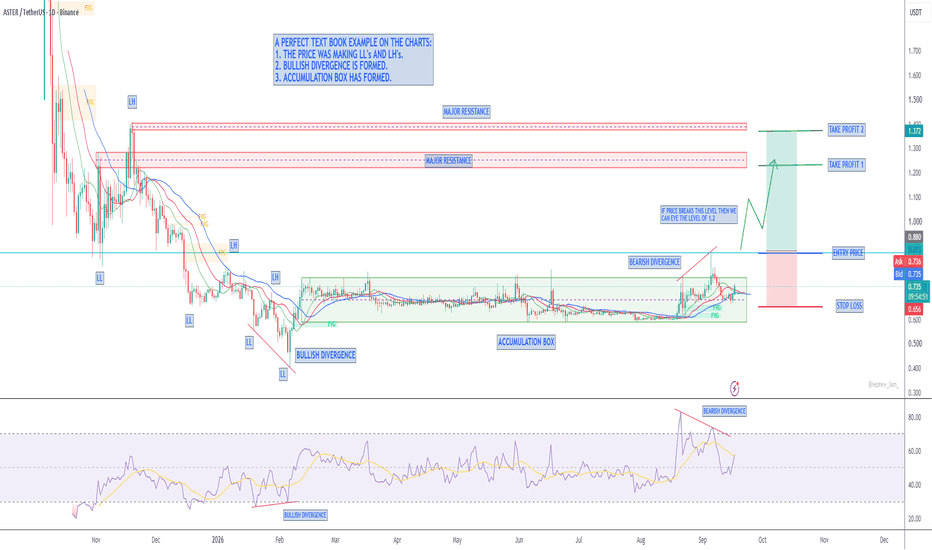
ETH Stuck Between $2,451 and $2,500, Who Blinks First?Hey traders, quick ETH check because this chart just wanted to keep the drama going. 🚀 ETH ripped from around $1,900 up toward $2,500, then instead of settling into that garage I mentioned last time, it's now sliding back down and testing the fast SMA directly, currently sitting almost exactly on top of it.
Right now price is at $2,439.22, down about 0.14% on the session, and it's basically glued to the fast SMA at $2,439.14. That's about as tight a squeeze as you'll see between price and a moving average, like the candle is trying to hide behind the line. Above, $2,480 is now the resistance to watch, the level buyers need to reclaim to get this thing moving again after that rejection from the highs.
⬇️ Below, $2,400 is still the bounce floor, and it's held every test so far even with this latest pullback. RSI and MACD are on the chart doing their thing in the background, but the real story here is still price fighting it out around these two levels.
So, what am I planning to do? 🎯 If ETH holds this $2,439 SMA and buyers step back in, I'm watching for a reclaim back above $2,480 before getting excited about longs, ideally from a retest zone around $2,440 to $2,450. Stop goes under $2,400 since that's the level that's actually done the defending, not a number I just like the look of.
First target on a reclaim is that $2,480 resistance, and if it clears with some follow-through, I'd stretch toward $2,500 to $2,510 next. The long-term SMA is still way down near $2,142.74, so there's a lot of empty space below if sellers take this seriously, and I'd rather sit out than try to be a hero catching that fall. A clean loss of $2,400 flips my bias, and I'd start looking at shorts back toward that lower SMA zone instead.
Long story short, for now I'm watching $2,439 and $2,480 do their little tug of war. ⚔️ Price sitting right on the SMA like this usually means a decision is close, so I'm not forcing anything until one side actually wins.
👀 How's everyone else seeing this, buying the SMA test here or waiting for a real reclaim above $2,480 first?
Disclaimer: Trading crypto involves substantial risk, and this is only my personal read of ETH's structure, not financial advice. I always define invalidation before entering, size positions carefully, and accept that price can do something different from my base case. NEAR — Long-Term Accumulation + AI & Chain AbstractionHi all!! hope all good ;-)
NEAR — Long-Term Accumulation + AI & Chain Abstraction 🚀
NEAR is increasingly positioning itself beyond a traditional Layer 1, with the ecosystem now centered around AI agents, Chain Abstraction and cross-chain execution. NEAR Intents is designed to let users and autonomous agents move assets across multiple chains without manually dealing with bridges, gas or wallet switching.
📊 Technical Structure
Current price: ~$2.86
Major support: ~$1.82
Structural support: ~$1.00
Key resistance: ~$3.80
Breakout zone: ~$5.40
Major target: ~$7.90–8.00
The chart is particularly interesting because NEAR has spent a long period moving through a large accumulation/base structure after the massive 2024–2025 decline.
More recently, price has started creating higher lows, while the long-term descending trendline is being challenged.
The important transition is therefore:
$1.00 → $1.80 → $2.50 → $2.85 → $3.80
A decisive reclaim of $3.80 with expanding volume would be an important structural confirmation. Above that, the chart opens considerably more room toward $5.40 and eventually $7.90–8.00.
🤖 Why NEAR is interesting fundamentally
NEAR's current strategy is heavily focused on the agent economy: AI agents that can interact with assets, execute transactions and operate across different blockchains.
The project combines:
NEAR Intents → cross-chain execution
Chain Signatures → smart contracts controlling assets across other chains
NEAR AI → private/verifiable AI inference
Sharding → high-throughput blockchain infrastructure
AI agents → autonomous economic activity
NEAR currently states that Intents has processed $19B+ in volume, while its infrastructure is designed around cross-chain execution and autonomous agents.
Its 2026 roadmap explicitly combines cross-chain financial infrastructure + autonomous AI agents into a single "agentic economy" thesis.
🧠 Stage 1 thesis
From a technical perspective, I would classify this as a potential Stage 1 → Stage 2 transition setup, rather than a confirmed breakout.
The interesting part is that the market has already absorbed a very large decline and is now building a much more constructive structure.
Key trigger:
🔥 $3.80
If NEAR breaks and holds above that level with strong volume, the next major areas become:
$5.40 → $7.90/8.00
The $8 area is particularly important because it represents the upper boundary of the large historical range visible on the chart.
Bottom line
NEAR combines one of the strongest long-term accumulation structures on the chart with a major narrative shift toward AI agents + chain abstraction + cross-chain financial infrastructure.
The technical setup becomes substantially more interesting if $3.80 is reclaimed with volume.
Stage 1 accumulation / early markup candidate — with $3.80 as the key confirmation level.
What do you think?  Long
Long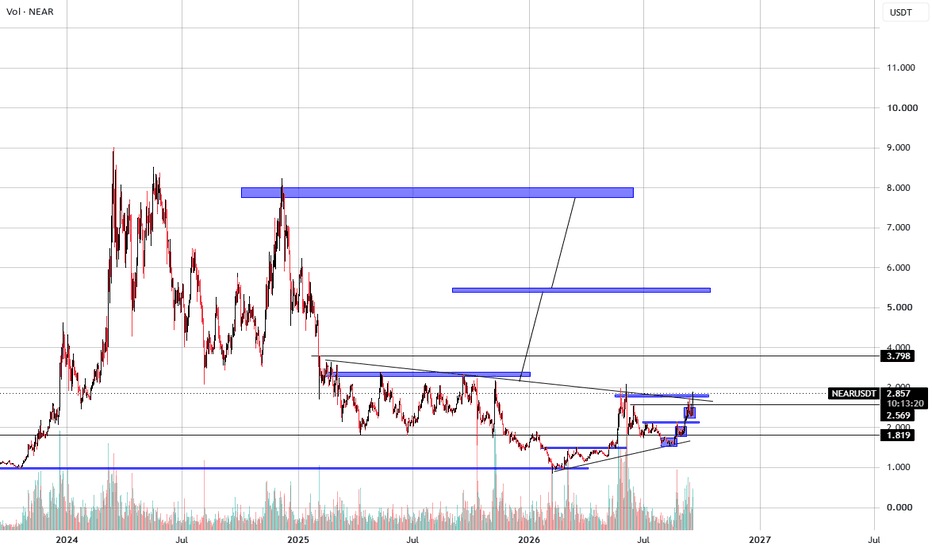
BTCUSD ,Daily , LongTrendline Breakout: Price broke cleanly above the strong red resistance trendline that has capped gains for several months, signaling a potential shift from a bearish to a bullish market structure.
MACD Divergence & Double Bottom: Clear Regular Bullish Divergence on the MACD indicator (highlighted by the green triangular structures) laid the foundation for this reversal, reinforced by Hidden Bullish Divergence during the secondary low.
Multi-EMA Support: Following a sharp rally toward the major $80,000–$82,000 resistance zone, price is currently pulling back and holding strong support on the Multi-EMA ribbon (around $75,000–$76,000).
Key Levels to Watch:
Immediate Support: $75,000–$76,000 (Multi-EMA Ribbon)
Major Resistance: $80,000–$82,000 (Blue Resistance Zone)
Next Target: $98,000–$100,000 (Major Horizontal Resistance)
Invalidation / Lower Support: $65,000–$67,000
Trade Outlook & Strategy:
As long as the Multi-EMA support zone holds, the bullish structure remains intact. A high-volume daily candle close above the $82,000 resistance zone will confirm the next impulse wave toward the psychological $100,000 target.
Risk management is key—watch for price action signals around the current EMA cluster for optimal re-entry or wait for a confirmed breakout above $82k.  Long
Long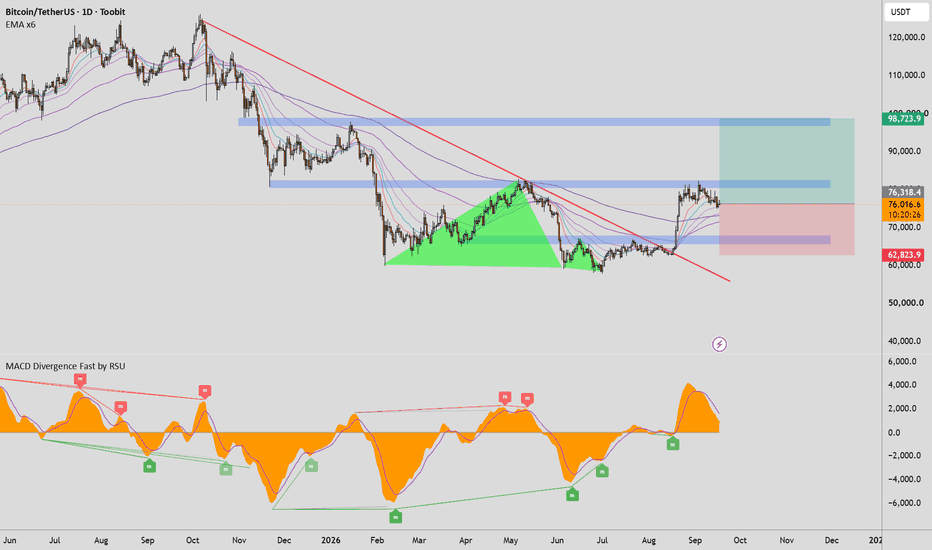
Long 
Crypto Volume Shift: Solana Reports 12.6x More ActivitySolana recently reported that its on-chain trading volume is 12.6 times greater than that of traditional stock exchanges, a significant metric in the evolving landscape of digital assets. This tweet, shared by the Solana account, showcases the growing interest in blockchain technology as a primary trading venue. The implications of this shift could influence market dynamics and trading strategies moving forward.
The Key Development
This latest insight from Solana underscores a critical transition in market behavior, where on-chain trading is increasingly preferred over traditional exchanges. The data suggests that traders are recognizing the benefits of blockchain’s efficiency and transparency, which could lead to more participants entering the crypto space. As the broader crypto market exhibits mixed signals, this surge in on-chain activity may signal a burgeoning acceptance of decentralized trading platforms.
Key Takeaways
Solana’s on-chain trading volume is now 12.6 times higher than traditional exchanges. This data reflects a notable shift in trading preferences among market participants. The increased on-chain volume could enhance liquidity in the Solana ecosystem. Traders may capitalize on the efficiency of blockchain technology for transactions. This trend may influence future trading strategies in the crypto market.
Market Pulse
Despite the broader crypto market showing mixed signals recently, Solana’s reported surge in on-chain trading volume is a noteworthy exception. This substantial increase indicates that traders are increasingly favoring blockchain-based transactions over traditional market methods. With no current price action available for Solana, this focus on trading volume suggests a potential shift in market sentiment towards decentralized trading solutions.
Solana is a high-performance blockchain platform that supports decentralized applications and crypto projects, facilitating rapid transaction speeds and low fees. The growing on-chain volume highlights Solana’s role in revolutionizing how trading occurs, potentially drawing more users from traditional financial systems.
What Comes Next
Traders should keep an eye on Solana’s evolving market position as more users shift towards on-chain trading. The increasing volume could lead to heightened liquidity and more robust market dynamics. Observing how this trend develops will be crucial, especially as the crypto landscape continues to adapt to new technologies and user preferences.
The information provided is for informational purposes only and should not be considered financial advice. Long 
 Long
Long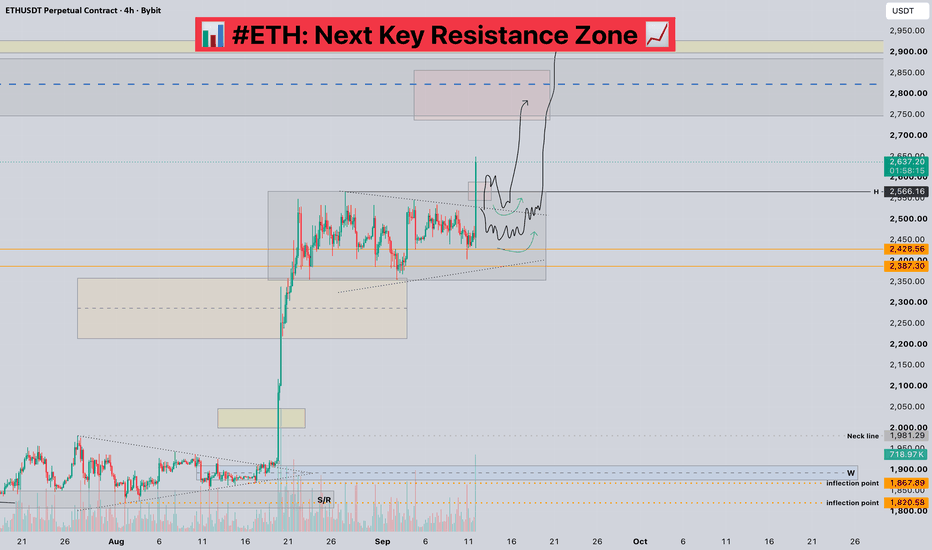
 Long
Long
NEAR Protocol 200% Explosion Is Coming | But Why?First, let's analyze the technical structure.
We have an inverse Head and Shoulders pattern, along with a Cup and Handle pattern. The breakout above the 0.5 Fibonacci resistance level has already triggered the beginning of the bullish move.
However, there is still one major technical obstacle we need to break: the **200-week moving average**. A confirmed breakout above this level could open the door to the next phase of the rally and allow NEAR to accelerate toward its initial and secondary targets.
The first major resistance ahead is around **$3.50**.
You can take anything you want from this analysis, except for one thing: a significant bearish move.
A large amount of NEAR is currently being traded across exchanges, while substantial capital appears to be flowing into the spot market. This increase in trading activity and spot demand is something we need to pay close attention to.
Now, let's look at the fundamental reasons behind this move.
The first major catalyst is NEAR's growing position at the intersection of **blockchain and artificial intelligence**.
More than **500,000 NEAR tokens have been staked** for confidential AI inference and AI-agent infrastructure. This is important because NEAR is not simply adding an AI narrative to its ecosystem; it is building infrastructure designed to allow AI models and autonomous agents to operate securely and privately.
NEAR's AI infrastructure is already supporting access to **more than 40 AI models**, including models from major AI companies. The goal is to provide confidential computation, allowing sensitive data and AI workloads to be processed with stronger privacy guarantees.
This creates a completely different narrative for NEAR: instead of being viewed only as a blockchain network, NEAR is positioning itself as infrastructure for the emerging **AI-agent economy**.
And this is where things become even more interesting.
NEAR Intents is designed to allow users and AI agents to execute operations across multiple blockchain networks without having to deal directly with the complexity of each individual chain. The system has already processed billions of dollars in cumulative cross-chain volume and expanded its connectivity across dozens of networks.
The combination of AI agents and cross-chain execution could become one of NEAR's most important long-term narratives.
Imagine an AI agent that can understand a user's intention, determine the required action, access liquidity across different blockchains, and execute the transaction automatically. NEAR is building infrastructure around exactly this type of interaction between AI and the crypto economy.
Another important development is the growing use of NEAR for confidential AI infrastructure. The amount of capital allocated to this ecosystem has been increasing, while hundreds of thousands of NEAR tokens are being staked to support confidential inference and AI-agent hosting.
This means that part of the NEAR supply is being actively used within the infrastructure rather than simply sitting idle on exchanges.
At the same time, NEAR Intents continues to expand its cross-chain activity. With connections to more than 35 networks and billions of dollars in cumulative transaction volume, the ecosystem is developing a real use case beyond speculation.
There is also an important economic mechanism behind NEAR Intents. A portion of the fees generated by the system is used to acquire NEAR from the open market. If adoption and transaction volume continue to grow, this mechanism could create additional organic demand for the token.
So when we combine everything together, we have a very interesting setup:
A bullish technical structure, a breakout from major resistance, increasing spot-market activity, more than 500,000 NEAR staked for confidential AI infrastructure, expanding AI-agent capabilities, growing cross-chain activity through NEAR Intents, and an ecosystem increasingly focused on connecting artificial intelligence with the crypto economy.
The technical structure is showing us the potential direction, while the fundamental developments are providing the narrative behind the move.
The key level I am watching now is the **200-week moving average**.
If NEAR can reclaim this level and establish a strong position above it, the next phase of the move could begin, with **$3.50 as the first major resistance** and significantly higher targets becoming relevant afterward.
But as always, the market does not move in a straight line. Even during a strong expansion, corrections and volatility are completely normal.
For me, the important question is no longer simply whether NEAR has an AI narrative.
The more important question is whether NEAR can successfully turn its AI infrastructure, AI agents, and cross-chain execution into real and sustained network demand.
That is what I will be watching next.
This analysis is not financial advice.
Thank you,
Mr. Ghasemi Long 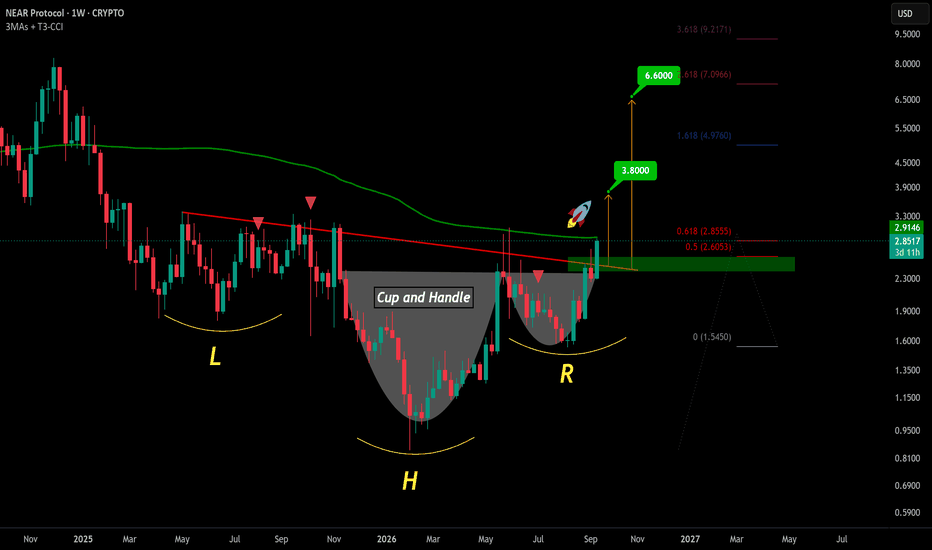
Long 
Trading Roadmap | Gann · Lesson 01 — Price and TimeLesson 01 - Price and Time
Difficulty: (Beginner)
A new course starts here. Almost every tool covered so far answers one question: how far did price travel? The work of W.D. Gann is built on a second question that most charts never ask out loud — how long did it take, and are the two in proportion? This lesson is about that idea, about the man who built a method around it, and about which parts of that method are worth carrying into a modern chart.
One advance, measured twice. The vertical dashed line records how far price moved. The horizontal one records how long it took. Most analysis uses only the first. Everything in this course begins by treating the second as data of equal standing.
🔵 WHERE THIS COURSE FITS
The Wave Analysis course described market movement as a structure of repeating patterns. This course describes it as a relationship between two measurements — price and time — and gives tools that measure the second one explicitly.
The two courses are not rivals. A wave count says which leg of a structure price is in. A time measurement says how long that leg has been running and whether it has run the length that similar legs tend to run.
🔵 1. WHO W.D. GANN WAS
William Delbert Gann was born in Texas in 1878, into a cotton-farming family, and started trading in his early twenties. He opened his own brokerage in New York in 1908 and spent the next four decades trading, teaching, and writing.
- He published several books, including Truth of the Stock Tape (1923) and 45 Years in Wall Street (1949)
- A 1909 interview in The Ticker and Investment Digest recorded a month of his trades under observation — the most documented account of his trading that exists
- He sold courses and forecasts, which was a significant part of his income
There is also a legend around him, and it is worth separating from the record. Claims that he made a fortune of tens of millions are not supported by his estate, which was modest, and his own son questioned how much of his income came from trading rather than from teaching. Some of his writing drifts into numerology and astrology that no amount of goodwill can turn into a testable method.
None of that removes the value of the core idea. It does mean this course takes his work as a framework of measurement rather than as prophecy, and says clearly which parts belong in each category.
🐳 Pro Tip: Be careful with any method sold on the reputation of its author. The measurement either holds up on your own chart or it does not, and the biography has no vote in that.
🔵 2. THE IDEA THE WHOLE METHOD RESTS ON
A chart has two axes, and almost all common analysis lives on one of them.
- Support, resistance, Fibonacci levels, targets — all of these are statements about price
- Very few tools make a statement about duration
- Gann's contribution was to treat time as measurable in the same way: a move can be too fast, too slow, or in proportion
The practical version of that idea is simple. If a rally covered a certain distance in a certain number of bars, then the next rally of the same degree can be compared against both numbers, not just the first.
🐳 Pro Tip: The quickest way to start using this is a habit, not a tool. Whenever you mark a swing, write down two numbers instead of one: its size, and how many bars it took.
🔵 3. THE SAME DISTANCE IS NOT THE SAME MOVE
Two advances can end at the same price and mean completely different things.
Two advances between the same two levels. The one on the left covered the distance quickly with few pauses; the one on the right took far longer and paused repeatedly. On a price-only reading these are the same move. On a price-and-time reading they are not.
- A move that covers ground quickly is often carrying more participation behind it
- A move that takes a long time to reach the same level is typically meeting more supply along the way
- Neither observation is a signal on its own, but the distinction is invisible if duration is never recorded
🐳 Pro Tip: This is the least mystical part of Gann's work and the easiest to test. Compare the bar counts of the advances in a trend you already know — declining speed across successive legs is a common late-trend characteristic.
🔵 4. THE 1×1 LINE
If price and time are both measurable, then a rate can be defined: one unit of price for one unit of time. That rate is the 1×1 line, and it is the centre of the Gann toolkit.
A grid where each cell is one unit of price by one unit of time, and the line that rises exactly one cell per cell. Price here is travelling faster than that rate, so the path stays above the line. When an advance falls back below it, the rate of advance has changed — which is the reading the line was built to give.
- Price above the 1×1 line means the advance is running faster than the reference rate
- Price below it means the advance has slowed relative to that rate
- The line is often drawn from a significant high or low, and can act as moving support or resistance
One warning that matters more than anything else in this lesson: the famous 45-degree angle is a consequence of chart scaling, not a law of markets. A 1×1 line looks like 45 degrees only when one unit of price is drawn the same visual size as one unit of time. Change the zoom and the angle changes while the relationship does not. Lesson 04 deals with this properly.
🐳 Pro Tip: If someone tells you to draw a 45-degree line on any chart without first defining what one unit of price and one unit of time are, the line means nothing. The unit is the whole method.
🔵 5. THE NUMBERS HE KEPT RETURNING TO
Gann divided things — ranges, circles, time periods — into simple fractions, and watched what happened at the divisions.
- A range split into eighths : 1/8, 2/8, 3/8 and so on, with 4/8 (the halfway point) treated as the most important of all
- A range split into thirds : 1/3 and 2/3
- The circle divided into 90 · 180 · 270 · 360 , applied to both price and time
A completed range divided into eighths, with the halfway level marked. The pullback stops at that level. Splitting a range into simple fractions is the oldest idea in the toolkit and the one that survives testing best.
It is worth being honest about why these levels work as often as they do. A halfway retracement is watched by a very large number of participants, whatever method they use to arrive at it. That is a sufficient explanation, and it does not require the numbers to be special in themselves.
🐳 Pro Tip: Half of the range does most of the work here. If you add only one Gann level to your chart, make it that one, and note how often it decides whether a pullback becomes a reversal.
🔵 6. MEASURING TIME ON ITS OWN
The other half of the method takes the same divisions and applies them along the horizontal axis.
- Count the bars between two significant turns, then project the same count forward
- Watch equal intervals from a major high or low, rather than levels
- Note when a market turns at a similar distance in time from a previous turn — Gann called these anniversary dates
Equally spaced vertical lines projected forward from a starting low. Several turns land close to them. Not all of them do, which is the point: this is a way of knowing when to pay attention, not a schedule the market is obliged to keep.
The correct expectation matters here. A time interval does not tell you direction, and it does not guarantee a turn. What it can do is tell you when a market has been moving in one direction for as long as its previous legs ran — which is a reason to watch closely rather than to act.
🐳 Pro Tip: Use time measurements to raise attention, never to enter. A time interval with no price event at it is a date that passed, and nothing more.
🔵 7. WHERE THE TWO MEET
The idea that ties the course together is what Gann called squaring price and time: the point at which a market has travelled an amount of price equal, in chosen units, to the amount of time elapsed.
A range and an equal span of time, drawn as a square with its diagonal. Price reaches the far corner — the distance travelled and the time taken have come into balance at the same bar. Points like this are where the method expects the character of a move to change.
- The unit is chosen by you, and it has to stay consistent to mean anything
- Squaring can be applied from a high, from a low, or across a full range
- Lesson 02 builds the tool Gann used to do this arithmetic quickly: the Square of Nine
🐳 Pro Tip: Fix your unit once per market and write it down. Most confusion with Gann tools comes from silently changing the unit and then reading the results as if nothing changed.
🔵 8. WHAT TO CARRY FORWARD, AND WHAT TO LEAVE
A short and honest sorting, since this course covers a body of work that contains both.
Worth carrying:
- Recording duration alongside distance for every swing you mark
- Dividing ranges into simple fractions, above all the halfway level
- Angles and the 1×1 rate as dynamic support and resistance, once the unit is defined
- Comparing the current leg against the bar counts of previous legs of the same degree
Worth leaving:
- Any claim that a number is significant in itself rather than because it is widely watched
- Planetary and astrological overlays, which cannot be tested in any useful sense
- Precise date forecasts presented as certainty
- The idea that the method reveals a hidden order rather than a set of measurements
🐳 Pro Tip: Judge each tool in this course by one question: can it be stated clearly enough that someone else would get the same result on the same chart? Everything that passes that test is worth your time.
🔵 COMMON MISTAKES
- Drawing a 45-degree line without defining what one unit of price and one unit of time are
- Treating a time interval as a signal instead of as a reason to look
- Changing the unit between measurements and comparing the results anyway
- Adding every angle and every division to the chart until nothing on it can be read
- Taking the legend around Gann as evidence that the tools work
- Expecting an exact date and an exact price, when the method produces areas
🔵 QUICK SELF-CHECK
- Take a trend you know well and write down the bar count of each leg — are they getting shorter or longer?
- Mark a completed range, divide it into eighths, and check what the halfway level did
- Measure the time between two major turns and project it forward — what happened near that area?
- Ask yourself what your unit of price per bar would be on the chart you trade most
- Look at a rally you called strong and check whether it was strong in price, in time, or in both
🔵 WHAT IS NEXT
Lesson 02 builds the Square of Nine — the numbered spiral Gann used to relate price levels and dates through the same set of divisions, and the tool most associated with his name.
Worth sitting with before then: a chart is a record of two things, and most of us throw one of them away before we start analysing. The rest of this course is about picking it back up.
Previous course — Wave Analysis
Trading Roadmap | Wave Analysis · Lesson 01 — Wave Analysis Foundations
Trading Roadmap | Wave Analysis · Lesson 14 — The Full Read
Best Regards, BigBeluga 🐳 Education 
Bitcoin Bounces — But Bulls Still Have Plenty to ProveSeptember Support Reclaimed For Now
Bitcoin has recovered back above the $76,264 area after briefly breaking below it earlier this week. Holding above this former support would be an encouraging first step for the bulls.
Medium-Term Trend Still Down
Despite the bounce, Bitcoin continues to produce a series of lower highs and lower lows from the $82,300 peak. That structure still leaves the medium-term trend pointing lower.
Moving Averages Turn Bearish
The 100/50-period EMAs have now crossed bearishly, with price still trading beneath both averages. Bulls will need to reclaim these to start improving the 4-hour picture.
Momentum Is Recovering
RSI has climbed back towards the 50 level, while StochRSI is rising towards overbought territory. Momentum has improved, but neither currently gives a particularly strong bullish signal.
The Big Test Remains $80,000
Bitcoin has failed around $79,600–$80,000 three times in little over a week. A convincing break above this area would give the chart a bullish change of character and finally challenge the recent sequence of lower highs.
In Summary
Bitcoin has reclaimed the $76,264 area, giving bulls something to work with after this week's breakdown. However, the medium-term structure remains bearish, with a series of lower highs and lows and the 100/50-period EMAs now bearishly crossed. Momentum is recovering, but bulls still have plenty to prove. Until Bitcoin can convincingly break through the $79,600–$80,000 resistance area, the risk of sellers stepping back in remains very real.  Long
Long