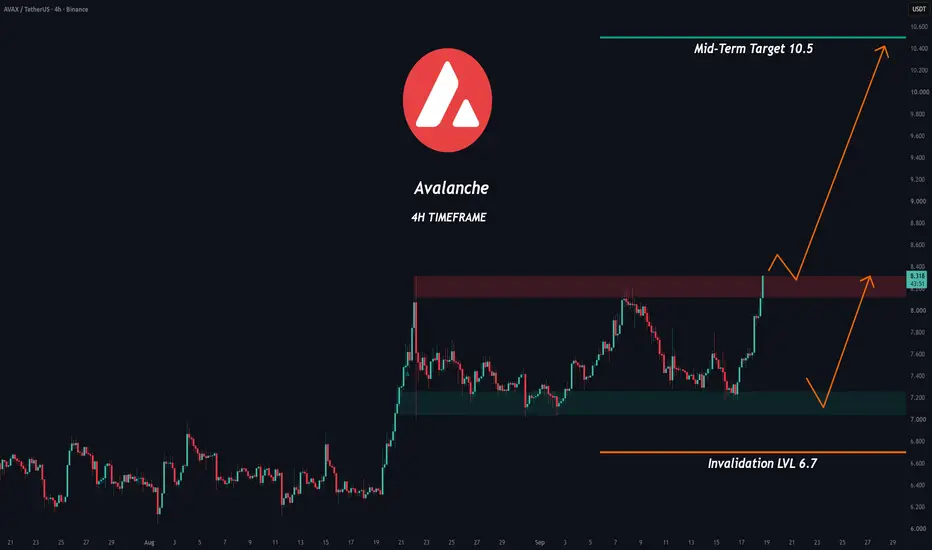
Crypto market
BTC — drop to 60k (RSm) | 20 July 2026BITUNIX:BTCUSDT.P
Context
Price: $64,550
W horizon: sign positive, magnitude mid, maturity high — deviation has outlasted most historical cases of similar size.
M horizon: magnitude high, maturity high — also set to resolve soon, reset ~68,000.
Expectation
W resolves first — mean reversion toward the W sign-flip level, ~60,000. Once W clears, M becomes the dominant structural driver, pulling price back up toward its own reset level, ~68,000.
Timing: W-horizon window (days to ~1-2 weeks), M to follow
Notes
This is a rules-based RSm forecast. Model shows structural state, not a trade recommendation. I document RSm model states in real time. Follow for more RSm forecasts.
If new to RSm:
RSm Architecture #3 — Magnitude vs Maturity of Deviation
RSm Architecture #4 — Cascade of Horizons
RSm Architecture #6 — Sign Flip Level
ONDO Breakout After Major RWA News — Is Another 20% Rally Next?Ondo ( BINANCE:ONDOUSDT ) surged over 17–20% on July 15–16, 2026, primarily driven by a major institutional milestone: the launch of tokenized stock representations backed by DTCC’s Tokenization Service (the largest U.S. securities clearinghouse).
This development creates real “digital twins” of DTC-held securities (such as SPY and CRCL) on-chain, marking a significant step in bridging traditional finance infrastructure with blockchain. Combined with the ongoing strong RWA narrative and previous catalysts like the Ondo Perps launch and 24/7 Solana ( BINANCE:SOLUSDT ) trading, it triggered renewed buying interest and higher volume.
---------
Now, let’s dive into the technical analysis of ONDO on the 8-hour timeframe. Stay with me.
ONDO is currently attempting to break the resistance zone($0.395-$0.385) and appears to have successfully moved above the key trading level of $0.37. I expect the token to break this resistance zone and continue its bullish trend.
From a classical technical analysis perspective, ONDO has successfully broken the upper trendline of the Falling Wedge Pattern. This breakout has been supported by strong trading volume, and considering the recent fundamental news surrounding the project, we can expect this bullish momentum to continue toward the next resistance zone($0.540-$0.433).
From an Elliott Wave perspective, it appears that main wave 4 has been completed with the help of the Falling Wedge Pattern, and we can now expect the next impulsive wave to begin.
I expect ONDO to gain at least +20% from its current price and move toward the next resistance zone($0.540-$0.433) and the Cumulative Short Liquidation Leverage($0.459-$0.442).
Target: $0.430
Stop Loss(SL): $0.343(Worst)
What’s your view on ONDO? Do you think it can continue its bullish trend, or should we expect another correction first?
💡 Please respect each other's opinions and express agreement or disagreement politely.
📌 Ondo Analyze (ONDOUSDT), 8-hour time frame.
🛑 Always set a Stop Loss(SL) for every position you open.
✅ This is just my idea; I’d love to see your thoughts too!
🔥 If you find it helpful, please BOOST this post and share it with your friends.
THE OLD TOP IS THE TESTMarkets rarely ring a bell at the bottom. They usually return to test what was once considered impossible. That is exactly where Bitcoin is now.
2021 all time high acted as the ceiling for years. Today, price is treating that same level as support while sitting on a long term rising trendline.
Previous cycle tops often become the foundation of the next cycle.
As long as this structure holds, the higher timeframe trend remains intact.
Many are still waiting for lower prices because fear always feels convincing during a retest. But history shows that the strongest trends are often built by successfully defending old resistance after it turns into support. market is no longer asking whether Bitcoin can break the 2021 high.
It is asking whether the 2021 high is now the floor.
BTC/USD 3d
+ BTC/USD 2d and Rsi(100)
ETHUSD: Forming new Top in preparation for $1,300Ethereum remains bearish on its 1W technical outlook (RSI = 42.415, MACD = -320.200, ADX = 20.168) despite July's rally that turned 1D green. The price is now yet again at the top (LH) of the October 2025 Channel Down and roughly (both in price and RSI terms) where it initiated the last 2 bearish waves. Expect at least a -29% decline, TP = 1,375.
## If you like our free content follow our profile to get more daily ideas. ##
## Comments and likes are greatly appreciated. ##
Four (FORM) 3150% to Fibonacci Resistance. May 2026Yes, 30x
SYMBOL: FORMUSDT | DIRECTION: LONG | TIMEFRAME: 4-Day
Published: May 2026
Nobody is talking about FORM. At $0.28, with a 30x resistance target to $10 confirmed by two independent Fibonacci measurements and the strongest divergence signal to ever print, what are you waiting for? The crowd?
On the above 4-day chart price action has corrected over 95% from its all-time high. Several compelling reasons now exist to consider a long position. They include:
1) Strong bullish divergence confirmed. Price action has been printing lower lows throughout the 2025 - 2026 decline. RSI now prints higher lows, a divergence that has now resolved with the oscillator turning upward and the buy signal.. never mind about that.
Divergence of this strength on a 4-day timeframe is not a minor signal. It is the oscillator telling you that sellers are exhausted at these levels, regardless of what the price action has been suggesting. Look left.
2) The Fibonacci 1.272 extension and previous cycle alignment . The right-side Fibonacci extension projects the 1.272 level to $9.34, approximately 3,150% from the current price, or roughly 30x. This level is not arbitrary: it aligns with the general territory of the previous cycle’s Fibonacci extension zone, visible on the left side of the chart where the 1.618 printed at $6.86. Two independent Fibonacci measurements from two separate cycles pointing to the same price region is confluence. It is the kind of target confirmation that transforms a projection into a destination.
3) The ascending trend-line from the lows . The black diagonal trendline visible on the chart connects the significant lows and projects upward toward the $9.34 target area. Price is currently at that trendline. The trendline, the Fibonacci extension, and the composite bull signal are all aligned at the same moment. These confluences are rare. They do not remain unnoticed indefinitely.
Targets
1st target: $0.90, the 0.5 Fibonacci retracement (~220%). The first zone of meaningful resistance. Expected to produce a pause and partial profit-taking. Not a reason to exit the full position.
2nd target: $2.14, the 0.786 Fibonacci retracement (~660%). Significant resistance. Where prior support from the 2024 consolidation sits. A 4-day close above this level opens the door to the upper targets.
3rd target: $9.34, the 1.272 Fibonacci extension (~3,150%, approximately 30x from current levels). This is where the previous cycle’s Fibonacci structure and the new cycle’s extension converge. It is the destination the chart is pointing toward. It is not a forecast to be taken lightly, nor is it one to be dismissed. The trendline, the composite oscillator, and two sets of Fibonacci measurements all agree on this area as the primary target.
Extended target: 700x! the upper band visible resistance the chart. Not a base case. The scenario in which FORM outperforms its prior cycle. Included because the chart shows it.
What cancels the thesis?
A 4-day close below $0.1967, the Fibonacci 0 level, the base of the extension invalidates the setup. That level represents a structural failure of the current support. Until a close below that level prints, the bias is long, the divergence is confirmed, and the signal is the strongest this chart has ever produced.
The crowd
FORM does not trend on social media. There are no YouTube videos about it this week. There is no narrative attaching itself to it. It is simply a chart, at a low, with the strongest composite signal in its history, printing a confirmed bullish divergence, at a Fibonacci confluence that aligns with the previous cycle. The crowd will find it eventually. They usually do somewhere around $3 or $4, when it feels safe again. Today it's yours for 29 cents.
Is it possible price falls further? Sure.
Is it probable given what the 4-day chart is showing? No.
Good luck.
Ww
=============================================================
Disclaimer : This idea is for educational and informational purposes only. It is not financial advice. Trading cryptocurrencies involves substantial risk of loss and is not suitable for every investor. Always do your own research and consult a qualified financial adviser before making any investment decisions. Past performance is not indicative of future results.
BTC: Optimizing a 65,500 Resistance Breakout LongI am looking closely at a BTC long setup today that buys a 65,500 resistance breakout using a 65,760 entry, a 67,095 take-profit, and a 65,245 stop-loss. My goal is to mathematically optimize these exact levels by filtering the market through Volume Profile, Order Blocks, and Fair Value Gaps.
💡 IDEA
The core bullish thesis is firmly validated by the 4h uptrend, a recent 15m bullish CHoCH, and a 1h EMA golden cross.
However, relying on a breakout entry at a premium price leaves the position highly exposed.
By targeting a structural pullback instead, the risk profile improves dramatically.
🛫 ENTRY
The original entry at 65,760 buys at a severe premium above the 4h resistance zone of 65,589.7 to 65,597.2 and far above the value area high of 64,979.44.
To secure a high-probability discount, the entry was moved to 64,950.
This optimized level perfectly aligns with the top of the unmitigated 15m order block between 64,855.3 and 64,950.
It also matches the maximum price of the 1h support zone at 64,948.8 while sitting comfortably inside the value area.
💰 TAKE-PROFIT
The original take-profit at 67,095 is structurally sound and remains unchanged.
This placement safely front-runs the next major 4h resistance zone located at 67,255.4.
Execution is ensured before any potential selling pressure hits at that structural extreme.
🛡️ STOP-LOSS
A stop-loss at the original 65,245 level is unviable because it rests directly above an unmitigated 15m fair value gap between 64,998 and 65,209.
A stop-out is nearly guaranteed as price retraces to fill that imbalance.
The stop-loss was relocated to 64,540 for a multi-layered defense.
This new placement sits safely below the secondary 15m fair value gap spanning 64,550 to 64,855.3.
It also rests below the daily and weekly VWAP at 64,679.8, as well as the average price of the 1h support zone at 64,708.7.
⚖️ RISK-TO-REWARD
Shifting from a premium breakout to a discount pullback entry reduces the risk from 515 points down to 410 points.
Simultaneously, the reward increases from 1,335 points to 2,145 points.
This mathematical shift improves the risk-to-reward ratio from 1:2.59 to a highly asymmetric 1:5.23.
It will be interesting to see which setup actually performs better.
CAKE | Accumulation Zone Completion? Breakout Opportunity Ahead!After an extended downtrend, #CAKE has entered a well-defined accumulation zone on the 1D timeframe, where buyers and sellers are battling for control. Price has already produced a strong recovery from the lows, suggesting that smart money could be accumulating positions.
At this stage, patience is more valuable than prediction.
Technical Analysis
Clear Accumulation Range formed after the bearish trend.
Strong corrective rally from the bottom indicates improving momentum.
Price is currently consolidating within the accumulation zone.
A high-volume breakout above the range will be the key confirmation for the next bullish leg.
Trading Plan
Entry: Wait for a confirmed breakout above the accumulation zone with strong bullish volume.
Confirmation: A daily candle close above resistance, followed by sustained buying pressure or a successful retest.
Stop Loss: Below the breakout/retest level or the most recent swing low.
Take Profit: Target the next major resistance levels while maintaining a minimum Risk-to-Reward ratio of 1:2 or better.
Risk Management
Never enter before confirmation. False breakouts are common during accumulation phases. Let the market confirm the move, manage your risk carefully, and avoid emotional trading.
Key Takeaway
The trend doesn't change until resistance breaks. #CAKE is building a solid base, and a volume-backed breakout could mark the beginning of a fresh bullish trend. Until then, the best strategy is to stay patient and wait for confirmation.
Do you think #CAKE is preparing for a major breakout, or will the accumulation continue? Share your analysis in the comments!
If you found this analysis helpful, don't forget to:
Like this idea
Share your thoughts in the comments
Follow Elite Technical Analysis Hub for high-probability trading setups and daily market analysis.
#CAKE #CAKEUSDT #Crypto #TechnicalAnalysis #TradingView #Breakout #Accumulation #PriceAction #SwingTrading #Altcoins #CryptoTrading #RiskManagement #BullishBreakout #VolumeAnalysis #TradingStrategy
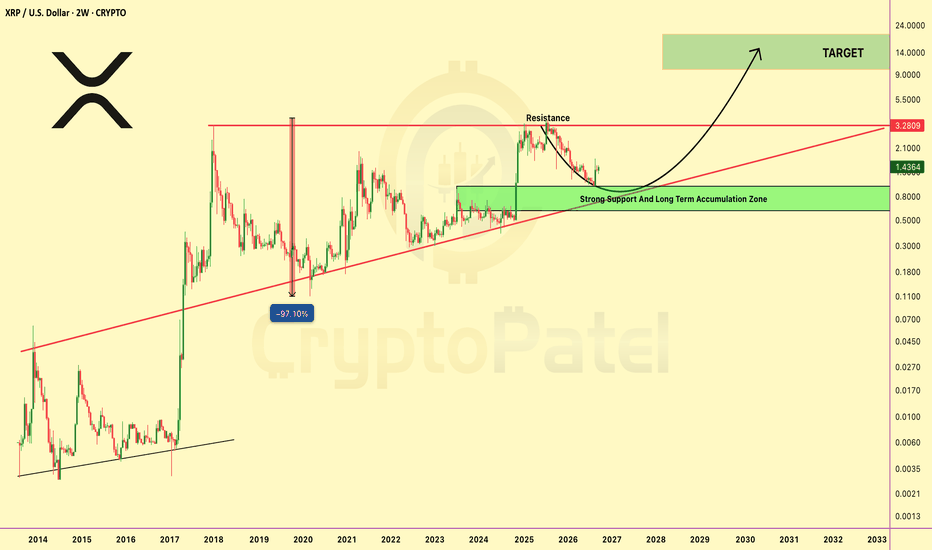
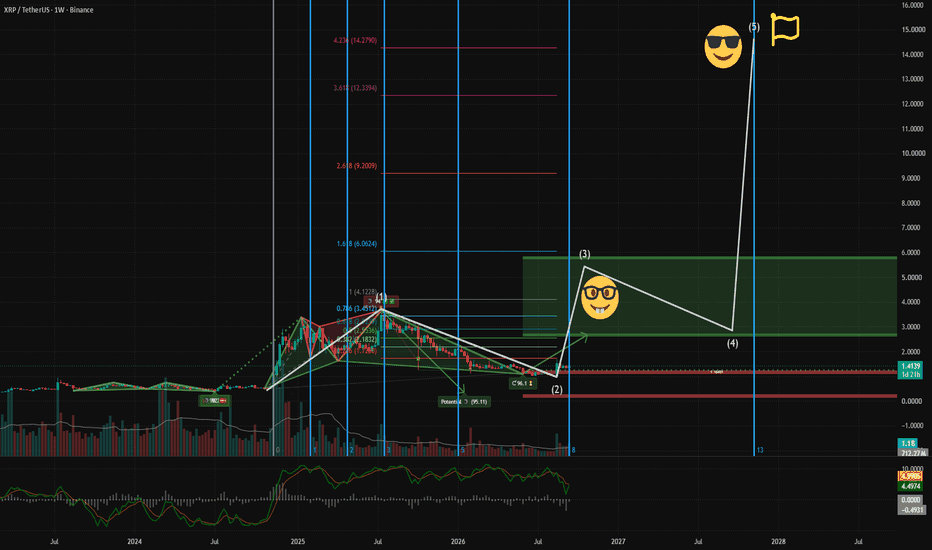
Xrp - Preparing for a +200% bullrun!🔮Xrp ( CRYPTO:XRPUSD ) is testing a massive support:
🔎Analysis summary:
For the past couple of months, Xrp has been trading in a massive extended downtrend. But right now, Xrp is also about to retest a major confluence of support. If Xrp creates bullish confirmation at this area quite soon, we could witness a strong parabolic bullrun.
📝Levels to watch:
$1.0
Keep your #LONGTERMVISION🙏
— Phil (@TheTraderPhil)
HEMIUSDT: Potential 35% CorrectionHEMI is showing signs of weakness and may be setting up for a deeper pullback. If price fails to reclaim the current resistance area, a correction of around 35% is possible.
Watch for lower highs, selling volume, and rejection on retests. This is a market idea, not financial advice—manage your risk.
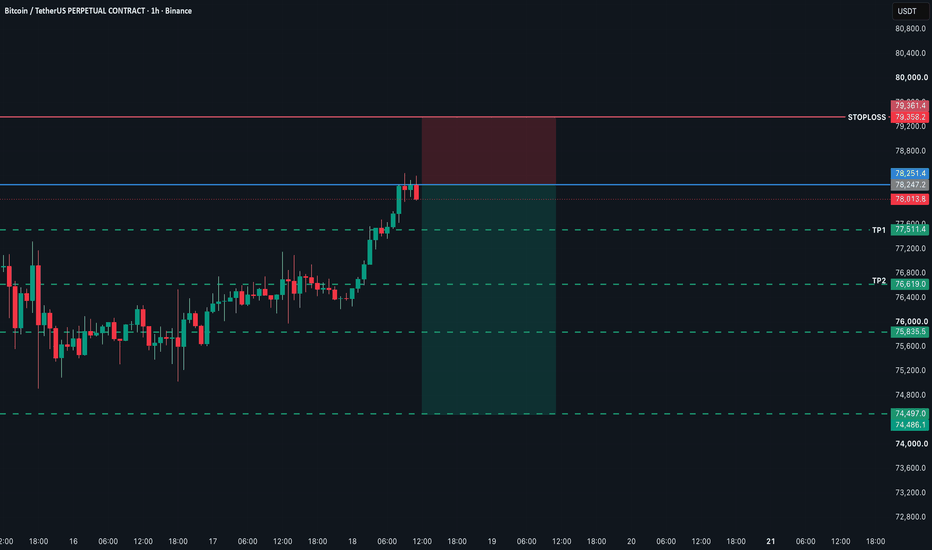
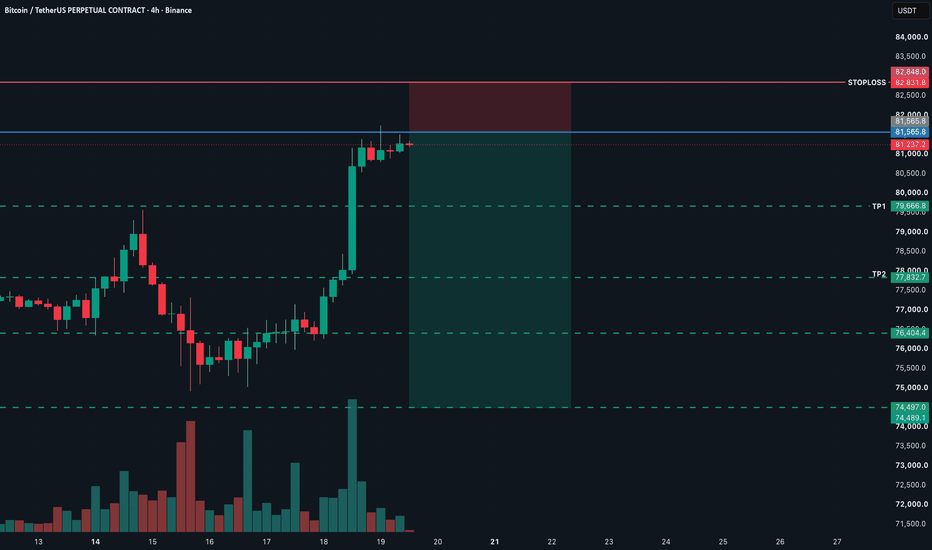
BTCUSD: Channel top rejection. Stoch exited OB. Short 65060.📊 Trade Plan:
🔻 Entry: 65060
🛑 Stop Loss: 66120
🎯 Take Profit 1: 64140
🎯 Take Profit 2: 62870
📉 Technical Picture (H1):
Ascending Channel: Price bounced off the upper channel boundary. Clean rejection — move back toward the lower boundary expected.
Stochastic: Exited overbought territory. Exhaustion signal confirmed.
Simple setup, quick target: TP1 inside the channel, TP2 at the lower boundary.
🗞️ Fundamental Note:
ETF inflows improved: +$75.67M last week, second straight positive week. But US-Iran escalation (9th night of strikes, ballistic missiles, Hormuz contested) keeps risk appetite suppressed. Oil keeps rising, Dollar firm. Massabni (XS.com): "current buying pressure only strong enough to contain the downside, not enough to confirm a new uptrend."
❌ Invalidation:
A daily close above 66120 breaks the channel and voids the short setup.
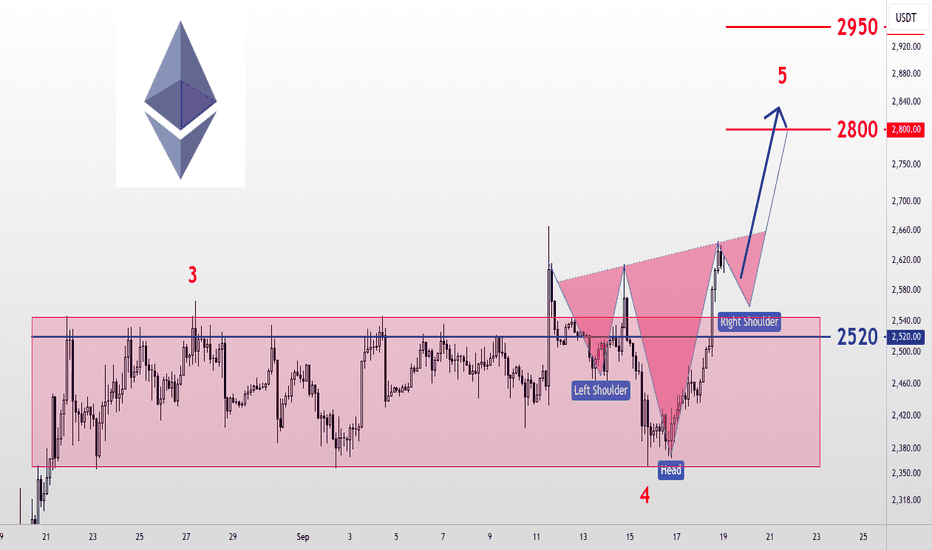
Ethereum (ETHUSDT) AnalysisEthereum continues to hold above the main support zone after a strong recovery from the recent lows. As long as the price remains above 1849, I maintain my bullish outlook.
The 1860–1690 accumulation area offered an attractive long opportunity, and the current price action suggests buyers are still in control.
Trade Plan:
Long Entry: 1660–1690
Stop Loss: 1849
TP1: 1940
TP2: 2010
TP3: 2140
TP4: 2320
TP5: 2420
A sustained move above 1940 could open the way toward the higher targets. However, a break below 1849 would invalidate this bullish scenario.
As always, wait for confirmation and manage your risk carefully.
This is my personal market analysis and not financial advice.
ETH Analyses-11, [July 21, 2026]Welcome to my page! I share daily technical analyses of Ethereum and other charts here.
BINANCE:ETHUSDT
💡 Market Analysis:
The price is currently compressing within a wedge pattern and testing the upper trendline resistance. We anticipate a rejection toward the key support at 1,670.00 before a strong breakout with an 80% candle body triggers a new bullish trend.
Key Support & Resistance:
Key Resistance: 2,000.00 - 2,250.00
Key Support Area: 1,670.00 - 1,850.00
🎯 Trade Entry & Exit Plan:
Entry : Breakout/Pullback of trendline or key zones with >80% candle body and two waves outside the range.
Stop Loss : Behind the last wave or the last breakout candle with a large body.
Take Profit : Minimum R:R 2, with further targets at major horizontal levels (2,000.00 and 2,250.00).
⚠️ Risk Management:
Maximum 1% risk per trade.
❤️ Please share your thoughts and comments on this analysis!
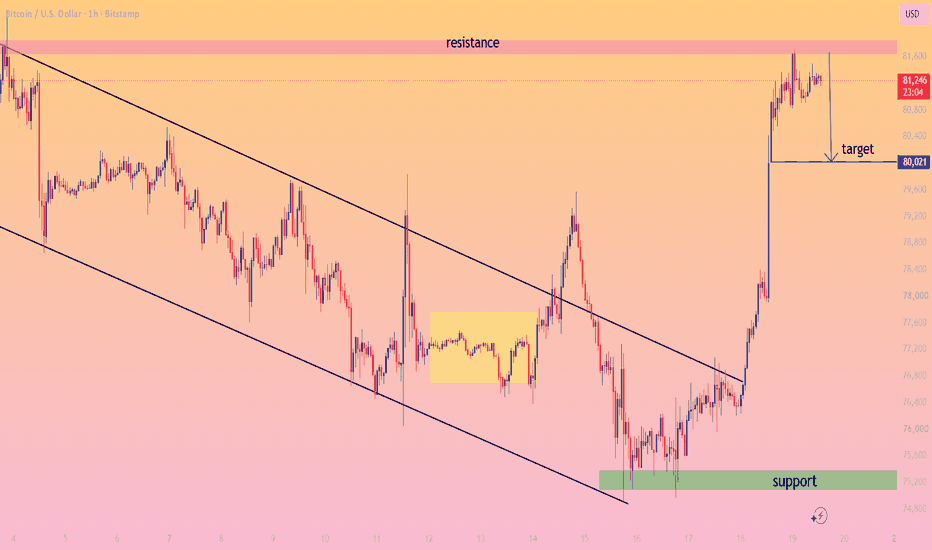
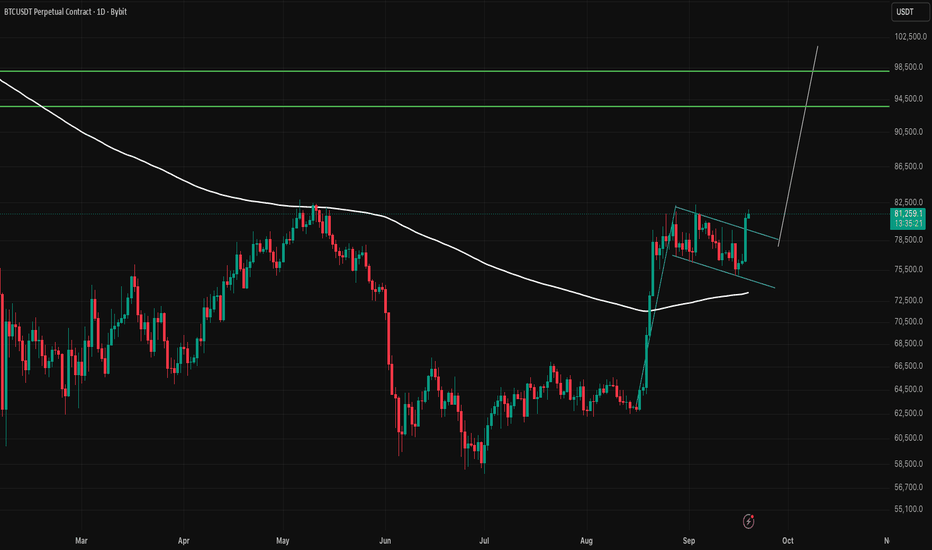
Bitcoin: Double Top or Breakout?Major resistance tested
Bitcoin has rallied back into the previous high around $65,600, where sellers have once again stepped in. This remains one of the most important resistance levels on the chart, with bulls needing a decisive break and close above it.
Potential double top
The latest rejection keeps the possibility of a double top alive. Another failure at this level would strengthen the bearish case and increase the likelihood of a move back towards lower support.
Trend still constructive
Despite the rejection, the 100/50-period EMAs remain bullishly crossed, with price continuing to trade above both upward-sloping averages. That keeps the broader short-term trend tilted in favour of the bulls.
Momentum & volume
RSI has climbed back above 50, while StochRSI remains just below overbought territory, suggesting momentum is improving but not yet exhausted. Buying volume also increased into the latest rally, highlighting stronger demand than previous advances.
In Summary
Bitcoin has reached another critical test at the $65,600 highs. Improving momentum, stronger buying volume, and bullishly crossed moving averages all favour the bulls, but resistance continues to hold firm. A convincing break and close above this level would invalidate the potential double top and open the door to fresh highs. Until that happens, another rejection remains a realistic outcome, making this one of the most important levels currently on the chart.
PENDLE is in a bullish pattern (4H)From the point marked by the green arrow, a corrective triangle appears to have completed, and PENDLE has entered a bullish pattern.
This pattern appears to be a Diametric.
At the moment, the price seems to be at the beginning of Wave G. Based on the balance of the previous bullish waves within this pattern, a strong Wave G is expected.
The targets are marked on the chart. Consider taking partial profits at the first target.
As long as the green support zone holds, PENDLE remains bullish.
A daily candle close below the invalidation level will invalidate this analysis.
If you have a symbol you want analyzed, first hit the like button and then comment its name so I can review it for you.
Do you also think PENDLE is bullish?
$ZEC Is Preparing For The Next Move ?? CRYPTOCAP:ZEC Is Preparing For The Next Move ??
ZEC is showing a strong recovery structure after the previous drop. Price has been creating higher lows and buyers are defending the key demand zone around $440-$480. As long as this area holds, the bullish structure remains valid and I’m watching for a possible continuation move.
The next important step is a clean break above the current resistance area. If bulls manage to push higher with strong volume and a daily close above resistance, we could see momentum continue toward the next levels around $621 and potentially $688. A healthy pullback into the support zone before the breakout would be an even stronger confirmation.
The bullish idea will be invalidated if price loses the demand zone and starts closing below it. Until then, I prefer to stay patient and wait for confirmation rather than entering emotionally. Let the market show the direction first. 📊
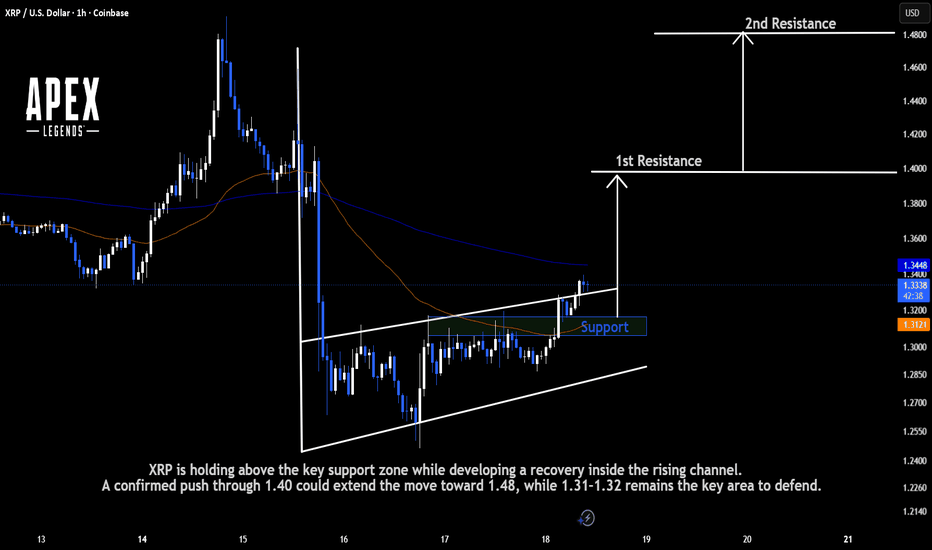
XRP USDT LONG SIGNAL#95 XRP/USDT – Trade Setup (LONG)
📈 Position Type: LONG
🕒 Timeframe: 1H
📊 Market: Futures
💰 Entry Zone:
Market
1.0623
🛑 Stop-Loss:
1.050
🎯 Take-Profit Targets:
• TP1: 1.110
• TP2: 1.1318
• TP3: 1.1543
• TP4: 1.1779
⚙️ Leverage:
5 *10
▫️ After TP1, move SL to Entry + 0.2%.
▪️ Exit Plan:
• 40% at TP1
• 20% at TP2
• 20% at TP3
20% at. TP4
📌 Risk Management:
Risk only 1–2% of your capital per trade.
⚠️ Always check and confirm the setup on your chart before entering the trade.
Dogecoin — The Structure of a Potential Golden Era
Taking a closer look at the third wave of Dogecoin, we can now examine the internal structure of this larger-degree scenario in greater detail.
What makes this chart particularly interesting is that, in some cases, the patterns do not remain confined to the boundaries we initially expect. Instead, they gradually extend beyond their original framework and begin to reveal a much larger structure.
Here, we are looking at a long-term scenario that, if confirmed, could potentially lay the foundation for a Golden Era for Dogecoin.
Of course, “Golden Era” is not a slogan or a guaranteed prediction.
The meaning of that term will ultimately be determined by the structure itself and by the path the market chooses to take in the future.
In my long-term studies of Bitcoin, Ethereum, and Dogecoin, one common element has repeatedly captured my attention:
Structure.
Not excitement.
Not hype.
Not unsupported predictions.
If this scenario eventually unfolds, it will not be because we decided in advance that the market must go higher.
It will be because the structure allowed for that possibility.
At the current stage, Wave IV appears to be approaching its final stages, and specific targets have already been defined for this corrective structure.
Once Wave IV is complete, the next step is no longer prediction.
It is waiting for confirmation through price action.
A breakout from the corrective channels, followed by the ability of price to hold above the broken structure and develop a valid bullish pattern, could provide the first significant evidence that the next major advance is beginning.
However, there is one important principle we must always remember.
The market is a very strict enforcer.
For every violation of its rules, the market demands a heavy penalty.
If a scenario violates its structural rules, we must accept it.
If an invalidation level is broken, the count must be reconsidered.
The market does not negotiate with any analyst.
At the same time, missing a valid opportunity also carries a cost.
Sometimes, missing a major move can be just as costly as taking a position against the market.
Therefore, the goal is not to be in the market at all times.
The goal is to understand the structure, define the scenarios, identify the invalidation levels, and act when the market provides the confirmation.
At this stage, the long-term structure of Dogecoin continues to present a very interesting scenario.
This structure may eventually develop into a much larger advance.
Perhaps it will complete and reveal what could truly become a Golden Era for Dogecoin.
Or perhaps the market will violate the structure and force us to reconsider the count.
Ultimately, the only thing capable of providing the real answer is future price action and market structure.
For now, patience is required.
We must allow the future to reveal itself.
Several years from now, this chart may provide very interesting feedback.
Will this structure ultimately lead to the major advance illustrated in this scenario?
Or will the market choose another path?
The future will provide the answer.
But until then, one thing remains clear:
We do not predict the future. We study the structure and allow the market to reveal what comes next.
— Mr. Nobody | Elliott Wave Principle
Trading Decoded | #1: The Butterfly Effect What if your biggest trading loss didn't begin with a bad setup—but with one tiny decision you barely noticed?
The "Butterfly Effect", a concept from chaos theory, explains how a small event can eventually create a much larger outcome. While it's often used to describe complex systems like weather, the same principle applies surprisingly well to trading.
A single impulsive trade, a slightly larger position size, moving a stop-loss "just this once," or chasing a missed opportunity may seem insignificant in the moment. But these small actions can trigger a chain reaction—affecting your confidence, decision-making, discipline, and ultimately your long-term performance.
Successful traders rarely succeed because they make one extraordinary decision. They succeed because they consistently make hundreds of small, disciplined decisions that compound over time. Likewise, many trading accounts aren't destroyed by one catastrophic mistake—they gradually drift off course because of repeated "small exceptions" to the trading plan.
In this first edition of "Trading Decoded", we'll explore how tiny choices influence your trading journey, why consistency matters more than perfection, and how understanding the Butterfly Effect can help you build stronger habits and avoid costly psychological traps.
Sometimes, the smallest decision you make today becomes the reason for your biggest success—or your biggest regret—months from now.
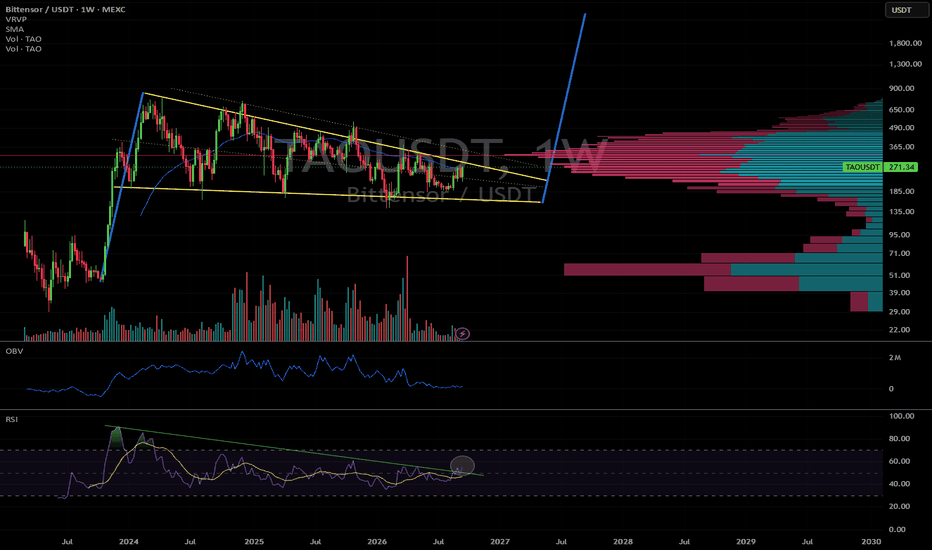
TAOUSDT: Bullish Push to 266?As the previous analysis worked exactly as predicted, BINANCE:TAOUSDT is eyeing a bullish continuation on the 4-hour chart , with price rebounding from support after recent consolidation, converging with a potential entry zone that could ignite strong upside momentum if buyers defend amid volatility. This setup suggests a powerful rally opportunity, targeting higher resistance levels with close to 1:4 risk-reward .🔥
Entry between 197–200 (entry from current price with proper risk management is recommended). Target at 266 . Set a stop loss at a daily close below 182.5 , yielding a risk-reward ratio of close to 1:4 . Monitor for confirmation via a bullish candle close above entry with rising volume, leveraging the pair's momentum near support.🌟
📝 Trade Setup
🎯 Entry (Long):
197 – 200
(Entry from current price is valid with proper position sizing and disciplined risk management.)
🎯 Target:
266
❌ Stop Loss:
• Daily close below 182.5
📈 Risk-to-Reward:
Approximately 1:4
💡 Will buyers successfully defend the 197–200 support zone and drive TAO toward 266, or will sellers break support and invalidate the bullish setup? 👇
memcoin PEPE price analysis🐸 What if CRYPTOCAP:PEPE delivered another rally like it did in 2024? 🙂
At this point, that still feels more like wishful thinking than a realistic base-case scenario.
For now, OKX:PEPEUSDT is approaching several important resistance levels. The first one sits around $0.0000035, followed by a much stronger resistance zone between $0.0000041 and $0.0000050. That's where buyers will face their first real test.
Even if CRYPTOCAP:PEPE manages to break through both resistance zones, the bigger picture wouldn't change much. The token would still be trading in the lower half of its long-term consolidation range, meaning a true bullish reversal would still require much more work.
Could CRYPTOCAP:PEPE eventually reach $0.0000140–0.0000160? We wouldn't completely rule it out, but under current market conditions that scenario still feels... a little insane. 😄
For now, we're much more interested in how price reacts around these nearby resistance levels. They'll tell us whether this is just another relief rally—or the beginning of something much bigger.
What do you think? Can OKX:PEPEUSDT repeat its legendary 2024 run, or has that chapter already been written?
______________
◆ Follow us ❤️ for daily crypto insights & updates!
🚀 Don’t miss out on important market moves
🧠 DYOR | This is not financial advice, just thinking out loud
BANK Showing Bearish Divergence – Is the Uptrend About to End?Technical Analysis
#BANK has been respecting a strong bullish market structure on the 30-minute timeframe, consistently forming Higher Highs (HH) and Higher Lows (HL). As long as this structure remains intact, the overall trend is still bullish.
However, I'm seeing an important warning signal that traders shouldn't ignore.
Bearish Divergence on Multiple Timeframes
A bearish RSI divergence has developed on both the 30-minute and 1-hour charts.
While price is making fresh highs, momentum is failing to confirm those highs. This often indicates that buying pressure is weakening and that a correction or trend reversal may be approaching.
Remember: Divergence is an early warning—not a confirmation to sell.
My Trading Plan
I will wait for price to confirm the bearish scenario before entering any position.
Entry Conditions:
A clean break below the previous Higher Low (HL).
A successful retest of the broken support as new resistance.
Bearish confirmation candle before execution.
Only after these conditions are met will I consider a short trade.
Risk Management
Entry: After confirmed HL breakdown and retest.
Stop Loss: Above the retest swing high.
Targets: Previous demand zones and key support levels.
Risk: Maximum 1% of account equity per trade with at least a 1:2 Risk-to-Reward Ratio.
Key Takeaway
Professional traders don't predict—they wait for confirmation.
The bearish divergence tells us momentum is fading, but the market structure break will determine whether sellers are truly taking control.
Patience creates high-probability trades.
What's Your View?
Do you think #BANK will:
Continue making new highs?
Break the Higher Low and begin a deeper correction?
Share your analysis in the comments! I enjoy discussing different market perspectives.
If you found this analysis valuable, please Boost, Like, Comment, and Follow for more high-probability setups based on Price Action, Market Structure, Fibonacci Confluence, and Risk Management.
Trade Smart. Stay Disciplined. Protect Your Capital.
#BANK #PriceAction #TechnicalAnalysis #RSI #BearishDivergence #MarketStructure #SupportAndResistance #SwingTrading #IntradayTrading #RiskManagement #TradingView #Stocks #ChartAnalysis #SmartMoney #TrendTrading