IOTA at macro floor: base recovery toward $0.0449The Macro Picture ๐บ๏ธ
IOTA unwound the entire move from the $0.07180 macro ceiling down to the $0.03407 floor and has stopped falling right on it. RSI is washed out near 38 and the selling has flattened โ exhaustion, not continuation.
The Setup โ๏ธ
The Accumulation Zone ๐ข
$0.03407โ0.03550 is where the selling has dried up. The macro floor has held, and this is the demand shelf a recovery would build from.
The Decision Point ๐ด
$0.06450 (Local High) is the bigger structural gate. Before it, the $0.04491 measured-move target is the first objective โ reclaiming it proves buyers are stepping back in.
The Roadmap ๐ฃ๏ธ
Hold the $0.03407 floor โ recover toward $0.04491 โ then work toward $0.06450. Invalidation is a clean daily close below $0.03407 โ that voids the accumulation thesis.
This is a textbook DCA Accumulation Zone setup: scale in across the $0.03407โ0.03550 band and let the base do the work.
More setups in profile.
#IOTA #crypto #trading #TA #3Commas #DCA
Crypto market
KAVA: local squeeze with $0.0508 destinationThe Macro Picture ๐บ๏ธ
KAVA rolled off the $0.06890 macro ceiling and settled into a base, with price now balancing at $0.04490 above the $0.03950 floor. RSI is curling back through 50 as the tape flattens and starts to turn.
The Setup โ๏ธ
The Range Floor ๐ข
$0.03950 (Macro Support) is the demand base. The June low was defended and price has built above it โ that's the floor this range pivots on.
The Decision Point ๐ด
$0.05172 (Local High) is the gate. The $0.05078 measured-move target sits right beneath it โ clearing that zone flips the local structure bullish.
The Roadmap ๐ฃ๏ธ
Hold the $0.03950 floor โ rotate up toward $0.05078 โ then challenge $0.05172. Invalidation is a clean daily close below $0.03950 โ that breaks the base.
This is a GRID Range Play: a defined band to rotate, buying the lower half and scaling out into strength.
More setups in profile.
#KAVA #crypto #trading #TA #3Commas #GRID
JASMY: local squeeze with $0.0058 destinationThe Macro Picture ๐บ๏ธ
After the May spike to $0.007809 faded, JASMY built a base in the lower range and is now grinding higher off it, with price at $0.004743 and RSI reclaiming 50. Momentum is starting to rotate back toward the buyers.
The Setup โ๏ธ
The Range Floor ๐ข
$0.004136 (Macro Support) is the demand base, with $0.004508 (Local Low) as the nearer shelf. Both have held, and that's the floor this range pivots on.
The Decision Point ๐ด
$0.006035 (Local High) is the gate. The $0.005810 measured-move target sits just under it โ clearing that zone flips the local structure bullish.
The Roadmap ๐ฃ๏ธ
Hold above $0.004508 โ rotate up toward $0.005810 โ then challenge $0.006035. Invalidation is a clean daily close below $0.004136 โ that breaks the base.
This is a GRID Range Play: a defined band to rotate, buying the lower half and scaling out into the breakout.
More setups in profile.
#JASMY #JasmyCoin #crypto #trading #TA #3Commas #GRID
FLOW at macro floor: base recovery toward $0.0296The Macro Picture ๐บ๏ธ
FLOW unwound from the $0.04675 macro ceiling all the way down to the $0.02451 floor and has stopped falling right on it. RSI is washed out near 38 and the selling has flattened โ the shape of exhaustion rather than continuation.
The Setup โ๏ธ
The Accumulation Zone ๐ข
$0.02451โ0.02521 is where the selling has dried up. The macro floor has held, and this is the demand shelf a recovery would build from.
The Decision Point ๐ด
$0.03223 (Local High) is the bigger structural gate. Before it, the $0.02955 measured-move target is the first objective โ reclaiming it proves buyers are stepping back in.
The Roadmap ๐ฃ๏ธ
Hold the $0.02451 floor โ recover toward $0.02955 โ then challenge $0.03223. Invalidation is a clean daily close below $0.02451 โ that voids the accumulation thesis.
This is a textbook DCA Accumulation Zone setup: scale in across the $0.02451โ0.02521 band and let the base do the work.
More setups in profile.
#FLOW #crypto #trading #TA #3Commas #DCA
AR: local squeeze with $2.28 destinationThe Macro Picture ๐บ๏ธ
AR rolled off the $2.794 macro ceiling and settled into a range, and price is now balancing at $1.864 above the $1.740 local low. The tape has flattened into a base โ a coin working off its downtrend rather than extending it.
The Setup โ๏ธ
The Range Floor ๐ข
$1.740 (Local Low) is the demand shelf. Buyers have defended it on each retest, and that's the floor this range pivots on.
The Decision Point ๐ด
$1.990 (Local High) is the gate. A daily close above it flips the local structure bullish and opens the path to the $2.282 measured-move target.
The Roadmap ๐ฃ๏ธ
Hold above $1.740 โ reclaim $1.990 โ run toward $2.282. Invalidation is a clean daily close below $1.740 โ that breaks the base.
This is a GRID Range Play: a defined $1.740โ1.990 band to rotate, buying the lower half and scaling out into the breakout.
More setups in profile.
#AR #Arweave #crypto #trading #TA #3Commas #GRID
DYDX: local squeeze with $0.168 destinationThe Macro Picture ๐บ๏ธ
DYDX has spent months rotating inside a broad range, and price has pulled back to $0.1217 โ right onto the $0.1103 local-low shelf, with the $0.0790 macro floor deeper below. The tape is compressing near range support as it waits for the next impulse.
The Setup โ๏ธ
The Range Floor ๐ข
$0.1103 (Local Low) is the immediate demand shelf; $0.0790 (Macro Support) is the deeper floor. Holding above $0.1103 keeps the base intact.
The Decision Point ๐ด
$0.1983 (Local High) is the gate that flips the bigger structure. Before it, the $0.168 measured-move target is the first real objective.
The Roadmap ๐ฃ๏ธ
Hold above $0.1103 โ reclaim through equilibrium โ run toward $0.168 โ then challenge $0.1983. Invalidation is a clean daily close below $0.1103, which reopens the $0.0790 macro floor.
This is a GRID Range Play: a defined band to rotate, buying the lower half and scaling out into strength.
More setups in profile.
#DYDX #crypto #trading #TA #3Commas #GRID
COMP: local squeeze with $19.67 destinationThe Macro Picture ๐บ๏ธ
COMP unwound from the $26 highs down to the $14.83 macro floor, then carved out a base and reclaimed ground to $16.81. Price is holding in the lower half of the range with RSI curling back above 50 โ the balance is starting to shift toward the buyers.
The Setup โ๏ธ
The Range Floor ๐ข
$14.83 (Macro Support) is the demand base, with $16.26 (Local Low) as the nearer shelf. Both have held on retest, and that's the floor this range pivots on.
The Decision Point ๐ด
$19.81 (Local High) is the gate. A daily close above it flips the local structure bullish; the $19.67 measured-move target sits right in that same zone.
The Roadmap ๐ฃ๏ธ
Hold above $16.26 โ grind through equilibrium โ reclaim the $19.67โ19.81 zone. Invalidation is a clean daily close below $14.83 โ that breaks the base.
This is a GRID Range Play: a defined band to rotate, buying the lower half and scaling out into the ceiling.
More setups in profile.
#COMP #Compound #crypto #trading #TA #3Commas #GRID
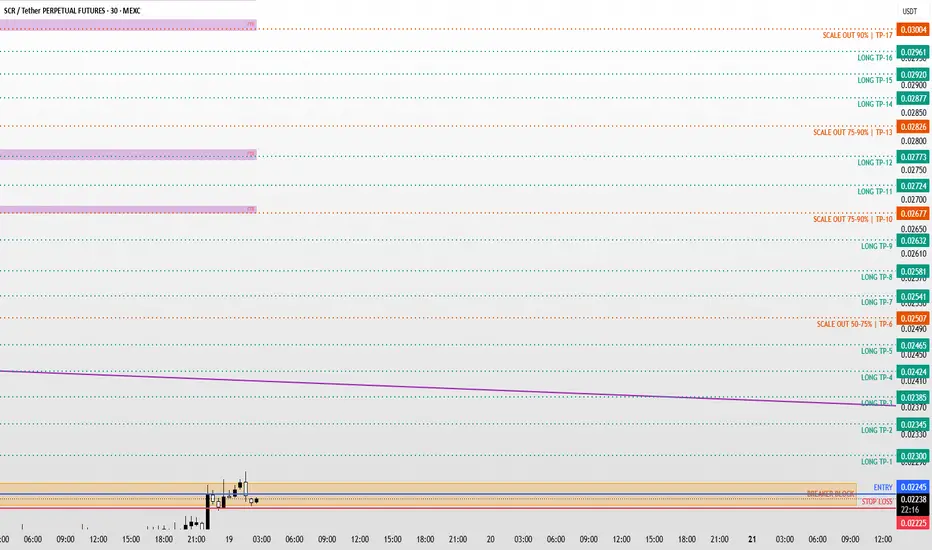
Gold xau long Roddy01-SIGNALSPROVIDERInstructions:
Entry point: yellow
Stop loss: red
Take profit: green
๐Leverage x 5-10-20 for crypto
๐Leverage x 20-50-100 for commodities, stocks, indices, and forex
๐Margin 1-5% max.
Always practice risk and money management.
Invest a maximum of 5% on any trade or across all your trades.
Invest only what you can afford to lose, as no one is in control of the market.
๐Our analyses are primarily based on:
breakouts: two trend lines (ascending and descending) and a line indicating a horizontal breakout.
chart patterns: shoulders and head, triangle parttern,ย elliott impulse, etc etc.
We don't always have the time to track them at all times or to represent them visibly, given the numerous signals, the number of channels to manage, and especially because of the often rapid pace of market movements.
indicators: We associate at least two indicators with this technique.
๐Depending on the circumstances, we use specific indicators, often setting 3 or more take profit levels.
๐Indeed, there are good days in trading and also bad days. No one can promise to win every trade, and like all traders worldwide, we also experience stop-loss orders. However, we win more than we lose and remain positive.
๐You can close the position before or after the take profit orders indicated by the green lines if you are personally satisfied; the same applies to stop loss orders.
๐We must stay positive, clear-headed, and humble.
we cannot provide all instructions or all trades here on this channel.
Good luck to us all, and may God guide us. Amen.
SILVER long Roddy01-SIGNALSPROVIDERInstructions:
Entry point: yellow
Stop loss: red
Take profit: green
๐Leverage x 5-10-20 for crypto
๐Leverage x 20-50-100 for commodities, stocks, indices, and forex
๐Margin 1-5% max.
Always practice risk and money management.
Invest a maximum of 5% on any trade or across all your trades.
Invest only what you can afford to lose, as no one is in control of the market.
๐Our analyses are primarily based on:
breakouts: two trend lines (ascending and descending) and a line indicating a horizontal breakout.
chart patterns: shoulders and head, triangle parttern,ย elliott impulse, etc etc.
We don't always have the time to track them at all times or to represent them visibly, given the numerous signals, the number of channels to manage, and especially because of the often rapid pace of market movements.
indicators: We associate at least two indicators with this technique.
๐Depending on the circumstances, we use specific indicators, often setting 3 or more take profit levels.
๐Indeed, there are good days in trading and also bad days. No one can promise to win every trade, and like all traders worldwide, we also experience stop-loss orders. However, we win more than we lose and remain positive.
๐You can close the position before or after the take profit orders indicated by the green lines if you are personally satisfied; the same applies to stop loss orders.
๐We must stay positive, clear-headed, and humble.
we cannot provide all instructions or all trades here on this channel.
Good luck to us all, and may God guide us. Amen.
Usoil short Roddy01-SIGNALSPROVIDERInstructions:
Entry point: yellow
Stop loss: red
Take profit: green
๐Leverage x 5-10-20 for crypto
๐Leverage x 20-50-100 for commodities, stocks, indices, and forex
๐Margin 1-5% max.
Always practice risk and money management.
Invest a maximum of 5% on any trade or across all your trades.
Invest only what you can afford to lose, as no one is in control of the market.
๐Our analyses are primarily based on:
breakouts: two trend lines (ascending and descending) and a line indicating a horizontal breakout.
chart patterns: shoulders and head, triangle parttern,ย elliott impulse, etc etc.
We don't always have the time to track them at all times or to represent them visibly, given the numerous signals, the number of channels to manage, and especially because of the often rapid pace of market movements.
indicators: We associate at least two indicators with this technique.
๐Depending on the circumstances, we use specific indicators, often setting 3 or more take profit levels.
๐Indeed, there are good days in trading and also bad days. No one can promise to win every trade, and like all traders worldwide, we also experience stop-loss orders. However, we win more than we lose and remain positive.
๐You can close the position before or after the take profit orders indicated by the green lines if you are personally satisfied; the same applies to stop loss orders.
๐We must stay positive, clear-headed, and humble.
we cannot provide all instructions or all trades here on this channel.
Good luck to us all, and may God guide us. Amen.
ukoil short Roddy01-SIGNALSPROVIDERInstructions:
Entry point: yellow
Stop loss: red
Take profit: green
๐Leverage x 5-10-20 for crypto
๐Leverage x 20-50-100 for commodities, stocks, indices, and forex
๐Margin 1-5% max.
Always practice risk and money management.
Invest a maximum of 5% on any trade or across all your trades.
Invest only what you can afford to lose, as no one is in control of the market.
๐Our analyses are primarily based on:
breakouts: two trend lines (ascending and descending) and a line indicating a horizontal breakout.
chart patterns: shoulders and head, triangle parttern,ย elliott impulse, etc etc.
We don't always have the time to track them at all times or to represent them visibly, given the numerous signals, the number of channels to manage, and especially because of the often rapid pace of market movements.
indicators: We associate at least two indicators with this technique.
๐Depending on the circumstances, we use specific indicators, often setting 3 or more take profit levels.
๐Indeed, there are good days in trading and also bad days. No one can promise to win every trade, and like all traders worldwide, we also experience stop-loss orders. However, we win more than we lose and remain positive.
๐You can close the position before or after the take profit orders indicated by the green lines if you are personally satisfied; the same applies to stop loss orders.
๐We must stay positive, clear-headed, and humble.
we cannot provide all instructions or all trades here on this channel.
Good luck to us all, and may God guide us. Amen.
litusdt shortInstructions:
Entry point: yellow
Stop loss: red
Take profit: green
๐Leverage x 5-10-20 for crypto
๐Leverage x 20-50-100 for commodities, stocks, indices, and forex
๐Margin 1-5% max.
Always practice risk and money management.
Invest a maximum of 5% on any trade or across all your trades.
Invest only what you can afford to lose, as no one is in control of the market.
๐Our analyses are primarily based on:
breakouts: two trend lines (ascending and descending) and a line indicating a horizontal breakout.
chart patterns: shoulders and head, triangle parttern,ย elliott impulse, etc etc.
We don't always have the time to track them at all times or to represent them visibly, given the numerous signals, the number of channels to manage, and especially because of the often rapid pace of market movements.
indicators: We associate at least two indicators with this technique.
๐Depending on the circumstances, we use specific indicators, often setting 3 or more take profit levels.
๐Indeed, there are good days in trading and also bad days. No one can promise to win every trade, and like all traders worldwide, we also experience stop-loss orders. However, we win more than we lose and remain positive.
๐You can close the position before or after the take profit orders indicated by the green lines if you are personally satisfied; the same applies to stop loss orders.
๐We must stay positive, clear-headed, and humble.
we cannot provide all instructions or all trades here on this channel.
Good luck to us all, and may God guide us. Amen.
SOL Weekly: PolyPredict Signals 74% Down ProbabilityWhile daily charts show a compression and retail sentiment leans heavily towards a bullish breakout, the underlying mathematical baseline suggests a different narrative.
The PolyPredict tracking engine has processed 140,529 individual data points and scanned 2,401 global news sources over the last 24 hours. The volume profile and macro indicators indicate that a sustained +15% upward push is highly improbable for this week's contracts.
Final Verdict: 74% mathematical probability for the DOWN contract.
Real-time calibration, historical validation scores, and live data shifts can be monitored directly via the platform link located on our profile page.
Bullish EMA Cross Trapped Under the 200: Fading the Bear RallyBINANCE:ETHUSDT
The 20 EMA just crossed above the 50 EMA on the daily โ normally a bullish signal. But context kills it. Price is printing this crossover ~17% below the 200 EMA ($2,200), deep inside a macro downtrend that's been in control since late April.
This is a bear rally, not a trend reversal.
๐ Setup:
After dropping from $2,700 to $1,500 in MayโJune, ETH bounced sharply. The 20/50 crossover confirms short-term momentum โ but it's happening under heavy overhead resistance with the 200 EMA acting as a ceiling miles above.
๐ Entry: $1,855 (current price, rejection zone)
๐ Stop Loss: $1,950 (above recent swing high)
๐ฏ TP1: $1,665 (2:1 R:R)
๐ฏ TP2: $1,500 (June lows retest)
๐ Risk-to-Reward: 1:2 โ 1:3.7
Why I'm bearish despite the crossover:
The 200 EMA at $2,200 is the trend filter โ price isn't even close. The June bounce recovered 50% of the drop but stalled at $1,900 resistance. Volume is thinning on the push higher. Bullish crossovers under the 200 EMA have a high failure rate in macro downtrends โ they trap longs before the next leg down.
Key support to watch: $1,750 (consolidation) โ $1,500 (June low) โ $1,380 if the floor breaks.
What's your read โ relief rally or genuine reversal? Drop your analysis below. ๐
โ ๏ธ Not financial advice. Always manage your risk.
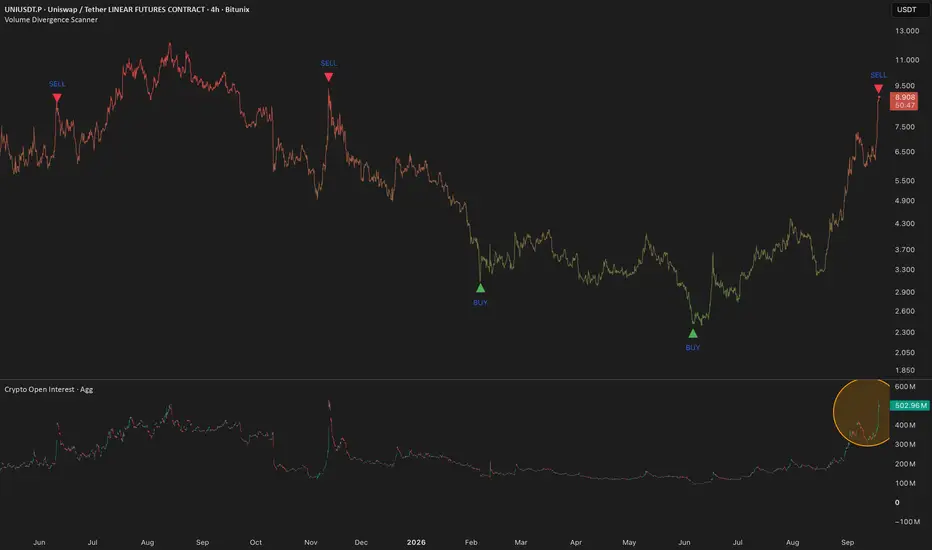
$UNIUSDT Update (12H)UNIUSDT Update (12H)
Everyone is looking at the recent pullback, but for me, the bigger picture hasn't changed yet. Price is still trading above the main ascending trendline, and the green demand zone around $3.00โ$3.20 remains the key area to watch. As long as this zone holds and buyers step back in, I still see room for another push toward $3.68, with $4.00 becoming the next major target if that resistance is broken.
Right now, I'm not chasing entries in the middle of the range. I want to see a proper reaction from support first. If the market loses the trendline and closes below the demand zone, this bullish idea becomes much weaker, and I'll wait for a new setup instead.
THE WHITE BULL - LEVI > 4 Hours Chart๐ง Keep it on watch. Momentum shifting.
THE WHITE BULL - LEVI - Is it finally time for some GREEN candles? Opinions?
Lets share any opinions
โ ๏ธ Disclosures:
This analysis is for informational purposes only and is not financial advice. It does not constitute a recommendation to buy, sell, or trade any securities, cryptocurrencies, or stocks. Trading involves significant risk, and you should consult with a qualified financial advisor before making any investment decisions. Past performance is not indicative of future results.
LLong
BTC/USDT (1D): Testing Resistance | SuperTrend & 200 EMAIn this daily analysis of Bitcoin (BTC/USDT), we take a look at the current price action relative to key trend indicators and key resistance zones.
Key Technical Factors:
SuperTrend Indicator:
The SuperTrend flipped bearish in late May/early June after the strong drop from the $70k+ levels. The red trailing stop level currently sits around $66,000, acting as immediate dynamic resistance.
Order Book Volume Ratio (OB Volume):
At the current level, sell volume dominance is showing around 89% vs. 13% buy volume, highlighting significant selling pressure right near this dynamic SuperTrend resistance.
Recovery Zone (70k โ 73k):
If BTC manages to break and hold above the current red SuperTrend line (~$66,000), the next major target area lies within the Recovery Zone ($70,000 โ $73,000), which corresponds to the base of the previous major breakdown.
200 EMA:
The 200-day Exponential Moving Average is currently sloping downward above the price, adding a layer of long-term dynamic resistance above the 73k mark.
Scenario Breakdown:
Bearish / Rejection Scenario:
As long as price remains capped under the $66,000 SuperTrend line and heavy selling volume persists, a rejection back toward local support levels ($60,000 โ $58,000) remains a strong possibility.
Bullish Confirmation:
A daily candle close above $66,000 would invalidate the short-term bearish SuperTrend and open up a potential move toward the $70,000 โ $73,000 Recovery Zone.
Disclaimer: This analysis is for educational purposes only and does not constitute financial advice. Always manage your risk according to your trading strategy.
OPUSDT - Bear Flag, Bearish Continuation Approaching?๐ Technical Analysis
๐ต Coin: TSE:OP #OPUSDT
โณ Time Frame: 1D
๐ Pattern: ๐ฉ Bear Flag (Bearish Continuation Pattern)
๐ OPUSDT is currently forming a ๐ฉ Bear Flag after experiencing a strong bearish decline (Flagpole). The price is now moving in an upward consolidation phase, forming the Flag, but it has yet to change the overall market structure to bullish.
โ ๏ธ As long as the price remains inside the Bear Flag, the probability of a continuation to the downside remains higher.
---
๐ Pattern Overview
๐ฉ A Bear Flag is a bearish continuation pattern that forms after a strong downward move (Flagpole), followed by a temporary upward consolidation that creates the Flag.
๐ This pattern indicates that the recent upward movement is likely just a temporary correction, while selling pressure continues to dominate the market.
โ ๏ธ If the price successfully breaks down below the pattern's support, it could confirm the continuation of the existing downtrend.
---
๐ป Bearish Scenario (Higher Probability)
๐ด A breakdown below the Bear Flag support, confirmed by a strong daily candle and increasing volume, would validate the bearish continuation.
๐ฏ The first downside target is around the 0.0885 support level.
๐ If selling pressure continues to increase, OPUSDT could extend its decline toward lower support zones based on the Bear Flag projection.
๐จ As long as the price remains below the Bear Flag resistance, the overall market structure stays bearish.
---
๐ Bullish Scenario
๐ข A bullish scenario becomes possible only if the price holds above the Bear Flag support and rebounds with increasing buying volume.
โ
A stronger bullish confirmation would occur if the price breaks out above the Bear Flag resistance and successfully flips it into support.
๐ If the breakout is sustained, bullish momentum could strengthen, allowing the price to test the next resistance levels.
---
๐ฏ Conclusion
๐ Overall, the OPUSDT market structure remains bearish, as the price is forming a ๐ฉ Bear Flag following a strong bearish impulse.
๐ The Bear Flag support is the key level to watch.
๐ป A breakdown would confirm the continuation of the downtrend.
๐บ A breakout above the Bear Flag resistance would be the primary signal to invalidate the bearish outlook.
โ ๏ธ Always wait for candle confirmation and volume confirmation before making any trading decisions.
---
> โ ๏ธ Disclaimer: This analysis is for educational purposes only and should not be considered financial advice. Always Do Your Own Research (DYOR) and practice proper risk management.
#OPUSDT #OP #Crypto #CryptoTrading #TechnicalAnalysis #PriceAction #ChartAnalysis #TradingView #Altcoins #Binance #BearFlag #Bearish #BearishContinuation #Support #Resistance #Breakdown #CryptoSignals #SwingTrading #MarketAnalysis #DYOR
$BTCUSDT Descending Channel BreakoutBTCUSDT is trading on the 1D timeframe within a descending channel, where price has been respecting both the upper and lower trendlines visible on the chart.
The current price is trading around 64.2K, attempting to recover from the lower boundary of the channel. This area is important because it may determine whether the recent rebound develops into a stronger move.
Key levels to watch:
Support: Around 57.8K, near the recent swing low and lower channel boundary.
Resistance: The upper descending trendline around 65Kโ66K, followed by the projected resistance near 70.3K.
A daily close above the upper channel trendline could serve as a breakout confirmation. If confirmed, the chart projects a potential move toward approximately 70.3K, representing an advance of roughly 9โ10% from the current price zone.
If price fails to break above the descending channel and moves back below the recent higher lows, the bullish setup could weaken, with the lower channel support remaining the key area to monitor.
This analysis is based solely on the price structure shown on the chart and is intended for educational purposes. Always watch for confirmation before considering any trading decision.
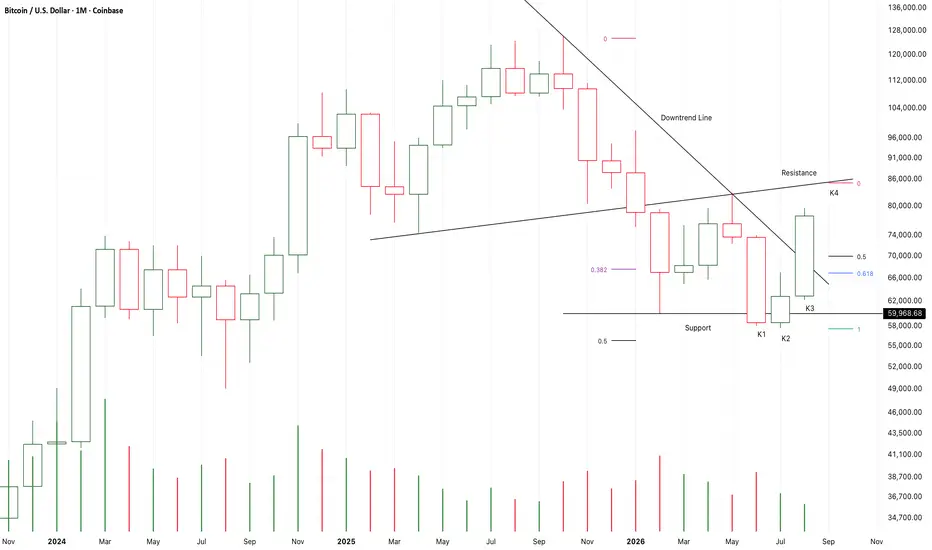
BTC Daily prints Higher HighHere is the Bitcoin daily chart, told simply.
The fall. Bitcoin topped near $82,800 in May and slid for weeks. The slide ended at $57,756 in late June.
The bounce. Price has climbed back to about $64,800. And something changed on the way up. For the first time since the May top, the daily chart printed a higher high: the recent push to $65,566 beat the early-July high of $64,688.
What the chart calls this: an expanding market. A new higher high up top, while the old June low still stands far below. In plain words, the downtrend stopped making progress and the range got wider. That is a fight between buyers and sellers, not a settled trend.
Under the hood, the rally so far is mostly bears giving up. Traders who bet on lower prices are closing those bets. Fresh buying has not shown up in force yet. Leverage in the system is calm and funding is neutral, so nobody is over-extended in either direction.
The spring. The trend-strength meter (ADX) is low and coiling. When a market goes this quiet, a big move usually follows. The meter does not say which way.
The levels that matter. Above: $65,567 โ break and hold it, and buyers take real control for the first time since May. Underneath: about $63,700, the daily average price, which was a ceiling all the way down and is now the first floor. The line in the sand: $57,756, the June low. As long as it holds, the bottom is in place.
One caution: price is a little stretched above its short-term balance point right now, so some chop or a dip toward $63,700 would be normal, not a failure.
The bigger picture: the weekly trend is still down. This bounce has something to prove. Above $65,567 it starts proving it. Rejected there, it is just a bounce inside a downtrend, and patience wins.
Not financial advice. Just one chart, read out loud.
MINA / MINAUSDT Bullish Setup | Futures Trade IdeaMARKET ANALYSIS
MINA is currently reacting from a key technical area highlighted on the chart.
As long as the protected support zone remains intact, the bullish market structure remains valid and higher liquidity targets may continue to attract price action.
A breakdown below the invalidation level would weaken the current bullish scenario and require a reassessment of market conditions.
๐ Entry, Stop Loss and Take Profit levels are marked directly on the chart.
โโโโโโโโโโโโโโ
โ ๏ธ DISCLAIMER
This publication is provided solely for educational and market observation purposes.
Nothing contained in this analysis should be considered financial advice, investment advice, or a recommendation to buy or sell any financial instrument.
All trading and investment decisions remain solely the responsibility of the individual trader.
Always conduct your own research and apply proper risk management before entering any position.
โโโโโโโโโโโโโโ
๐ฏ PARALOG
โช๏ธCrypto Market Analysis
โช๏ธBTC Futures Signals
โช๏ธBitcoin & Altcoin Market Analysis
Precision โข Momentum โข Timing
โโโโโโโโโโโโโโ
Exchange: #MEXC Futures
#bitcoin #btc #crypto #futures #technicalanalysis
Punt of the Month: SKR Weekly Bottoming StructureSKR, the token powering the Solana Mobile Seeker ecosystem, is forming a bottom on the weekly chart after an extended decline.
Price is beginning to stabilise around the current lows, creating a possible accumulation zone for a higher-risk, mid-term position. The fundamental thesis centres on SKRโs utility across the ecosystem for the Saga and Seeker crypto-phones, including its decentralised app marketplace and growing DeFi integration.
The initial upside target is approximately $0.017. This is firmly a speculative punt rather than a confirmed reversal, so gradual accumulation and controlled position sizing are advised.