16 Practical Elliott Wave Guidelines Every Trader Should KnowElliott Wave Theory can help traders understand market structure, identify impulsive and corrective phases, and frame potential entry and exit areas. However, Elliott Wave counts are not always straightforward, wave counts can change as new price action develops.
Here are 16 practical guidelines that can make Elliott Wave analysis easier to understand and apply.
1. Understand the Tradable Waves
The main waves that traders generally focus on are Wave 1, Wave 3, Wave 5, and Wave C .
Waves 1, 3 and 5 are impulsive movements, while Wave C is part of a corrective structure. These waves can provide opportunities to analyze trends and potential trade setups.
2. Wave 3 Is Usually the Most Powerful Wave
Wave 3 is typically the strongest and most dynamic wave of an Elliott Wave impulse.
It often develops with:
Strong price momentum
Increased trading activity
Greater participation from traders
Stronger momentum readings
Wave 3 should not be the shortest of Waves 1, 3 and 5.
3. Impulsive Waves Usually Contain Five Smaller Waves
Waves 1, 3 and 5 normally develop into five smaller waves: 1 → 2 → 3 → 4 → 5
Most corrections within these structures tend to appear as A-B-C patterns , although markets can also produce more complex or irregular corrections.
4. Wave 5 Can Show Less Volume Than Wave 3
It is common for Wave 5 to develop with lower volume than Wave 3 , even though price may continue moving in the same direction.
Therefore, lower volume during Wave 5 does not automatically mean that the trend has already ended.
5. Wave 5 Can Fail
Not every Wave 5 necessarily moves beyond the high or low established by Wave 3.
A failed fifth wave , sometimes called a truncated fifth, can result in a double-top or double-bottom type structure rather than a new extreme.
This is one reason traders should avoid assuming that price must always make a new high or low during Wave 5.
6. Combine Elliott Wave With Other Trading Evidence
Elliott Wave should preferably be used as part of a broader trading framework rather than as a standalone signal. For example, traders can combine wave analysis with:
Price action
Support and resistance
Fibonacci levels
Volume
Momentum indicators
Moving averages
Other objective trading signals
The goal is to build a grounded trading assessment rather than relying solely on a subjective wave count.
7. Be Patient With Wave 4 Corrections
Wave 4 can be particularly difficult to trade because corrections can become complicated.
A useful guideline is to look for the correction to develop clearly into an A-B-C structure before assuming Wave 4 has ended.
Fibonacci retracement levels can also provide useful reference points. The original guideline highlights the 38.2%–61.8% retracement zone between Waves 2 and 3 as an area traders may monitor.
Wave B is commonly discussed as a retracement of Wave A and generally should not exceed the beginning of Wave A in a normal corrective structure.
8. Simple Wave 2 Often Leads to a More Complex Wave 4
One useful Elliott Wave concept is alternation .
If Wave 2 is relatively simple, for example, a straightforward correction, Wave 4 may develop into a more complicated correction.
Conversely, if Wave 2 is complex, Wave 4 may be relatively simple.
This is a guideline rather than a guarantee.
9. Wave 2 Retracement Statistics
Wave 2 commonly retraces a portion of Wave 1. The statistics presented in the source suggest that:
About 12% of Wave 2 corrections retrace less than 38% of Wave 1.
Around 73% occur between approximately 50% and 60% retracement.
Around 15% retrace beyond 62% .
These figures should be treated as statistical guidelines, not fixed rules. Actual market behavior can differ considerably.
10. Wave 3 Can Extend Significantly
Wave 3 can sometimes become much larger than Wave 1. The referenced statistics describe three broad possibilities:
45% : approximately 1.6–1.75 × Wave 1
30% : approximately 1.75–2.62 × Wave 1
15% : approximately 1.0–1.6 × Wave 1
8% : greater than 2.62 × Wave 1
The important takeaway is that Wave 3 can extend considerably , so traders should avoid assuming that a strong Wave 3 movement must end after reaching a small predefined target.
11. Wave 4 Commonly Retraces Part of Wave 3
Wave 4 is another corrective phase. The statistics in the source indicate that Wave 4 frequently retraces approximately:
30%–50% of Wave 3
A smaller portion may retrace around 24%–30%
Another portion may retrace approximately 50%–62%
These levels can be used as areas of interest, rather than automatic entry or exit signals.
12. Use Fibonacci Extensions for Wave 5
Wave 5 can sometimes be estimated using Fibonacci extension calculations .
A commonly monitored range is approximately: 1.0–1.62 × the distance from the beginning of Wave 1 to the end of Wave 3
However, Wave 5 can also extend further, so Fibonacci projections should be treated as potential zones rather than guaranteed targets.
13. Manage Risk When Trading a Potential Wave 5
If a trader identifies a potential Wave 5 setup after a Wave 4 correction, Fibonacci retracement levels can help define the risk.
For example, if the Wave 4 correction appears around the 38.2% or 50% retracement area, a trader may monitor the 61.8% level as an important invalidation/risk reference.
Most importantly: Position size should be adjusted according to the distance to the stop-loss.
Once the Wave 5 structure becomes more convincing, additional confirmation from other trading signals can be considered.
14. Trade in the Direction of the Larger Wave Structure
A useful principle is to align trades with the direction of the primary wave structure.
For example, traders may focus on setups that agree with the direction of: Wave 1 → Wave 3 → Wave 5 → Wave C
on the timeframe being analyzed.
This can help prevent taking trades that conflict with the broader market structure.
15. Use a Higher Timeframe for Confirmation
Wave analysis can become more reliable when the larger timeframe supports the same directional structure.
One approach is to examine a timeframe one Fibonacci degree higher than the trading timeframe. For example:
Lower timeframe: identifying the trade setup
Higher timeframe: checking whether the broader wave direction agrees
This multi-timeframe approach can help filter some conflicting signals.
16. Elliott Wave Counts Can Change
This may be the most important guideline of all : An Elliott Wave count is an interpretation of current market structure. As price develops, what initially appears to be one wave can sometimes become another wave structure.
For example, a correction that appears to be Wave 4 may continue beyond the expected level and force the trader to reconsider the count.
Therefore: Never let a wave count override your risk-management rules.
Always define your invalidation level and respect your stop-loss. If the market proves the original wave count wrong, the trader should be prepared to revise the analysis.
👋 Do you use Elliott Wave analysis in your trading? Which guideline do you find most useful? Share your thoughts in the comments. ❤  Education
 Long
Long
BTCUSDT: Daily seller pressure and local H1 scenariosOn the daily BTCUSDT chart, sellers still hold the initiative. A seller initiative has formed, and the key IC is also a seller candle.
Price has approached the daily support at 75,545, while the Target of the current initiative is 61,306.84. For this reason, buying on the daily timeframe remains risky for now: the broader context still favors sellers.
The hourly chart looks more interesting. Two local scenarios can be considered here.
Buyer scenario: to look for long opportunities, it is important to see price reclaim 77,343, then break and hold above 78,250. The next important area is 79,485, while the local target is around 80,000. The green area on the chart marks the zone where buyer confirmation can be monitored.
Seller scenario: if price fails to recover and sellers gain acceptance below the 76,306–75,545 area, this could create an opportunity to look for further downside continuation. The next important level below is the monthly level at 74,092.
So, on H1 there are possible scenarios in both directions, but the higher-timeframe context remains important: on D1, the preference is still with sellers for now. Both scenarios and the areas where confirmation can be monitored are marked on the chart.
Profitable trades!
This analysis is based on the Initiative Analysis (IA) method.  Short
Short
 Long
Long
Long 
Senate crypto clarity bill fails cloture vote, bitcoin slidesBTCUSD | 4H Technical Analysis — Sep 16, 2026
Bitcoin is under pressure after the US Senate failed to advance the Digital Asset Market Clarity Act, the comprehensive crypto market structure bill the industry has spent years lobbying for. A procedural vote to bring the bill to the floor fell short 49 to 50, well below the 60 votes needed for cloture, plunging crypto-related stocks including Coinbase and reigniting uncertainty over whether the CFTC will ever gain the unified regulatory authority the industry has been seeking.
The sell-off was compounded by broad risk aversion ahead of tomorrow's FOMC rate decision, with markets reluctant to add risk into a binary macro event on top of the fresh regulatory setback.
BTCUSD spent nearly three months, June through mid-August, chopping in a wide 58,000 to 67,000 range before a sharp spike in late August drove price directly to 70,000 and beyond, clearing the entire range in a matter of days. That move extended into early September, with price tagging a high near 82,000 before rolling over into a descending channel that has been in place ever since. The channel's upper boundary has capped every bounce near 80,000 to 82,000, while the lower boundary running through 74,300 has held on each retest so far.
Price is now trading around 76,000, with the fast EMA at 77,055 just below the slow EMA at 77,626, a mildly bearish signal that reflects the stalling momentum since the early September peak. RSI has fallen to 36.72, its lowest reading since the pre-breakout consolidation in July and August, showing the Senate news and FOMC anxiety are actively pressuring price rather than just causing a pause.
The 74,300 level is the one that matters most right now. It is both the descending channel's lower trendline and the same shelf that has provided support on at least two prior tests since the channel formed, making it the clearest line between an orderly pullback and a deeper breakdown back toward the August range.
Key levels to watch:
Resistance: 78,000 (recently lost support) / 82,000 (early September high) / 86,000
Support: 74,300 (channel lower trendline, prior support) / 72,500 / 70,000 (breakout level from the August range)
Bear case: The failed Clarity Act vote removes a key regulatory tailwind the market had been pricing in, and with the FOMC decision still pending tomorrow, positioning is likely to stay defensive. A break below 74,300 would confirm the descending channel is resolving lower rather than consolidating, opening a retest of 70,000 and potentially the top of the old 60,000 to 67,000 range if risk sentiment deteriorates further around the rate decision.
Bull case: The Clarity Act failure was a procedural setback, not a permanent rejection, and legislative efforts of this kind typically get reintroduced rather than abandoned outright. If the FOMC decision tomorrow leans dovish or simply removes uncertainty, a bounce off 74,300 back above 78,000 would suggest the pullback was sentiment-driven rather than structural, keeping the broader uptrend from the August breakout intact.
Bias is neutral to cautiously bearish while price holds below 78,000, with the FOMC decision tomorrow the more immediate catalyst than the crypto-specific regulatory news. The descending channel and falling RSI both argue for near-term weakness, but 74,300 has held before and remains the level that decides whether this is a routine pullback within an uptrend or the start of a larger correction back toward the summer range.
BTCUSDT 5m - Higher lows into accumulation range below 76300 resStructure and order-block analysis combining a supply zone at the breakdown origin, a liquidity-sweep low, and a rising higher-low sequence within an accumulation range to frame a long setup against nearby resistance.
Context: price staged a sharp breakdown between 17:35 and 18:45, falling from the 76500-77350 zone into a capitulation candle with a volume spike near 75061-74955, then stabilized and printed a sequence of rising lows at 75130, 75555 and 75809.
Key levels: the 76522-77349 zone marks the origin supply area of the breakdown, the 74955-75260 zone is the liquidity-sweep low, and the 75809-76114 range is the current accumulation zone sitting just under the 76300 resistance that previously rejected price twice.
Scenario: bias favors longs on a hold of the accumulation range, entry near 75920, stop below the latest higher low at 75800, target at the 76300 resistance shelf for a reward-to-risk near 3.2.
Invalidation: a close back below 75800 breaks the higher-low sequence and negates the bullish base, opening room back toward the 75130 swing low.
Analysis timeframe: M5, chart displayed on M15.
Educational chart analysis only, not financial advice. Long 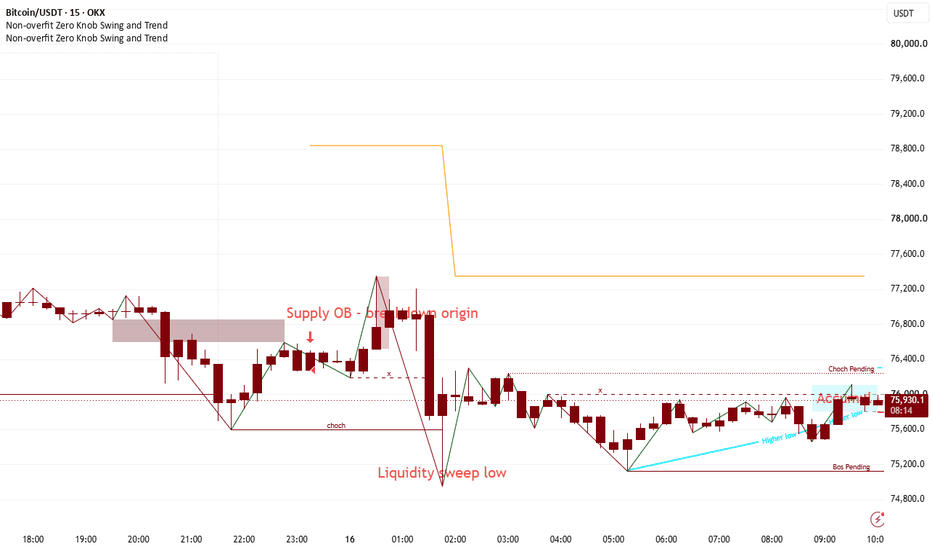
VANA Descending Trendline Under Pressure, Breakout or Rejection?📊 Technical Analysis — VANA/USDT
⏳ Time Frame: 4D
📌 Pattern: Descending Trendline / Downtrend Structure
💰 Price on the chart: around 0.90 USDT
🔻 Visible Low: around 0.815 USDT
---
📉 Descending Trendline Structure
🔻 The VANA/USDT chart shows a clear long-term downtrend structure, characterized by a series of lower highs connected by a descending trendline since early 2025.
📉 As long as price remains below the Descending Trendline, bearish pressure remains dominant from a structural perspective.
⚠️ However, as price moves closer to the end of this structure, it becomes increasingly important to watch whether a breakout occurs or whether price is rejected again from the trendline.
---
🟡 Key Support Areas
📍 0.815 USDT represents an important low area on the chart.
🟢 As long as this area holds, there is potential for a higher low to form and for an accumulation phase to develop before another breakout attempt.
🔴 If 0.815 USDT is broken with strong selling pressure, the developing bullish structure could fail, and price may continue searching for lower support levels.
---
🟢 BULLISH SCENARIO
🚀 Main confirmation: Price successfully breaks above the Descending Trendline with a strong 4D candle.
📈 A trendline breakout would indicate that long-term bearish pressure is beginning to weaken.
🔄 Ideally, after the breakout, price performs a retest of the trendline from above and successfully holds the area as support.
🎯 If the breakout is confirmed, the following chart levels can be monitored:
1️⃣ 1.05 USDT — First transitional resistance/support
2️⃣ 1.21 USDT — Next resistance
3️⃣ 1.63 USDT — Important resistance
4️⃣ 2.17 USDT — Major resistance
5️⃣ 2.61 USDT — Upper resistance target marked on the chart
🔥 If momentum continues to develop and price successfully breaks through each resistance level progressively, the 1.63–2.61 USDT zone becomes an area worth monitoring.
⚠️ These targets do not guarantee that price will reach them. The validity of the bullish scenario still depends on the breakout, volume, retest, and price's ability to hold the levels that have been broken.
---
🔴 BEARISH SCENARIO
⚠️ The bearish scenario remains valid as long as price has not successfully broken out and held above the Descending Trendline.
📉 If price reaches the trendline again and experiences a rejection, sellers could regain control.
🔻 If price loses the 1.05 USDT support, bearish pressure could increase again, potentially leading to a retest of the 0.90 USDT area.
🚨 If 0.90 USDT fails to hold, attention shifts toward 0.815 USDT, which is an important low on the chart.
💥 A break below 0.815 USDT would indicate that the bearish structure remains intact and would further weaken the bullish breakout scenario.
---
🧩 Pattern Explanation
📐 A Descending Trendline forms when price continuously creates lower highs, allowing a downward-sloping trendline to be drawn.
🐻 This pattern reflects seller dominance during the period being analyzed.
🔓 An upward breakout of the trendline can indicate a potential structural change if followed by strong confirmation.
🔄 Meanwhile, a rejection from the trendline indicates that the trendline is still acting as dynamic resistance.
💡 Since this chart uses the 4D time frame, the breakout should not be judged solely by a wick moving above the line. A 4D candle close above the trendline followed by a successful retest would provide stronger structural confirmation.
---
🎯 CONCLUSION
📉 Current structure: Still bearish because price remains below the Descending Trendline.
👀 Key levels: 0.815 → 0.90 → 1.05 → 1.21 → 1.63 → 2.17 → 2.61 USDT
🚀 Bullish: Breakout + 4D close above the Descending Trendline → successful retest → next resistance levels come into focus.
🔴 Bearish: Rejection from the trendline → loss of support → potential retest of 0.815 USDT.
⏳ VANA is currently in an interesting area to monitor as price approaches the key dynamic resistance. Price's reaction to the Descending Trendline will be one of the important factors in determining the next potential move.
#VANA #VANAUSDT #VANAAnalysi  Long
Long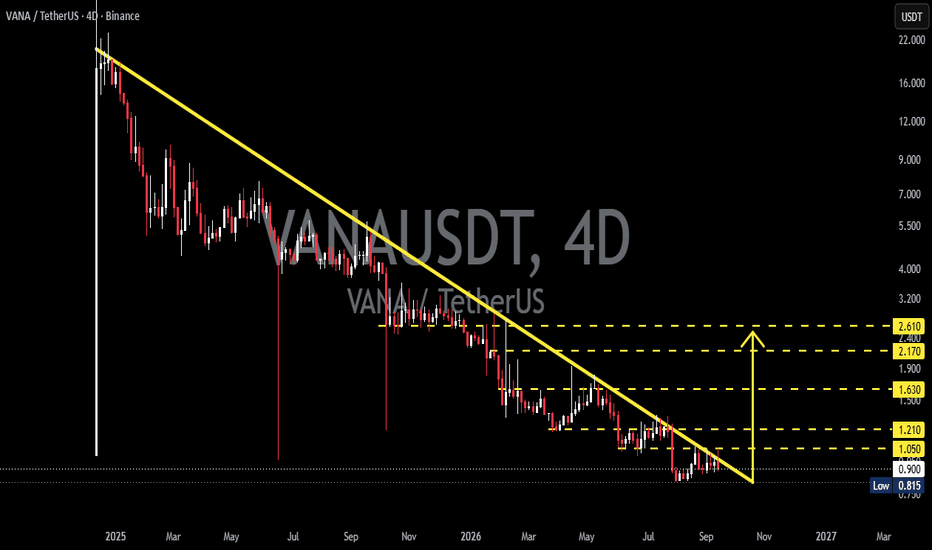
 Long
Long
BTCUSDT: Price Downward, Bears in ControlBTCUSDT is trading around 77,300 USDT and remains firmly within a descending channel.
Despite multiple attempts to rebound, the price has failed to break the structure of lower highs and continues to fluctuate below the EMA89 (near 77,830), indicating that buying pressure is insufficient to reverse the short-term trend.
The 77,500–78,000 range is the area I am watching most closely. It serves as a "Sell Zone" and represents a confluence of the EMA and the upper boundary of the descending channel. If BTC rallies to this zone but faces rejection, there is a high probability of a pullback to 76,500, followed by an extension toward the primary target near 75,500 USDT.
Early-week macroeconomic conditions also lean toward a "risk-off" sentiment. Brent crude has risen nearly 3% due to supply concerns in the Middle East, while the market is pricing in an approximately 86% probability of a 25bp Fed rate hike this week. US Treasury yields remain elevated, exerting further pressure on crypto and risk assets.
The bearish scenario would be invalidated if BTC breaks out of the channel and holds firmly above the 78,300–78,500 level. Short 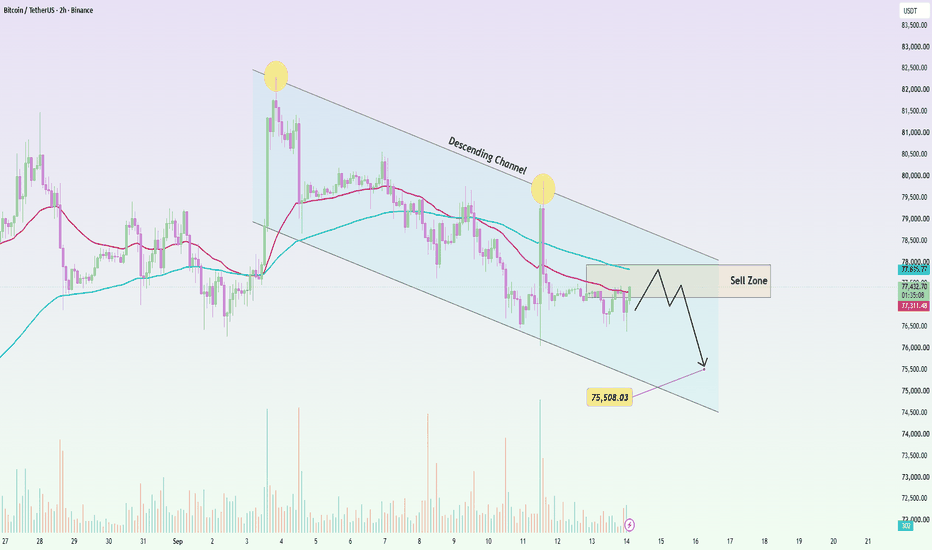
 Short
Short
Long 
 Short
Short
USDT.D - Clarity Failed but Cash Succeeded With today's CLARITY Act not passing in the Senate, uncertainty and risk have entered the market once again. When this happens, one of my favorite things to check is stablecoin dominance, specifically Tether dominance (USDT.D), since it remains by far the largest stablecoin by marketcap.
Reviewing the Last Idea
To begin, I recommend going back through some of my recent USDT.D posts, but I want to build directly off this one:
In that post, I was pointing out how Tether dominance had reclaimed the channel, suggesting more cash was about to be deployed into the crypto markets, pushing USDT.D lower. Since then, things have changed, and I want to outline exactly what that looks like now.
The Primary Channel
First, take a look at this parallel channel. I have been tracking this structure since April of this year:
This channel has done a phenomenal job marking significant highs and lows, and what it has just done structurally is important to pay close attention to.
Dominance first broke back into the channel, after trading above it for a while, on August 21, 2026. USDT.D respected being back within the channel boundary, with several daily rejections below its upper line. Then, right at the beginning of September, USDT.D attempted to break back above the channel but failed, resuming respect for the upper boundary as resistance once again.
However, on September 9, 2026, something changed. Dominance decisively broke out back above the channel, and for the past week USDT.D has used the upper boundary of the parallel channel as a launching point to move to the upside.
What This Means Going Forward
Therefore, market participants are likely to continue this momentum by converting crypto back into cash. Given this breakout, the move will bring USDT.D back toward my green line around 8.15% to 8.25%. It is difficult to say exactly where this would put Bitcoin, but it would most likely be sub $70,000, so stay very vigilant heading into this.
Why the Structure Supports This Move
Another reason this breakout looks compelling for Tether dominance is where the recent lows formed. Many of those lows occurred right around old resistance from November 2021 (red arrow), which has now flipped into new support around the 6.75% dominance level (green arrows).
The MACD is also looking very strong and is likely to have a similar move to the two previous moves I have outlined with black arrows.
From a structural perspective, this setup looks strong for a push back toward the levels outlined above. The FOMC decision is tomorrow, so brace for significant volatility.
 Long
Long
BTC Holds the Line — Is $82K Next?BTC/USD currently looks more like a consolidation above support than the beginning of a deeper decline. After repeatedly testing the 76,000–77,000 area, price has been quickly pushed back up each time — a sign that buyers are still actively absorbing selling pressure at lower levels.
More importantly, the recent pullbacks have yet to break the key H4 support zone. Price is trading around the Ichimoku Cloud and continues to attract buying interest whenever it approaches the lower end of the structure. This type of price action suggests that BTC may be compressing inside a broader range rather than developing a new bearish trend. If buyers manage to reclaim the area above the Ichimoku Cloud, recovery momentum could accelerate quickly.
However, the macro backdrop remains a major obstacle. Expectations of a Fed rate hike following hotter-than-expected U.S. inflation, elevated Treasury yields, and weaker Bitcoin ETF flows have all been putting pressure on risk assets. As a result, any BTC rally ahead of the FOMC decision could still come with sharp volatility and short-term pullbacks.
If BTC continues to hold the 76,000–77,000 support zone, I expect price to have a chance to recover toward the major resistance area around 81,500–82,000. This will be the real test for buyers — only a decisive break above this zone would open the door to a larger bullish move. Long 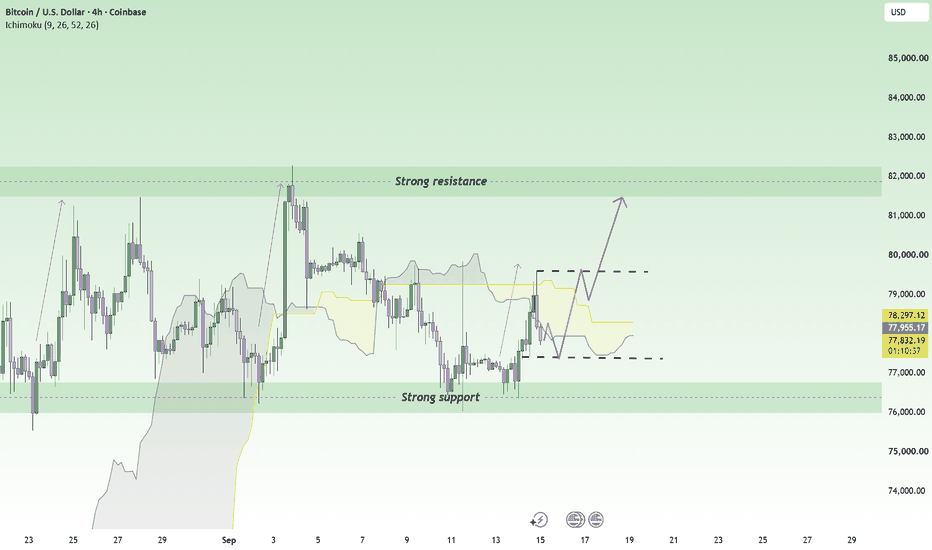
Short 
ETH - Last Line of Defense at $2,355 Right now, ETH bulls are facing their last line of defense at $2,355. If this level is lost, ETH could see a rapid decline of 10% or more. Let me explain.
First, what even is this $2,355 level? It comes from the 3-day chart, where it acted as the primary resistance sellers defended before ETH crashed down to the $1,500 low. For reference on how important that level was historically, view this idea:
Now that price is trading above it, buyers have been using this old resistance as a new level of support. This is clearly visible in ETH's recent lows on Coinbase. The first low after the major pump was established on August 23rd around $2,355.82. Then on September 2nd, price created a double bottom at $2,355.20. Today, with the CLARITY Act failing, ETH reached a low of $2,356.82, giving ETH a current triple bottom structure right at this level.
However, if price cannot continue holding these lows, there is very little support between here and $2,150. If that level is reached, it becomes increasingly likely ETH goes lower still, something I will address in a future post if that scenario develops.
The Trendline That Has Called Every Top
Now for the real substance of this post. Let's dive into the black trendline and all the red X's outlined on the chart. This is arguably the most important thing to watch on ETH's daily timeframe, and it is likely to remain significant for the rest of this market cycle.
I have this trendline drawn from the beginning of February 2026, and it has played the most significant role in marking ETH's tops throughout this entire price range. This is not a random line drawn after the fact. It is one I have been tracking and referencing for months. If you are surprised by how many times ETH has topped at this exact trendline, I highly recommend going back and reviewing some of my past work where it was outlined in real time.
I first identified this trendline on May 5th as the upper boundary of a rising wedge scenario:
It then reappeared as the top of a bear flag I outlined here:
I extended it again to project where a local high was likely to form as ETH was rallying sharply to the upside in this idea:
And finally, I extended both trendlines forward to current price action in this idea:
Why the Break Would Be So Important
This is incredible market structure to see developing, because it strongly suggests this trendline reflects a level algorithmic and institutional players are actively using as a decision point. The more times a level gets respected without breaking, the more significant the eventual break becomes, since it likely triggers a wave of stop losses and trapped short positions all at once once it finally gives way. Because this trendline has correctly called nearly every one of ETH's local tops since February, a daily close above it would represent a genuine and clear shift in trend direction. Once that close occurs, it becomes highly likely that the true bull market for ETH has begun.
So although the short term outlook does not look great if $2,355 breaks, keep a close eye on that upper trendline. Once it finally breaks, that is when it will be time to celebrate. I have also added all of the Fibonnaci levels for the current trend to watch if price does start dropping to the downside.
I hope this brings you some educational value today. Bitcoin at the Breaking PointAfter pushing up toward $79,852, BTC was rejected and has been working its way lower. On the 1-hour chart, price has now reached the 0.618 Fibonacci area, with $74,887 sitting underneath as the key support level.
This is where things get interesting.
If $74,887 holds, I’d be watching to see if Bitcoin can stabilize and work its way back toward $77,800, which is an important resistance area. A reclaim there could put the recent highs back into focus.
But if $74,887 breaks and fails to recover, the chart opens up toward $73,100 first, with the deeper Fibonacci extension sitting around $69,200.
For me, this is less about guessing the next move and more about watching how price reacts at these levels.
Support holds → watch the reaction.
Support fails → watch the downside targets.
 Long
Long