Long
Long
BTC/USD: Descending Trendline Breakout targeting $85,000Overview
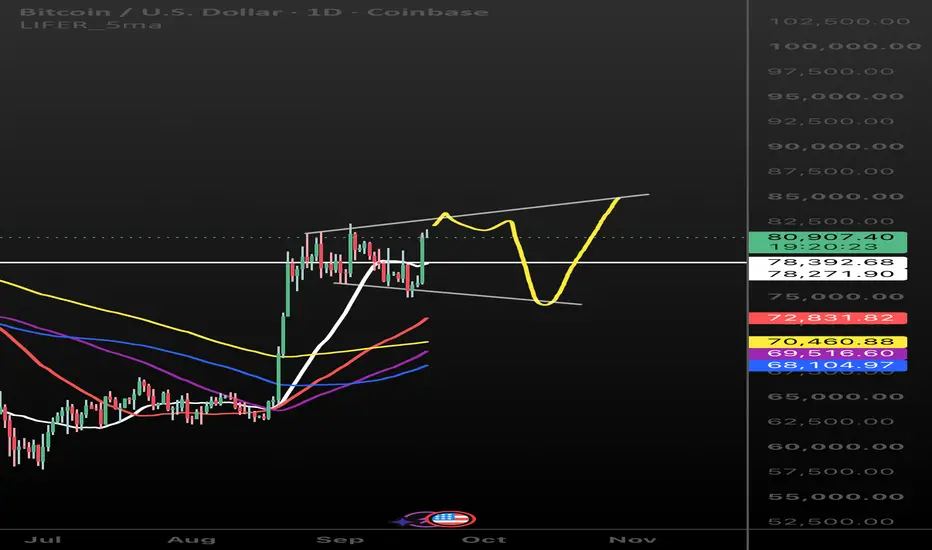
Bitcoin ( BITSTAMP:BTCUSD ) on the 4-hour chart has broken out above a key descending trendline and reclaimed the major $81,000–$81,500 horizontal resistance zone. Price action is currently consolidating just above the breakout point, setting up two high-probability paths toward the major upside target at $85,000.
Technical Analysis Breakdown
1. Trendline Breakout & Consolidation
Descending Trendline Break: Bitcoin held dynamic resistance along a clear downward trendline throughout early September. The recent explosive bullish candle broke decisively above this line, indicating a shift in short-term market momentum.
100 EMA Support Dynamic: The 100-period Exponential Moving Average (100 EMA) provided continuous dynamic support during the recent mid-September dip near $76,200 (highlighted by the lower green circle), acting as a launchpad for the current leg upward.
2. Key Price Levels & Structure
Resistance Reclaimed as Support ($81,000 – $81,500): This gray box previously served as significant horizontal resistance and temporary support in late August and early September. Price is currently testing this zone from above.
Major Retest Zone ($78,000 – $79,000): Located near the conjunction of the 100 EMA and the top side of the broken descending trendline, this region represents a high-confluence pullback zone.
Key Invalidation / Major Support ($76,273): The recent local low near $76,270 marks the critical structural invalidation level for bullish setups.
Trade Scenarios & Potential Execution
Scenario A : Direct Continuation
Setup: Continuous 4-hour closes above $81,500 confirm immediate buying pressure without a deep pull back.
Target: $85,000 horizontal resistance.
Scenario B : Trendline & Horizontal Retest (High-Probability Entry)
Setup: A temporary corrective dip back into the Trendline Retest Zone ($78,000 – $79,000) to collect liquidity and confirm the broken trendline as new support.
Entry Region: $78,000 – $79,000 (watch for bullish reversal patterns on lower timeframes like 1h or 15m).
Target: $85,000
Stop Loss / Invalidation: Acceptance below $76,273.
Fundamental Context
Macroeconomic Drivers: Recent adjustments in interest rate policy by the Federal Reserve and fluctuating global liquidity have led to short liquidations, driving momentum across high-beta crypto assets.
Institutional & ETF Dynamics: Crypto markets continue to navigate shifts in spot ETF demand and regulatory discussions, contributing to heightened volatility around major technical thresholds.
Market Sentiment: A sustained push above $81,500 shifts near-term market sentiment back toward greed, encouraging sidelined capital to re-enter on healthy pullbacks.
Disclaimer
This trading idea is provided for informational and educational purposes only and does not constitute financial, investment, or trading advice. Cryptocurrency trading involves substantial risk of financial loss. Always practice strict risk management, use stop-loss orders, and do your own research (DYOR) before executing any trading plan.  Long
Long
BTCUSD Daily: Base Built, Now Testing the 83K Wallwww.tradingview.com
This is the Bitcoin / USD daily chart (Bitstamp, 19 Sep 2026). Price is currently around 81,469. After a roughly 55% fall from the Oct 2025 peak, Bitcoin swept the sell-side liquidity, built a base, and broke out. It has pulled back into a fair value gap (FVG) and bounced, and it is now pressing against the first major resistance. All levels below are my approximate readings from the chart, so small deviations are possible.
1. Big picture (Sep 2025 to now)
Oct 2025: Bitcoin peaked near 126,000, the all-time high on this chart. The buy-side liquidity line sits at this level, about 126,500.
Nov 2025: A sharp drop was followed by a lower high near 116,000 (POI 3), then a slide to a low near 80,500 in late Nov. The high-to-lower-high pattern marks the start of the downtrend.
Dec 2025 to Jan 2026: A bounce reached about 97,000 and was rejected. The analyst labels this area a "big whales liquidity inject", meaning large players sold into the rally.
Feb 2026: A heavy crash took price to about 58,500, wiping out most of the gains made since 2024.
Feb to Apr: Price ranged in the 62,000 to 70,000 area, then rallied through spring.
May 2026: The rally topped near 83,000 and was rejected. This is the second "liquidity inject" label, and it is the level now called POI 1.
Jun 2026: Price dropped again to about 57,000, slightly below the Feb low. That swept the sell-side liquidity resting under the earlier lows and marked the bottom of this cycle so far.
Jul to mid-Aug: Price moved sideways in a tight range (about 60,000 to 66,000) inside the sell-side liquidity zone. This looks like accumulation.
Late Aug: A strong impulsive candle took price from about 65,000 to the mid-70,000s in one move. This left the FVG, and the rally continued to a high near 83,000 in early Sep.
Mid-Sep: Price pulled back into the FVG, bottoming near 75,500, then bounced sharply to the current 81,469.
2. Key levels
Upside (POIs, points of interest):
POI 1, around 83,000: the May high and the Sep high, a double top so far. This is the immediate resistance and the key level right now.
POI 2, around 98,000: the Jan 2026 rejection zone.
Strong POI, around 107,500: an older support from Sep to Oct 2025 that broke in Nov and has become resistance. The analyst marks it as strong because it is a major supply zone.
POI 3, around 116,000: the Nov 2025 lower high.
Buy Side Liquidity, around 126,000 and above: the Oct 2025 all-time high.
Downside:
FVG zone (pink box), roughly 73,000 to 76,000: the imbalance from the Aug breakout, and the first strong support. It already produced a bounce in Sep.
Around 80,500 (the Nov 2025 low) is a minor level just below price. Old support often turns into resistance, so it is worth watching.
Sell Side Liquidity zone, roughly 58,000 to 63,000: the base of the whole structure, with the Feb and Jun lows.
3. Structure read
Trendline: The HTF Resistance Trendline runs from the Oct 2025 peak down through the lower highs. By my reading, price moved above it around spring and has stayed above since. The Jun low landed roughly where the extended line sits, so it looks like a retest that held.
Short term: Bullish. Price made a higher low in Sep (about 75,500, above the Jul lows in the low-60,000s) and is again pushing toward the highs. The FVG was respected.
Medium term: Not yet confirmed. The May and Sep highs both sit at about 83,000, so this is a potential double top until a daily close above it. Price is also still far below the 97,000 to 126,000 supply area, and the Jun low was slightly lower than the Feb low, so the bottom is a sweep rather than a clean higher low.
Bias: Cautiously bullish above 75,000, with the real confirmation being a daily close above 83,000.
4. Liquidity logic on the chart
The analyst's core idea is that price moves between liquidity pools. Sell-side liquidity below (58,000 to 63,000) was swept and price reacted upward, which suggests smart money accumulated there. Now price is reaching for buy-side liquidity above, first equal highs at 83,000, then the older supply zones, and eventually the 126,000 high. The "whales liquidity inject" labels mark places where large sellers previously absorbed demand, so 83,000 may see a similar reaction again.
5. Scenarios
Bullish scenario (the analyst's path):
Price closes above 83,000 on the daily and holds it as support.
The first target is 98,000 (POI 2), about 20% above the current price. The chart expects a small pullback around 93,000 after that.
Then 107,500 (Strong POI), followed by another shallow pullback near 105,000.
The final projected target is the buy-side liquidity at 126,000+. This is the chart's most ambitious leg and would take a lot of time and momentum.
Pullback scenario:
Price is rejected at 83,000 (double top) and falls back.
First support is the FVG (73,000 to 76,000). A hold there sets up another attempt higher.
A daily close below about 73,000 breaks the FVG and weakens the bullish idea. The next area is the range around 65,000, then the 58,000 to 63,000 sell-side zone. A break of the June low near 57,000 would invalidate the whole base-building structure.
6. What to watch
Daily close above or below 83,000.
Whether the 73,000 to 76,000 FVG keeps holding on dips.
Reaction near 80,500, the old Nov low.
Volume on the breakout, since a break without volume is more likely to fail.
7. Summary
Bitcoin has done what a base-and-breakout structure usually does: swept the lows, ranged, broke out with an impulsive leg, and retested the FVG. Momentum is currently bullish, with price at 81,469 only about 2% below POI 1. But 83,000 has already rejected price twice, and the larger downtrend has not been fully reversed until price reclaims the higher supply zones. A close above 83,000 would be the first real confirmation, and the FVG is the key support. Crypto is very volatile, and the 126,000 target is a long-term projection, not a base case.  Long
Long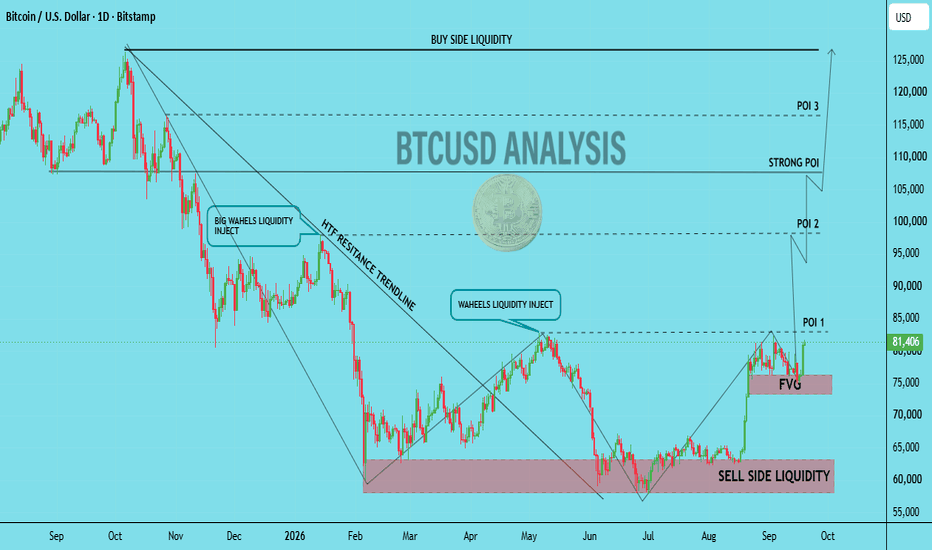
Supply Reaction Setup | BTCUSD 19/09Bitcoin has made a strong recovery from the 75,000–76,000 H4 OB and is now trading around 81,200, directly inside the 80,800–82,000 Strong Supply Zone. The latest market data also shows BTC around $81.3K after a sharp recovery, while the 80K–82K region is being watched as a major resistance cluster.
🔍 H4 Structure
The recovery has been aggressive, but price is now reaching the upper boundary of the marked H4 structure.
The key question for today's session is whether BTC can hold above 80,800 and continue toward 82,000, or whether this supply zone produces a clear rejection.
My primary scenario is a reaction from 80,800–82,000 followed by a retracement toward 76,000.
📍 Main POI
80,800–82,000 Strong Supply Zone
This is the only area I want to use for the main setup.
🎯 Trading Plan
Entry: 80,800–81,800
SL: 82,400
TP1: 78,600
Main TP: 76,000
Extended TP: 71,500
I would wait for MSS + bearish displacement inside the supply zone before taking the setup.
🧭 Today's Expected Path
81,200 → 81,500–82,000 → rejection → 78,600 → 76,000
The 78,600 area is the first reaction level. If price breaks through it with strong displacement, the next major objective is the 75,000–76,000 H4 OB.
The deeper projection toward 71,500 becomes relevant only after 76,000 is clearly lost.
❌ Invalidation
H4 acceptance above 82,400 invalidates the setup.
If BTC establishes H4 acceptance above this level, I would stop looking for the projected downside move from the current supply zone.
🧠 Bias
Bearish reaction from 80,800–82,000, while the immediate price path can still push higher toward 82,000 before confirmation.
The setup is therefore:
Recovery → Supply test → MSS → Displacement → 78,600 → 76,000 Short 
Short 
Long 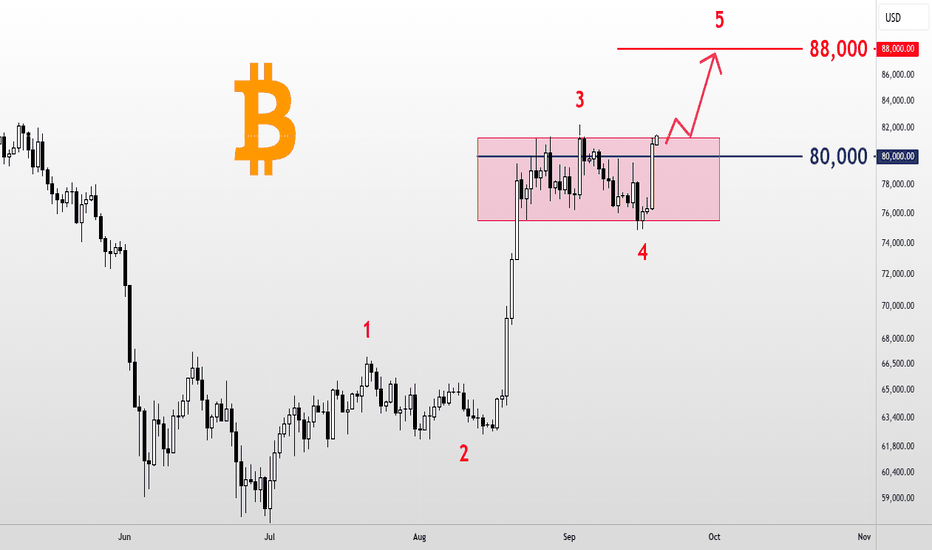
 Long
Long
 Long
Long
 Long
Long
 Long
Long
Bitcoin Daily | The Structure Is Still the Story⏱️ Reading time: About 3 minutes
On the Bitcoin Daily chart, the main question for us is not simply whether price is going up or down.
The more important question is:
What is the current structure telling us?
From the major low marked on the chart, Bitcoin has developed a significant upward move. Now, we are watching one of the most important structural decision points in the market.
Scenario 1: Bullish Case
In the bullish scenario, the current upward move could be part of a larger impulsive structure.
First, we want to see this current structure develop and eventually complete. After that, a correction would be normal.
A correction does not automatically mean that the bullish structure has failed.
If the correction is followed by another impulsive move, a Leading Diagonal, or even a smaller nested 1–2 structure, that could provide important evidence for further upside.
The area around $126,255–$126,272 is especially important.
A valid break above this area could provide the first meaningful confirmation of the bullish scenario.
If the structure continues to support this scenario, the next structural targets shown on the chart are:
$168,628 → $195,184 → $237,116
These are not predictions or guarantees.
They are simply potential structural targets based on the current Elliott Wave scenario.
Scenario 2: Bearish Case
The bearish scenario is still possible.
If the current upward move fails to develop into a valid impulsive structure, and price begins forming another corrective structure, this could mean that the current rally is only part of a larger correction.
In that case, the 50%–61.8% retracement area becomes important, followed by the 61.8%–78.6% zone.
And there is one important point to remember:
One five-wave move alone is not enough to confirm a bullish trend.
For us, the sequence is more important:
Impulse → Correction → New Impulse
If this sequence develops according to Elliott Wave rules and guidelines, the bullish scenario becomes stronger.
If it doesn't, we simply reassess the structure and allow the market to show us what comes next.
The $15,479 level remains our major bullish invalidation level on this chart.
So as long as the larger structure continues to respect this level, the broader bullish possibility remains structurally valid.
And perhaps the most important idea is this:
We don't try to force the market to fit our count.
We adjust our count to fit the market.
Patterns whisper. I listen.
— Mr. Nobody 🎧📊
Bitcoin
Jun 22, 2023
Strong bullish cryptocurrency market???YES
Long 
Entry Price Planning - Trading Profit SecretA good trade can become a bad trade simply because of where you enter. The problem is that direction alone does not make a good trade. Entry price matters too.
1. The Same Idea Can Produce Two Very Different Trades
Imagine your BTC plan says the ideal entry is around 76,726, but price suddenly starts moving and you chase it around 77,236.
The market direction has not changed. Your analysis may still be correct. But your trade has changed.
You are now paying a higher price, your Stop Loss may need more room, and the distance to your target has become smaller. In other words, your risk-to-reward just got worse before the trade even started.
That is why I prefer to define the entry before the move happens.
2. Plan the Price Before Emotion Arrives
Before entering, I want three levels clear:
Entry: Where does the setup actually become attractive?
Invalidation: Where is the idea clearly wrong?
Target: Where is the next logical area to take profit?
Once those levels are defined, I do not need to make decisions while a large green candle is moving.
For example:
Planned Entry → 76,700
Stop → 75,900
Target → 79,500
Now the trade can be evaluated before execution. If price runs away without giving the entry, I simply miss the trade.
Missing a trade is usually cheaper than chasing one.
3. A Better Price Improves More Than Profit
A planned entry can improve the trade in several ways. You may get a tighter logical stop, better risk-to-reward and less emotional pressure after entering.
This is why experienced traders often wait for:
Pullbacks, retests, support reactions or limit-entry zones
instead of buying after an explosive candle.
The goal is not to find the absolute lowest price. The goal is to enter where risk and potential reward make sense together.
4. When I Refuse to Chase
If price has already moved far beyond my planned area, I ask one question:
“Would I still take this trade if I had not seen the previous move?”
If the answer is no, I leave it.
There will always be another BTC breakout, another Gold pullback and another Forex setup.
Good trading is not about participating in every move. It is about participating when the price is good enough for the risk you are taking.
The Simple Rule
My execution process is:
Plan the Entry → Define the Stop → Check Risk/Reward → Execute → Do Not Chase
Sometimes a limit order will never be filled. That is normal.
The purpose of entry planning is not to guarantee a trade. It is to prevent FOMO from turning a good analysis into a poor execution.
A profitable idea still needs a good price. Education 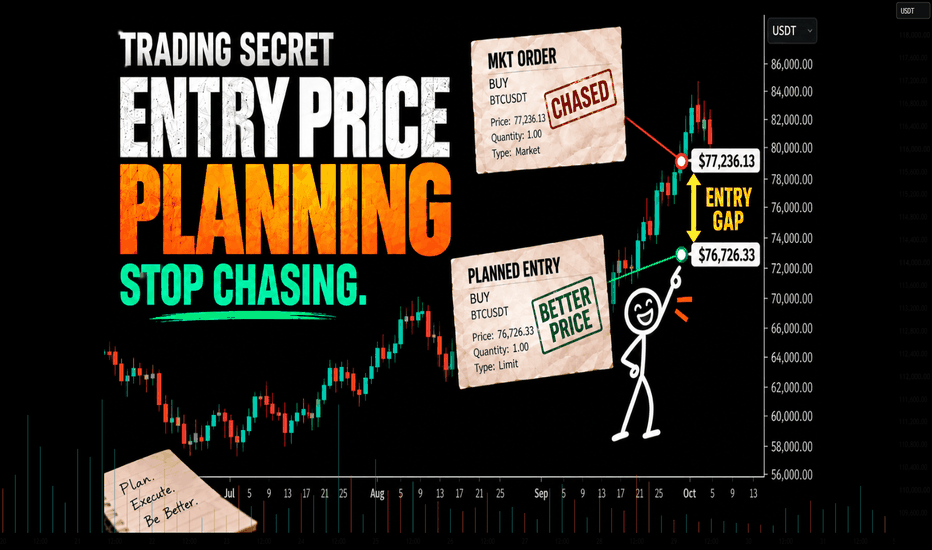
Long 
 Long
Long
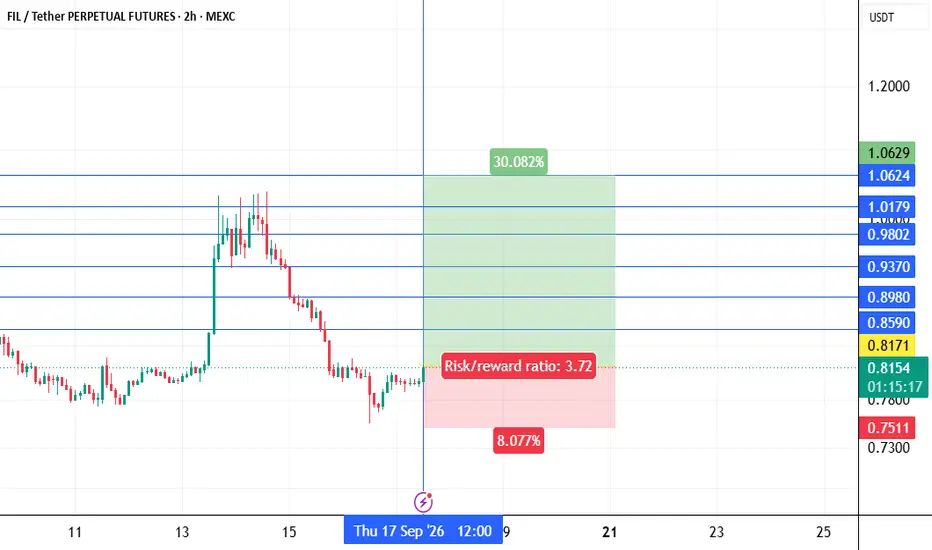
filusdt longInstructions:
Entry point: yellow
Stop loss: red
Take profit: green or blue
👉Leverage x 5-10-20 for crypto
👉Leverage x 20-50-100 for commodities, stocks, indices, and forex
👉Margin 1-5% max.
Always practice risk and money management.
Invest a maximum of 5% on any trade or across all your trades.
Invest only what you can afford to lose, as no one is in control of the market.
👉Our analyses are primarily based on:
breakouts: two trend lines (ascending and descending) and a line indicating a horizontal breakout.
chart patterns: shoulders and head, triangle parttern, elliott impulse, etc etc.
We don't always have the time to track them at all times or to represent them visibly, given the numerous signals, the number of channels to manage, and especially because of the often rapid pace of market movements.
indicators: We associate at least two indicators with this technique.
👉Depending on the circumstances, we use specific indicators, often setting 3 or more take profit levels.
👉Indeed, there are good days in trading and also bad days. No one can promise to win every trade, and like all traders worldwide, we also experience stop-loss orders. However, we win more than we lose and remain positive.
👉You can close the position before or after the take profit orders indicated by the green lines if you are personally satisfied; the same applies to stop loss orders.
👉We must stay positive, clear-headed, and humble.
We must stay courageous and, above all, prudent regarding market reversals that no one can control
👉we cannot provide all instructions or all trades here on this channel.
such as:
⚡Move your stoploss
⚡Put B.E (break even)
⚡re-entering the trade at the same entry point or lower.
⚡recovery signals provided in the event of—or following—a stop-loss (SL) hit.
⚡personalized discussions, instructions, and answers.
⚡revealing our high-performance indicators and teaching you how to configure and use them.
Good luck to us all, and may God guide us. Amen.  Long
Long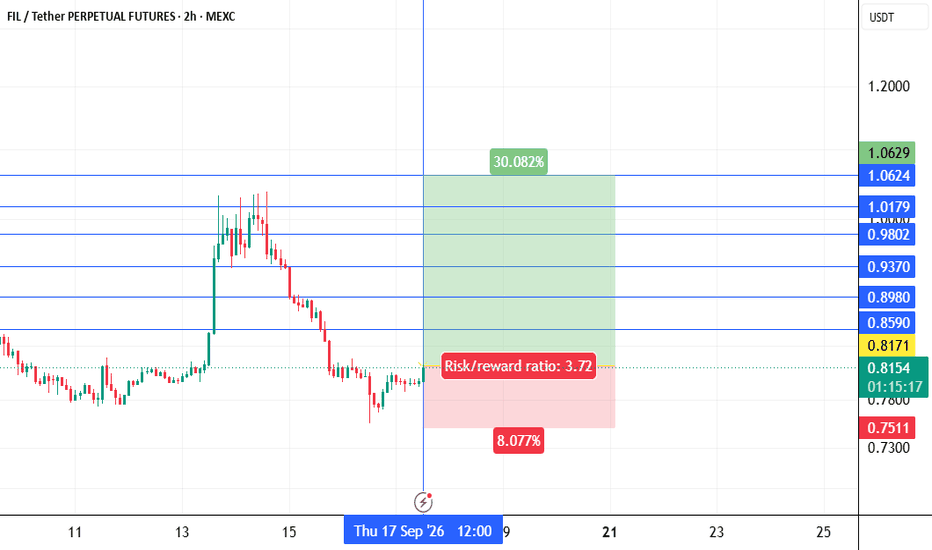
 Long
Long
BTC - The trendline is dead. The ceiling is next.₿ HELLO, BITCOINERS! 🚀🔥
Welcome to our very first BTC post!
Bitcoin is sitting around $81K, and things are getting interesting. 👀
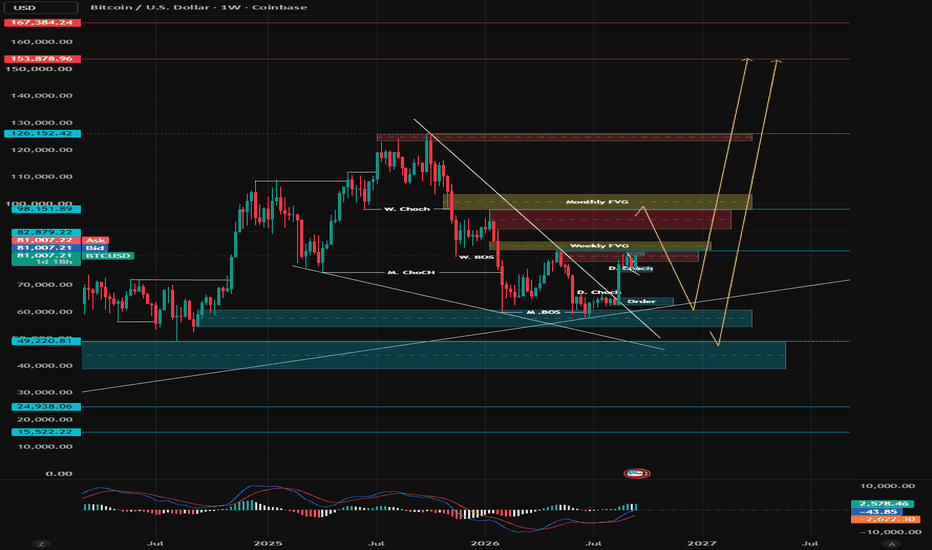
Lower timeframes have turned strongly bullish after breaking the descending structure, but BTC has now pushed straight into a major higher-timeframe supply zone / Weekly FVG. ⚠️
At the same time, the regulatory picture is mixed:
🏛️ CLARITY Act stalled in the Senate
⚖️ SEC continues pushing forward with crypto regulation and tokenization initiatives
So regulation remains a volatility catalyst, but the chart still decides the trade.
🟣 MONTHLY
Recovery from $58K–$60K has been impressive, but BTC is now moving into premium territory.
Key upside zones:
🔴 $81K–$86K — Weekly FVG / Resistance
🔴 $90K–$97K — Major Supply
🟡 $98K–$104K — Monthly FVG
The recovery is real, but the macro structure is not fully reclaimed yet.
🔵 WEEKLY
Weekly structure looks much stronger. 💪
BTC has:
✅ Held $58K–$60K demand
✅ Reclaimed $62K–$65K Order Block
✅ Broken above $74K–$76K
Now we are attacking:
🚨 $81K–$83K
🎯 $84K–$86K Weekly FVG
A strong Weekly close above $82.9K would strengthen the bullish continuation case.
🟢 DAILY
Daily is currently the strongest timeframe.
BTC has:
✅ Printed a Daily CHoCH
✅ Broken the descending trendline
✅ Produced strong displacement
✅ Reclaimed $78K–$79K
✅ Attacked $81K
So:
🟢 Structure = Bullish
🔴 Location = Expensive
This is why I would NOT chase BTC blindly at $81K. 👀
🟢 4H
Bulls are firmly in control.
The move from - $76K → $81K
has been strong, but BTC is now sitting in buy-side liquidity. 💦
So we watching for:
🐂 Break → Retest → Continuation
OR
🐻 Liquidity Sweep → Bearish CHoCH → Retracement
🟢 1H
Still bullish, but momentum is starting to cool.
Immediate battlefield:
⚔️ $80K–$82K
A liquidity sweep above the highs before a retracement would not surprise me.
🎯 TWO MAIN SCENARIOS
🐂 BULLISH CONTINUATION
If BTC breaks and holds above $81K–$82.9K:
🎯 $84K–$86K
🎯 $90K–$94K
🎯 $98K
🔥 $100K–$104K
🐻 LIQUIDITY RAID / RETRACEMENT
If BTC sweeps $81K–$82K+ and then prints a bearish 1H/4H CHoCH:
🎯 $79K
🎯 $77K–$76K
🎯 $75K
A deeper warning would come if BTC starts losing $74K–$75K on higher-timeframe closes. 🚨
🧠 BOTTOM LINE
BTC is bullish on the lower timeframes, but price is now sitting directly inside higher-timeframe supply and liquidity.
So no chasing.
💦 Watch liquidity
📊 Respect structure
⚡ Wait for confirmation
🎯 Execute the setup
Break & Retest = Continuation
Sweep & CHoCH = Retracement
LET PRICE TELL THE STORY. 😎🔥
#BTC #BITCOIN #CRYPTO #SMC #Liquidity #CHoCH #PriceAction Long