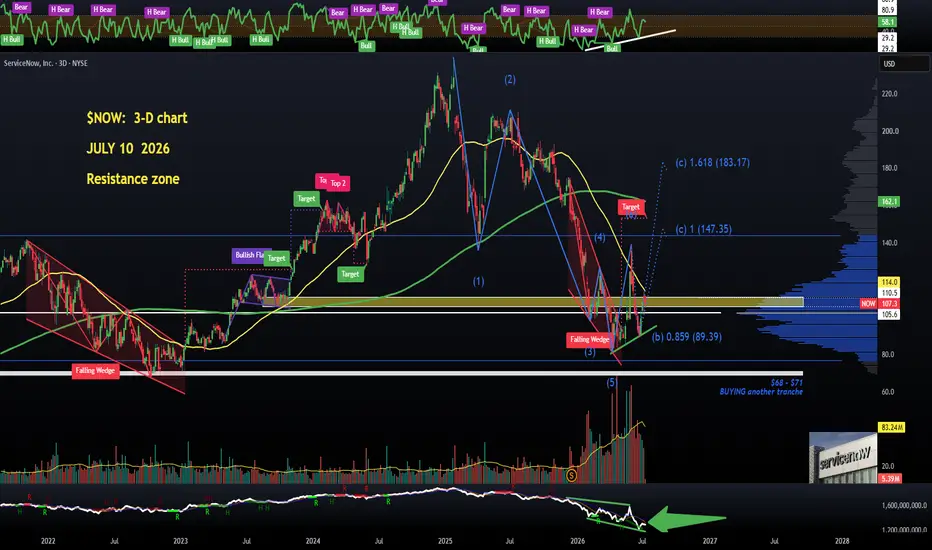
Position #6:  NOW (ServiceNow) - 3-day chart
Fundamentally, the story continues to improve. ServiceNow is evolving beyond traditional IT Service Management and is increasingly positioning itself as a leader in enterprise AI. Recent AI partnerships across the public sector and defense-related initiatives, together with the continued expansion of its agentic AI ecosystem, strengthen the company's long-term growth thesis.
From a technical perspective, the 3-day chart remains interesting. The main obstacle is still the resistance zone marked by the yellow box. A breakout above $111 should make the path higher much easier, while the most important support remains the Point of Control (PoC) around $102.
There is something resembling an Inverse Head & Shoulders pattern, although it is far from textbook quality. The neckline is clearly sloping, making the formation less reliable. More importantly, the overall market structure remains bullish.
OBV continues to show a Hidden Bullish Divergence, suggesting that despite the recent pullback, buyers are still in control and the broader uptrend could continue.
A bearish Elliott Wave count suggests a potential wave (c) next, with an initial target around $147.35 and a more ambitious target near $183. Interestingly, both projected wave targets broadly align with the latest price targets published by various Wall Street analysts.
This is not financial advice - just my blog.
💙👽
NOW (ServiceNow) - 3-day chartFundamentally, the story continues to improve. ServiceNow is evolving beyond traditional IT Service Management and is increasingly positioning itself as a leader in enterprise AI. Recent AI partnerships across the public sector and defense-related initiatives, together with the continued expansion of its agentic AI ecosystem, strengthen the company's long-term growth thesis.
From a technical perspective, the 3-day chart remains interesting. The main obstacle is still the resistance zone marked by the yellow box. A breakout above $111 should make the path higher much easier, while the most important support remains the Point of Control (PoC) around $102.
There is something resembling an Inverse Head & Shoulders pattern, although it is far from textbook quality. The neckline is clearly sloping, making the formation less reliable. More importantly, the overall market structure remains bullish.
OBV continues to show a Hidden Bullish Divergence, suggesting that despite the recent pullback, buyers are still in control and the broader uptrend could continue.
A bearish Elliott Wave count suggests a potential wave (c) next, with an initial target around $147.35 and a more ambitious target near $183. Interestingly, both projected wave targets broadly align with the latest price targets published by various Wall Street analysts.
This is not financial advice - just my blog.
💙👽

Exención de responsabilidad
La información y las publicaciones no constituyen, ni deben considerarse como, asesoramiento o recomendaciones financieras, de inversión, de trading u otro tipo, proporcionadas o respaldadas por TradingView. Obtenga más información en Condiciones de uso.
Exención de responsabilidad
La información y las publicaciones no constituyen, ni deben considerarse como, asesoramiento o recomendaciones financieras, de inversión, de trading u otro tipo, proporcionadas o respaldadas por TradingView. Obtenga más información en Condiciones de uso.