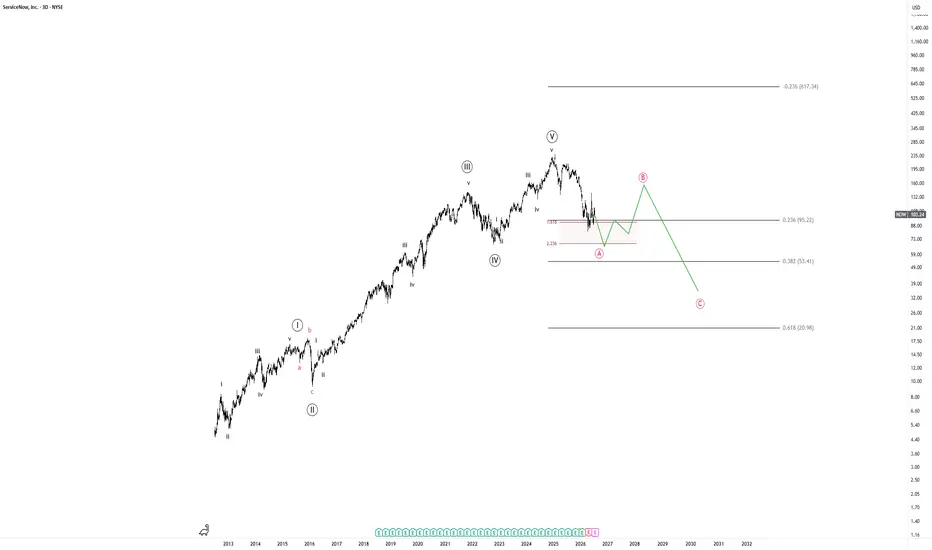
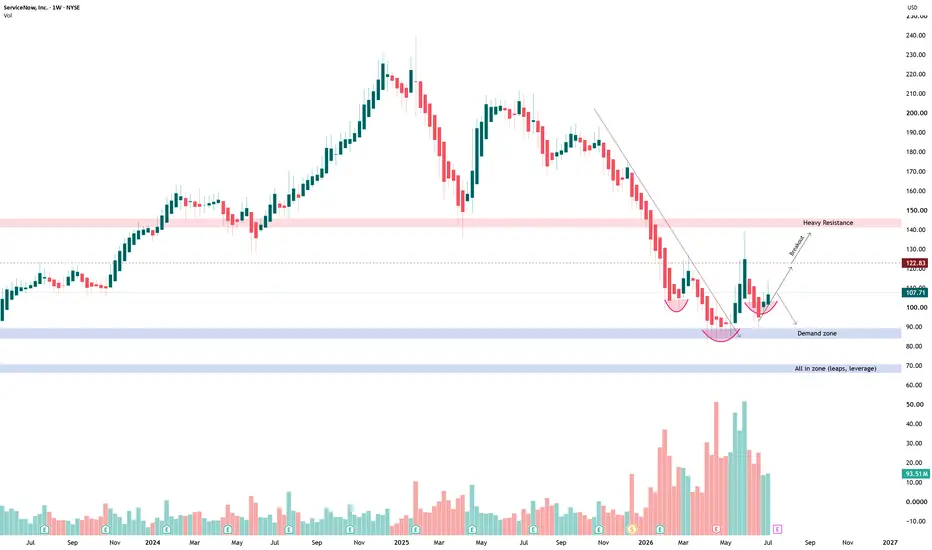
ServiceNow (NOW) AI FearFrom the beginning of it's time, NOW has been in a bullish uptrend - following a bullish wave channel. We have since broken out of it and currently rest at a key retracement level. Its impulse cycle appears to be completed and I'm betting that we have this correction.
Should we form a bullish patte
Compare with ServiceNow, Inc.
Key facts today
ServiceNow (NOW) reports quarterly results Wednesday. Shares are down ~30% YTD. 50‑day MA ≈ $103, 200‑day MA ≈ $128.40. Analyst noted possible rebound toward ~$125 if results beat. 1
1.69 USD
1.75 B USD
13.28 B USD
1.02 B
Next report date
—
Report period
—
EPS estimate
—
Revenue estimate
—
Profile
Sector
Industry
CEO
William R. McDermott
Website
Headquarters
Santa Clara
Founded
2004
IPO date
Jun 28, 2012
ISIN
US81762P1021
CUSIP
81762P102
FIGI
BBG000M1R011
Identifiers
ISIN US81762P1021
ServiceNow, Inc. engages in the provision of an end-to-end workflow automation platform for digital businesses. Its Now Platform is a cloud-based solution embedded with artificial intelligence (AI) and machine learning (ML). The company was founded by Frederic B. Luddy in June 2004 and is headquartered in Santa Clara, CA.
Devastating setupMarket leader in the AI agent sector, which I already described in the previous idea
+++++
Analysis
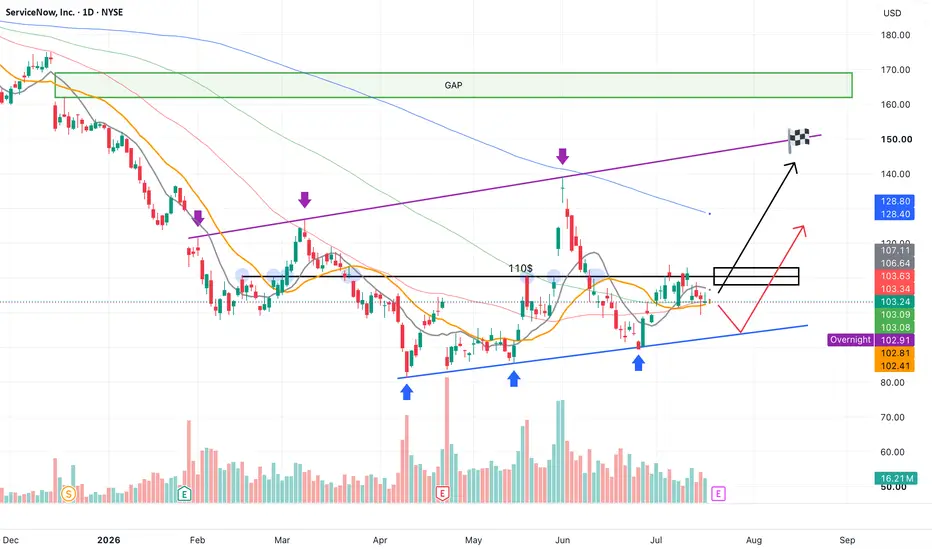
The price is approaching earnings (Wednesday) with a clear W-formation.
The key breakout for the start of the bullish move is a close above $110, accompanied by increasing volume.
Good earnings co
NOW — Earnings in 72 hours after a major de-rating. High...NOW — Earnings in 72 hours after a major de-rating. High volatility setup.
NOW — ServiceNow — July 19, 2026
ServiceNow reports Q2 earnings after the close on Wednesday. The stock has fallen sharply from its highs and is now trading near the lower end of its recent range into a high-expectation pri
NOW | June, 2026 | The time to go long has come- Timeframe: Weekly
- Trade type: Buy stop order
- Price: 115.36
- Take Profit: Open
- Stop Loss: 98.42 (-14.70 %)
Idea: Long on a breakout above last week's high — bullish momentum continuation.
Entry: Buy stop above last week’s high.
Stop-loss: Below the low of the same candle.
If the weekly cand
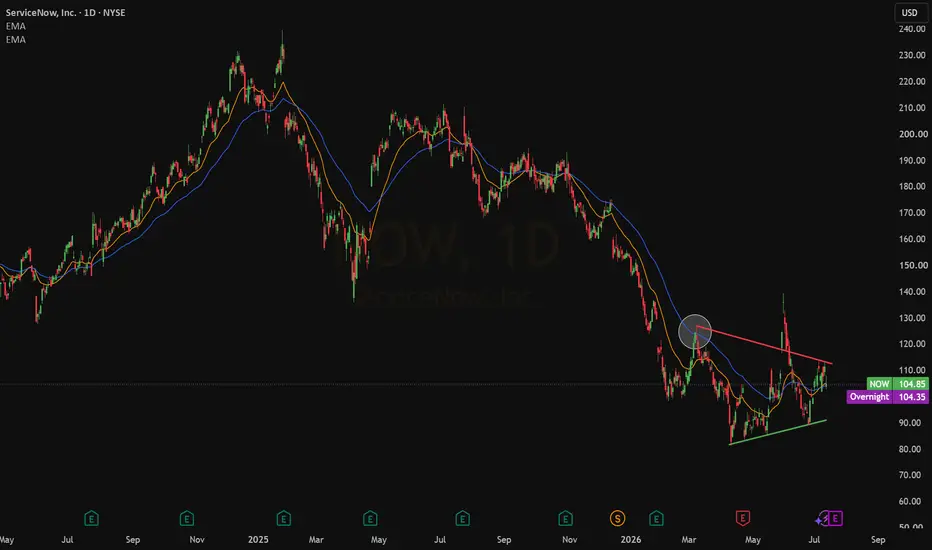
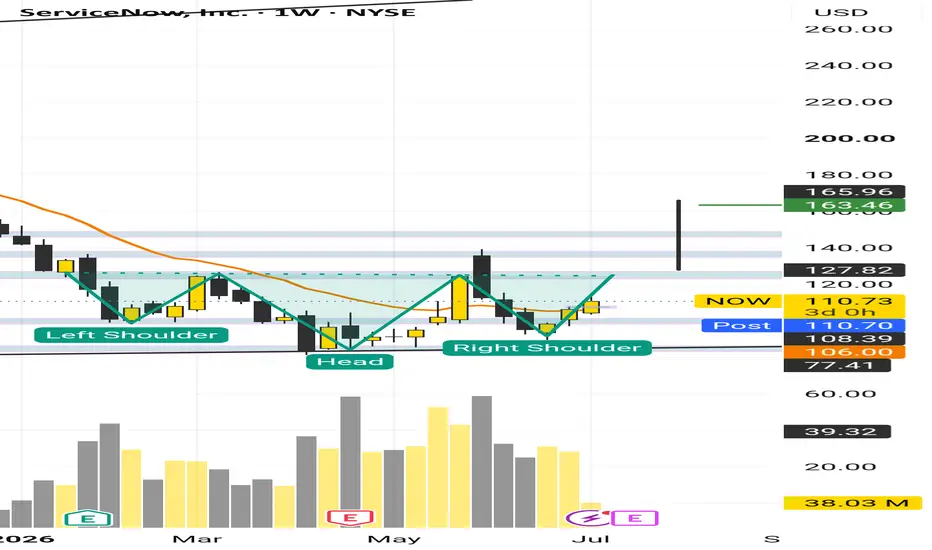
NOW holders - quick updateThe SaaS selloff over the past six months hit this name hard, but with a ~ 99% renewal rate, the underlying business remains solid. AI momentum is cooling, and any further downside in that sector could rotate capital back into beaten‑down software.
Technically, it’s not a perfect inverse head and s
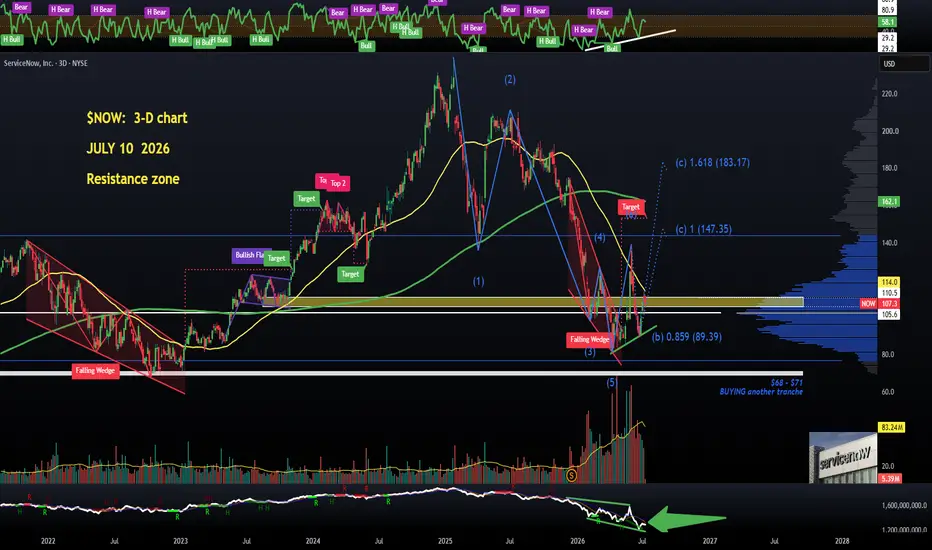
Position #6: $NOW (ServiceNow) - 3-day chartPosition #6: NYSE:NOW (ServiceNow) - 3-day chart
Fundamentally, the story continues to improve. ServiceNow is evolving beyond traditional IT Service Management and is increasingly positioning itself as a leader in enterprise AI. Recent AI partnerships across the public sector and defense-related
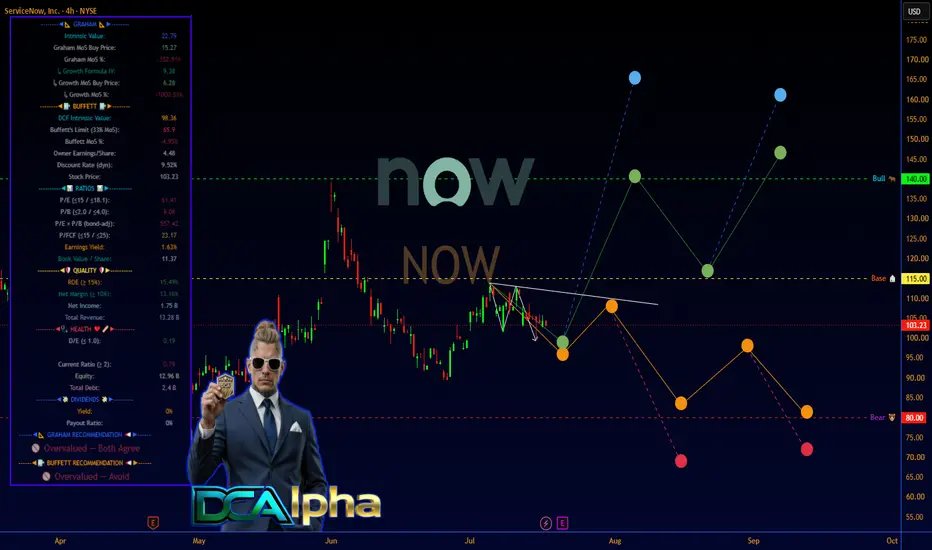
NOW | 26' Q2 - May | 4hr ChartSERVICE NOW - "engages in the provision of an end-to-end workflow automation platform for digital businesses"
BULL CASE — +25%
Positive EPS ($1.70) — profitable. P/E of N/A.
EPS growth 13.69% — supports path to +25% rebalance target.
High revenue growth (21.72% YoY) — justifies premium multiples
See all ideas
Summarizing what the indicators are suggesting.
Neutral
SellBuy
Strong sellStrong buy
Strong sellSellNeutralBuyStrong buy
Neutral
SellBuy
Strong sellStrong buy
Strong sellSellNeutralBuyStrong buy
Neutral
SellBuy
Strong sellStrong buy
Strong sellSellNeutralBuyStrong buy
An aggregate view of professional's ratings.
Neutral
SellBuy
Strong sellStrong buy
Strong sellSellNeutralBuyStrong buy
Neutral
SellBuy
Strong sellStrong buy
Strong sellSellNeutralBuyStrong buy
Neutral
SellBuy
Strong sellStrong buy
Strong sellSellNeutralBuyStrong buy
Displays a symbol's price movements over previous years to identify recurring trends.
6.409% YTM
Maturity dateMay 15, 2056
Coupon6.30% (Fixed)
5.570% YTM
Maturity dateMay 15, 2036
Coupon5.40% (Fixed)
4.929% YTM
Maturity dateAug 15, 2031
Coupon4.70% (Fixed)
4.933% YTM
Maturity dateMay 15, 2033
Coupon5.05% (Fixed)
4.793% YTM
Maturity dateSep 1, 2030
Coupon1.40% (Fixed)
4.527% YTM
Maturity dateMay 15, 2028
Coupon4.25% (Fixed)
See all NOW bonds
Weight0.14%
Market value3.25 B
Weight0.16%
Market value2.66 B
Weight0.17%
Market value1.47 B
Weight0.17%
Market value1.32 B
Weight0.30%
Market value1.13 B
Weight0.75%
Market value856.19 M
Weight0.41%
Market value703.89 M
Weight3.98%
Market value541.23 M
Weight0.33%
Market value408.79 M
Weight0.17%
Market value268.60 M
Weight0.43%
Market value259.58 M
Explore more ETFs
Frequently asked questions
The current price of NOW is 104.70 USD — it has increased by 1.41% in the past 24 hours. Watch ServiceNow, Inc. stock price performance more closely on the chart.
Depending on the exchange, the stock ticker may vary. For instance, on NYSE exchange ServiceNow, Inc. stocks are traded under the ticker NOW.
NOW stock has fallen by −4.38% compared to the previous week, the month change is a 9.85% rise, over the last year ServiceNow, Inc. has showed a −45.36% decrease.
We've gathered analysts' opinions on ServiceNow, Inc. future price: according to them, NOW price has a max estimate of 236.00 USD and a min estimate of 85.00 USD. Watch NOW chart and read a more detailed ServiceNow, Inc. stock forecast: see what analysts think of ServiceNow, Inc. and suggest that you do with its stocks.
NOW stock is 7.01% volatile and has beta coefficient of 0.88. Track ServiceNow, Inc. stock price on the chart and check out the list of the most volatile stocks — is ServiceNow, Inc. there?
Today ServiceNow, Inc. has the market capitalization of 107.27 B, it has decreased by −7.21% over the last week.
Yes, you can track ServiceNow, Inc. financials in yearly and quarterly reports right on TradingView.
ServiceNow, Inc. is going to release the next earnings report on Jul 22, 2026. Keep track of upcoming events with our Earnings Calendar.
NOW earnings for the last quarter are 0.97 USD per share, whereas the estimation was 0.97 USD resulting in a −0.01% surprise. The estimated earnings for the next quarter are 0.86 USD per share. See more details about ServiceNow, Inc. earnings.
ServiceNow, Inc. revenue for the last quarter amounts to 3.77 B USD, despite the estimated figure of 3.74 B USD. In the next quarter, revenue is expected to reach 3.93 B USD.
NOW net income for the last quarter is 469.00 M USD, while the quarter before that showed 401.00 M USD of net income which accounts for 0.00% change. Track more ServiceNow, Inc. financial stats to get the full picture.
No, NOW doesn't pay any dividends to its shareholders. But don't worry, we've prepared a list of high-dividend stocks for you.
As of Jul 21, 2026, the company has 29.19 K employees. See our rating of the largest employees — is ServiceNow, Inc. on this list?
EBITDA measures a company's operating performance, its growth signifies an improvement in the efficiency of a company. ServiceNow, Inc. EBITDA is 2.81 B USD, and current EBITDA margin is 20.35%. See more stats in ServiceNow, Inc. financial statements.
Like other stocks, NOW shares are traded on stock exchanges, e.g. Nasdaq, Nyse, Euronext, and the easiest way to buy them is through an online stock broker. To do this, you need to open an account and follow a broker's procedures, then start trading. You can trade ServiceNow, Inc. stock right from TradingView charts — choose your broker and connect to your account.
Investing in stocks requires a comprehensive research: you should carefully study all the available data, e.g. company's financials, related news, and its technical analysis. So ServiceNow, Inc. technincal analysis shows the neutral today, and its 1 week rating is sell. Since market conditions are prone to changes, it's worth looking a bit further into the future — according to the 1 month rating ServiceNow, Inc. stock shows the sell signal. See more of ServiceNow, Inc. technicals for a more comprehensive analysis.
If you're still not sure, try looking for inspiration in our curated watchlists.