
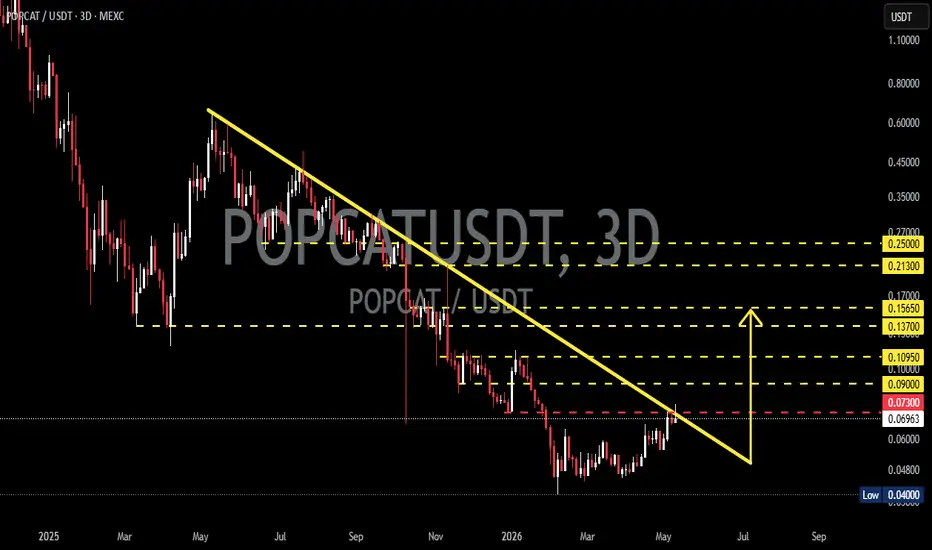
On this 3D timeframe chart, POPCAT appears to be recovering after experiencing a long-term downtrend from its previous peak levels. 📉➡️📈
Interestingly, price is now approaching a major descending trendline resistance that has been suppressing bullish momentum for several months. ⚠️🟡
This yellow descending trendline is the key level that could determine the next major market direction. If a breakout happens with strong volume confirmation, the potential for a medium-to-long-term trend reversal becomes significantly stronger. 🚀🔥
In addition, price has started forming a higher low structure near the bottom area, signaling that selling pressure is gradually weakening while buyers slowly regain market control. 🐂📈
━━━━━━━━━━━━━━━
📌 Pattern Formation
🔻 Descending Resistance / Falling Trendline
For months, price has continuously traded below a descending resistance line. This type of structure often signals an accumulation phase before a major breakout move occurs. 📊⚡
📍 Key Characteristics on This Chart:
✅ Continuous lower highs
✅ Bearish pressure gradually weakening
✅ Price stabilizing around the bottom zone
✅ Recovery momentum beginning to build
If the trendline resistance gets broken successfully, this structure could evolve into a:
🚀 Bullish Trend Reversal Structure
━━━━━━━━━━━━━━━
🟢 Bullish Scenario
✅ Main Bullish Confirmation
The bullish setup becomes more valid if the 3D candle can:
📌 Break above the yellow trendline
📌 Close strongly above the 0.07300 level
📌 Show increasing trading volume 🔥
If the breakout succeeds, the next bullish targets could potentially be:
🎯 Bullish Targets:
🚀 0.09000
🚀 0.10950
🚀 0.13700
🚀 0.15650
🚀 0.21300
🚀 0.25000 🔥🔥🔥
The 0.15650 area is an important resistance zone because it previously acted as a strong supply area that rejected price movement. ⚠️
If the overall crypto market momentum remains supportive, POPCAT could experience an impulsive rally toward higher psychological levels. 🌕🚀
━━━━━━━━━━━━━━━
🔴 Bearish Scenario
The bearish outlook remains valid if price fails to break the descending trendline resistance and gets rejected again. ❌📉
⚠️ Bearish Signals:
🔻 Strong rejection near the trendline resistance
🔻 Weak breakout volume
🔻 Candle closes back below 0.06900
If that happens, price could potentially revisit lower support areas:
🎯 Bearish Targets:
📉 0.06000
📉 0.04800
📉 0.04000 (major support zone) ⚠️
The 0.04000 level is currently a very important low area and acts as the last major defense for buyers. If this level breaks, the long-term downtrend could continue further. 🐻
━━━━━━━━━━━━━━━
📈 Conclusion
POPCAT is currently sitting at a very critical decision zone. ⚡
The chart shows early signs of a possible reversal after a prolonged downtrend, but the main confirmation still depends on a successful breakout above the descending resistance trendline. 👀📊
As long as price remains above support and volume continues increasing, the probability of a bullish continuation becomes much stronger. 🚀
However, traders should remain cautious of potential fake breakouts because the current resistance area is still a significant supply zone. ⚠️📉
This chart will be extremely interesting to watch over the next few 3D candles, as it could mark the beginning of a major trend reversal. 🔥🌕
━━━━━━━━━━━━━━━
#POPCAT #POPCATUSDT #Crypto 🚀 #Cryptocurrency #TechnicalAnalysis 📊 #Altcoin #MemeCoin 🐱 #Bullish #Breakout #CryptoTrading #PriceAction #SupportResistance #Trendline #Altseason
Interestingly, price is now approaching a major descending trendline resistance that has been suppressing bullish momentum for several months. ⚠️🟡
This yellow descending trendline is the key level that could determine the next major market direction. If a breakout happens with strong volume confirmation, the potential for a medium-to-long-term trend reversal becomes significantly stronger. 🚀🔥
In addition, price has started forming a higher low structure near the bottom area, signaling that selling pressure is gradually weakening while buyers slowly regain market control. 🐂📈
━━━━━━━━━━━━━━━
📌 Pattern Formation
🔻 Descending Resistance / Falling Trendline
For months, price has continuously traded below a descending resistance line. This type of structure often signals an accumulation phase before a major breakout move occurs. 📊⚡
📍 Key Characteristics on This Chart:
✅ Continuous lower highs
✅ Bearish pressure gradually weakening
✅ Price stabilizing around the bottom zone
✅ Recovery momentum beginning to build
If the trendline resistance gets broken successfully, this structure could evolve into a:
🚀 Bullish Trend Reversal Structure
━━━━━━━━━━━━━━━
🟢 Bullish Scenario
✅ Main Bullish Confirmation
The bullish setup becomes more valid if the 3D candle can:
📌 Break above the yellow trendline
📌 Close strongly above the 0.07300 level
📌 Show increasing trading volume 🔥
If the breakout succeeds, the next bullish targets could potentially be:
🎯 Bullish Targets:
🚀 0.09000
🚀 0.10950
🚀 0.13700
🚀 0.15650
🚀 0.21300
🚀 0.25000 🔥🔥🔥
The 0.15650 area is an important resistance zone because it previously acted as a strong supply area that rejected price movement. ⚠️
If the overall crypto market momentum remains supportive, POPCAT could experience an impulsive rally toward higher psychological levels. 🌕🚀
━━━━━━━━━━━━━━━
🔴 Bearish Scenario
The bearish outlook remains valid if price fails to break the descending trendline resistance and gets rejected again. ❌📉
⚠️ Bearish Signals:
🔻 Strong rejection near the trendline resistance
🔻 Weak breakout volume
🔻 Candle closes back below 0.06900
If that happens, price could potentially revisit lower support areas:
🎯 Bearish Targets:
📉 0.06000
📉 0.04800
📉 0.04000 (major support zone) ⚠️
The 0.04000 level is currently a very important low area and acts as the last major defense for buyers. If this level breaks, the long-term downtrend could continue further. 🐻
━━━━━━━━━━━━━━━
📈 Conclusion
POPCAT is currently sitting at a very critical decision zone. ⚡
The chart shows early signs of a possible reversal after a prolonged downtrend, but the main confirmation still depends on a successful breakout above the descending resistance trendline. 👀📊
As long as price remains above support and volume continues increasing, the probability of a bullish continuation becomes much stronger. 🚀
However, traders should remain cautious of potential fake breakouts because the current resistance area is still a significant supply zone. ⚠️📉
This chart will be extremely interesting to watch over the next few 3D candles, as it could mark the beginning of a major trend reversal. 🔥🌕
━━━━━━━━━━━━━━━
#POPCAT #POPCATUSDT #Crypto 🚀 #Cryptocurrency #TechnicalAnalysis 📊 #Altcoin #MemeCoin 🐱 #Bullish #Breakout #CryptoTrading #PriceAction #SupportResistance #Trendline #Altseason

✅ Get Free Signals! Join Our Telegram Channel Here: t.me/TheCryptoNuclear
✅ Twitter: twitter.com/crypto_nuclear
✅ Join Bybit : partner.bybit.com/b/nuclearvip
✅ Benefits : Lifetime Trading Fee Discount -50%
✅ Twitter: twitter.com/crypto_nuclear
✅ Join Bybit : partner.bybit.com/b/nuclearvip
✅ Benefits : Lifetime Trading Fee Discount -50%
Exención de responsabilidad
La información y las publicaciones no constituyen, ni deben considerarse como, asesoramiento o recomendaciones financieras, de inversión, de trading u otro tipo, proporcionadas o respaldadas por TradingView. Obtenga más información en Condiciones de uso.
✅ Get Free Signals! Join Our Telegram Channel Here: t.me/TheCryptoNuclear
✅ Twitter: twitter.com/crypto_nuclear
✅ Join Bybit : partner.bybit.com/b/nuclearvip
✅ Benefits : Lifetime Trading Fee Discount -50%
✅ Twitter: twitter.com/crypto_nuclear
✅ Join Bybit : partner.bybit.com/b/nuclearvip
✅ Benefits : Lifetime Trading Fee Discount -50%
Exención de responsabilidad
La información y las publicaciones no constituyen, ni deben considerarse como, asesoramiento o recomendaciones financieras, de inversión, de trading u otro tipo, proporcionadas o respaldadas por TradingView. Obtenga más información en Condiciones de uso.