POPCATUSDT — Breakout from the Base [Quantum Algo]POPCAT sold off from the 0.052 highs down into a multi-day consolidation around 0.045, coiling tight through the range. Price just broke up out of that base with a strong impulse candle, firing the Buy at 0.04590. This is a breakout-continuation long: the coil resolved to the upside, momentum is exp
Compare with POPCAT / USDT
POPCAT Could Explode Above This Resistance$POPCAT is pushing back into a key resistance zone after a strong recovery from recent lows. Buyers are maintaining momentum, but this supply area remains the next major hurdle.
A clean breakout and successful retest above this zone could open the door for a stronger move higher. Until then, watch
POPCATUSDT - Bear Flag, Major Breakdown or Strong Rebound?On the 8H timeframe, POPCATUSDT remains in an overall bearish trend. After experiencing a sharp decline (Flagpole), the price has been moving gradually higher, forming a Bear Flag—a classic bearish continuation pattern developing inside an ascending parallel channel. 📉
At the moment, the price has
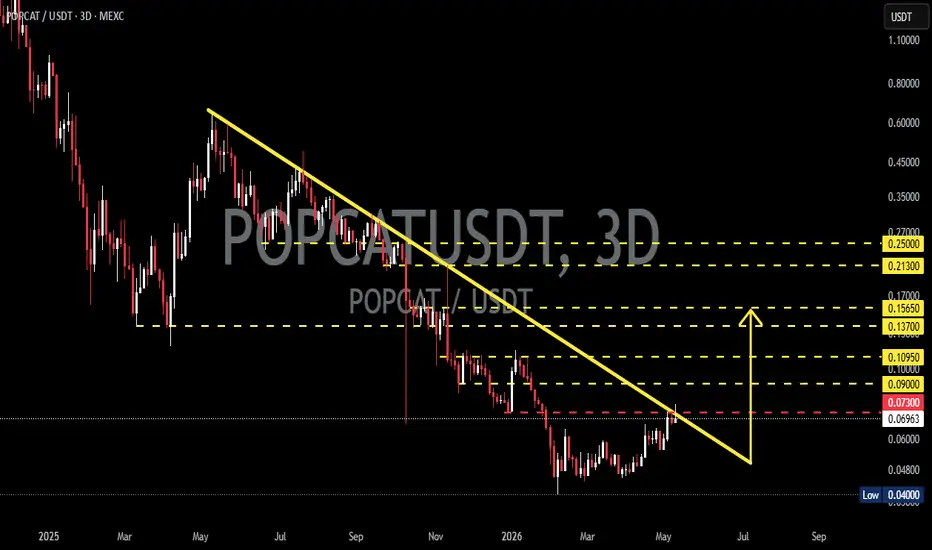
POPCAT/USDT — Massive Breakout Loading?On this 3D timeframe chart, POPCAT appears to be recovering after experiencing a long-term downtrend from its previous peak levels. 📉➡️📈
Interestingly, price is now approaching a major descending trendline resistance that has been suppressing bullish momentum for several months. ⚠️🟡
This yellow de
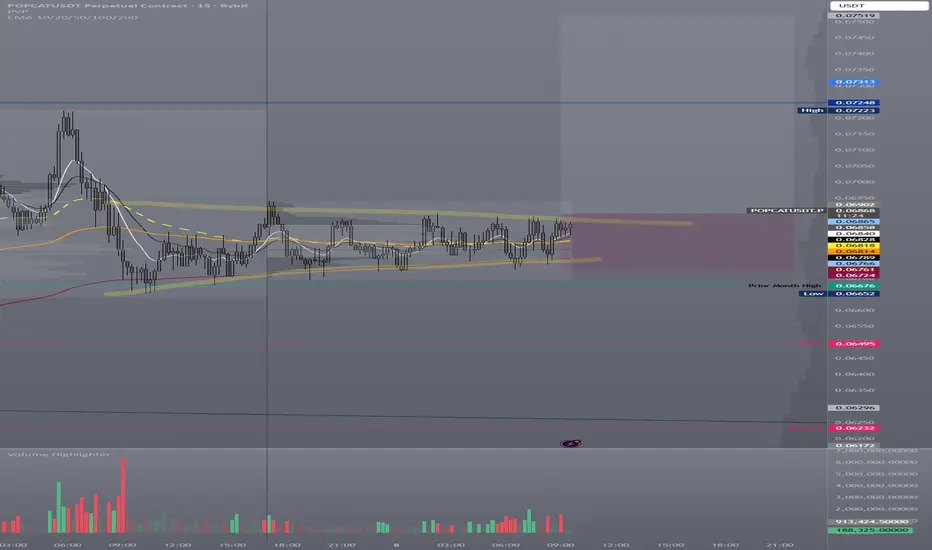
POPCAT Compression After Reclaim — Continuation or Failure?
Intro:
POPCAT is in an important location here. After reclaiming prior month high and prior month value, price has started to compress above those levels instead of fully rejecting back into the prior range.
The question now is simple: does this compression turn into expansion, or does acceptance
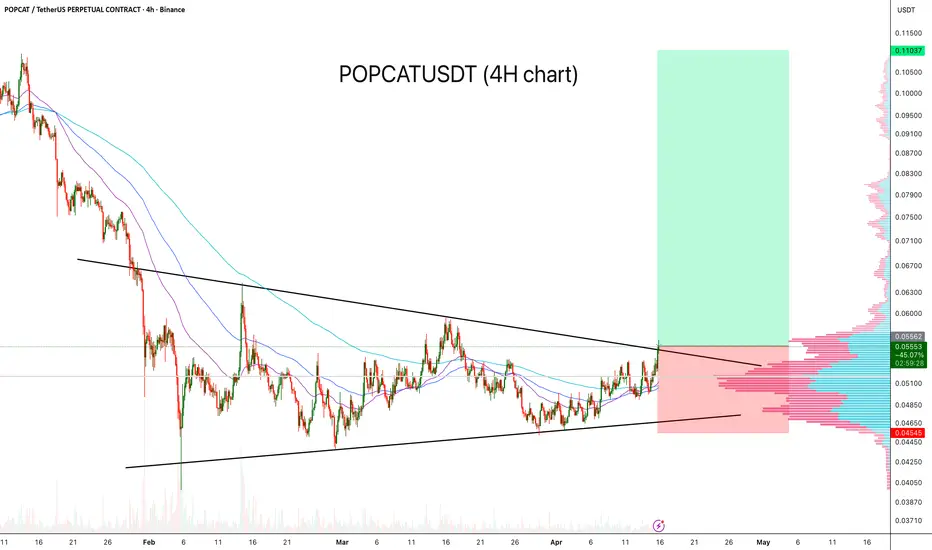
POPCATUSDT: Symmetrical Triangle formation — Reversal Incoming?POPCAT is currently forming a symmetrical triangle on the 4H timeframe after a prolonged downtrend, indicating a phase of price compression and equilibrium between buyers and sellers.
Key points:
- Converging trendlines forming a clear symmetrical triangle
- Price making higher lows and lower hi
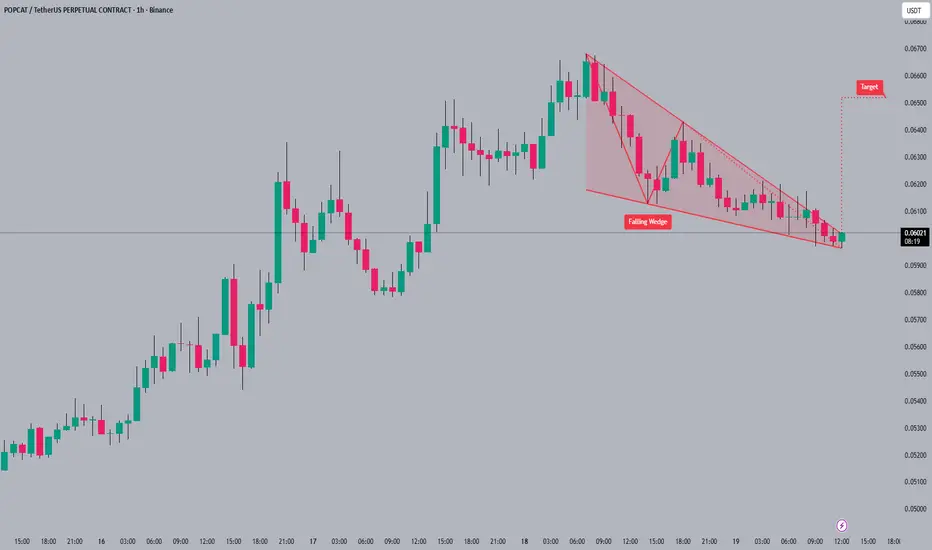
#POPCAT#POPCAT is currently consolidating within a falling wedge 📐 pattern, suggesting a potential breakout. The falling wedge pattern often indicates a bullish reversal 🐂 as the price compresses. If #POPCAT breaks upwards, the target is around 0.06600 🎯.
A breakout from a falling wedge can be a strong si
POPCAT is one of the bullish meme coins (4H)One of the bullish meme coins these days is POPCAT. It seems whales are paying special attention to this meme coin.
From the point where we placed the green arrow on the chart, POPCAT has entered a bullish phase. Waves A and B are complete, with Wave A forming a zigzag and Wave B forming a diamond-
See all ideas
Summarizing what the indicators are suggesting.
Oscillators
Neutral
SellBuy
Strong sellStrong buy
Strong sellSellNeutralBuyStrong buy
Oscillators
Neutral
SellBuy
Strong sellStrong buy
Strong sellSellNeutralBuyStrong buy
Summary
Neutral
SellBuy
Strong sellStrong buy
Strong sellSellNeutralBuyStrong buy
Summary
Neutral
SellBuy
Strong sellStrong buy
Strong sellSellNeutralBuyStrong buy
Summary
Neutral
SellBuy
Strong sellStrong buy
Strong sellSellNeutralBuyStrong buy
Moving Averages
Neutral
SellBuy
Strong sellStrong buy
Strong sellSellNeutralBuyStrong buy
Moving Averages
Neutral
SellBuy
Strong sellStrong buy
Strong sellSellNeutralBuyStrong buy
Displays a symbol's price movements over previous years to identify recurring trends.
Frequently asked questions
The current price of POPCAT / USDT (POPCAT) is 0.04459 USDT — it has fallen −1.18% in the past 24 hours. Try placing this info into the context by checking out what coins are also gaining and losing at the moment and seeing POPCAT price chart.
POPCAT / USDT price has fallen by −2.72% over the last week, its month performance shows a −10.25% decrease, and as for the last year, POPCAT / USDT has decreased by −88.38%. See more dynamics on POPCAT price chart.
Keep track of coins' changes with our Crypto Coins Heatmap.
POPCAT / USDT (POPCAT) reached its highest price on Nov 17, 2024 — it amounted to 2.10000 USDT. Find more insights on the POPCAT price chart.
See the list of crypto gainers and choose what best fits your strategy.
POPCAT / USDT (POPCAT) reached the lowest price of 0.03732 USDT on Jun 6, 2026. View more POPCAT / USDT dynamics on the price chart.
See the list of crypto losers to find unexpected opportunities.
The safest choice when buying POPCAT is to go to a well-known crypto exchange. Some of the popular names are Binance, Coinbase, Kraken. But you'll have to find a reliable broker and create an account first. You can trade POPCAT right from TradingView charts — just choose a broker and connect to your account.
Crypto markets are famous for their volatility, so one should study all the available stats before adding crypto assets to their portfolio. Very often it's technical analysis that comes in handy. We prepared technical ratings for POPCAT / USDT (POPCAT): today its technical analysis shows the neutral signal, and according to the 1 week rating POPCAT shows the sell signal. And you'd better dig deeper and study 1 month rating too — it's sell. Find inspiration in POPCAT / USDT trading ideas and keep track of what's moving crypto markets with our crypto news feed.
POPCAT / USDT (POPCAT) is just as reliable as any other crypto asset — this corner of the world market is highly volatile. Today, for instance, POPCAT / USDT is estimated as 3.71% volatile. The only thing it means is that you must prepare and examine all available information before making a decision. And if you're not sure about POPCAT / USDT, you can find more inspiration in our curated watchlists.
You can discuss POPCAT / USDT (POPCAT) with other users in our public chats, Minds or in the comments to Ideas.