
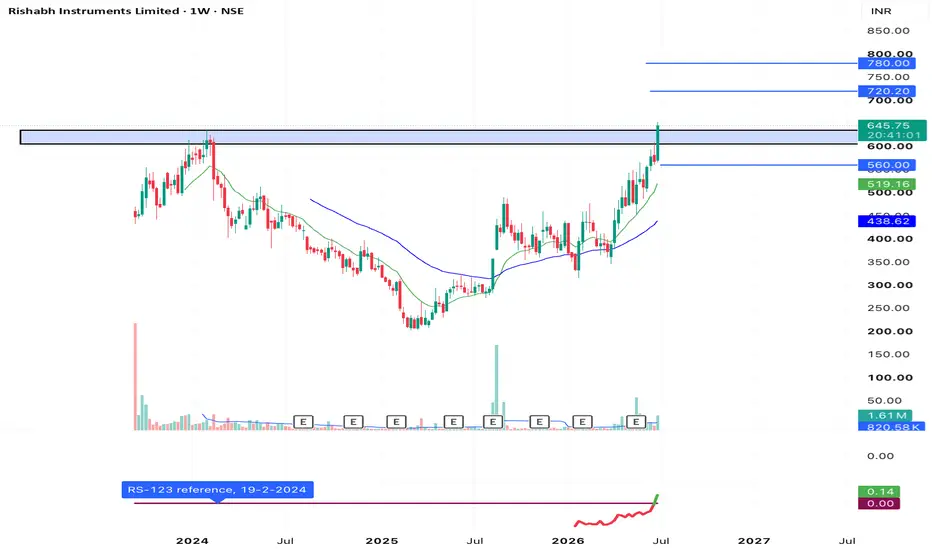
📊 Rishabh Instruments Limited (RISHABH) - Weekly (1W) Chart Analysis
This post is shared for EDUCATIONAL PURPOSES ONLY to analyze horizontal range breakouts and structural shifts on macro timeframes. It is not financial or investment advice.
🟢 Technical Observations:
1. Significant Horizontal Breakout: On the weekly chart, RISHABH has decisively smashed through a vital, multi-month horizontal resistance box established between 600.00 and 620.00.
2. Strong Weekly Close: The current weekly candle is a large, commanding green marubozu closing near its high at 645.75 (+13.81%), confirming powerful institutional accumulation and a definitive end to the previous consolidation phase.
3. Moving Average Alignment: The price is accelerating away from its short-term and medium-term moving averages, with the green and blue lines curving upward to establish a strong trailing baseline support.
4. Volume Setup: Trading volume is showing healthy expansion during this breakout week, validating the authenticity of the structural move.
🎯 Educational Swing Setup:
• Entry Zone: 615.00 – 645.75 (Entering parts near current levels, or ideally looking for minor intra-week cool-downs closer to the broken 620.00 resistance-turned-support shelf to secure a cleaner risk-to-reward ratio).
• Target 1: 720.00 (Near-term psychological expansion target)
• Target 2: 780.00+ (Extended macro momentum target in price discovery)
• Invalidation / Stop-Loss: 560.00 (A definitive weekly close back below the structural breakout box and key moving averages invalidates this bullish continuation setup).
• Expected Duration: 3 to 6 Weeks (Macro weekly swing view)
⚠️ Risk Management:
Since this is a major weekly structural breakout, a brief retest of the 600–620 zone in the coming sessions is entirely normal market behavior. Keep your position sizing highly disciplined and avoid over-leveraging!
This post is shared for EDUCATIONAL PURPOSES ONLY to analyze horizontal range breakouts and structural shifts on macro timeframes. It is not financial or investment advice.
🟢 Technical Observations:
1. Significant Horizontal Breakout: On the weekly chart, RISHABH has decisively smashed through a vital, multi-month horizontal resistance box established between 600.00 and 620.00.
2. Strong Weekly Close: The current weekly candle is a large, commanding green marubozu closing near its high at 645.75 (+13.81%), confirming powerful institutional accumulation and a definitive end to the previous consolidation phase.
3. Moving Average Alignment: The price is accelerating away from its short-term and medium-term moving averages, with the green and blue lines curving upward to establish a strong trailing baseline support.
4. Volume Setup: Trading volume is showing healthy expansion during this breakout week, validating the authenticity of the structural move.
🎯 Educational Swing Setup:
• Entry Zone: 615.00 – 645.75 (Entering parts near current levels, or ideally looking for minor intra-week cool-downs closer to the broken 620.00 resistance-turned-support shelf to secure a cleaner risk-to-reward ratio).
• Target 1: 720.00 (Near-term psychological expansion target)
• Target 2: 780.00+ (Extended macro momentum target in price discovery)
• Invalidation / Stop-Loss: 560.00 (A definitive weekly close back below the structural breakout box and key moving averages invalidates this bullish continuation setup).
• Expected Duration: 3 to 6 Weeks (Macro weekly swing view)
⚠️ Risk Management:
Since this is a major weekly structural breakout, a brief retest of the 600–620 zone in the coming sessions is entirely normal market behavior. Keep your position sizing highly disciplined and avoid over-leveraging!

Exención de responsabilidad
La información y las publicaciones no constituyen, ni deben considerarse como, asesoramiento o recomendaciones financieras, de inversión, de trading u otro tipo, proporcionadas o respaldadas por TradingView. Obtenga más información en Condiciones de uso.
Exención de responsabilidad
La información y las publicaciones no constituyen, ni deben considerarse como, asesoramiento o recomendaciones financieras, de inversión, de trading u otro tipo, proporcionadas o respaldadas por TradingView. Obtenga más información en Condiciones de uso.