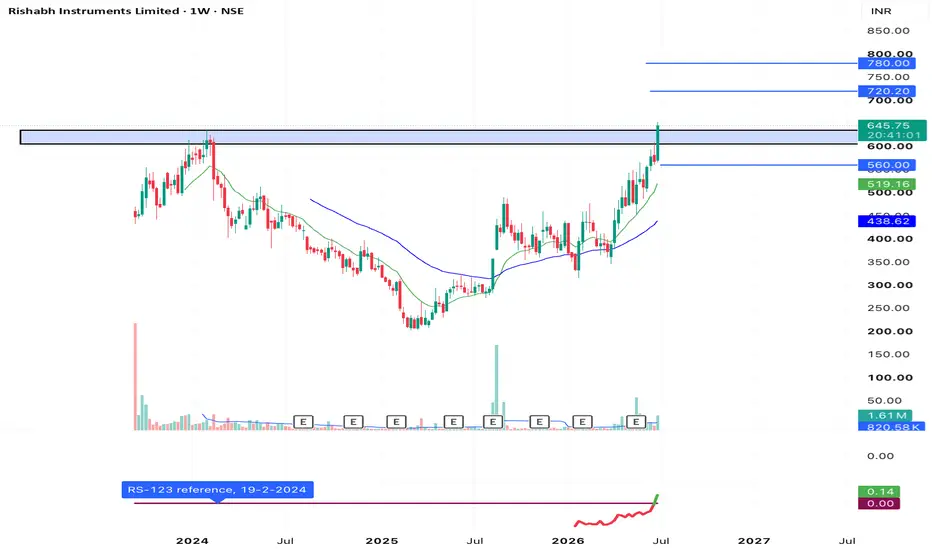
RISHABH: Base 2 breaks out, +7.78% on volumePosted this one earlier while it was still sitting in the base. Today it went.
Quick recap of the structure. Stock was in a Stage 4 decline under a falling trendline into August 2025. Broke out of that on a huge volume bar, then went into a base that lasted eight months, roughly August through Apri
Rishabh Instruments Limited
No trades
No trades
Compare with Rishabh Instruments Limited
21.00 INR
815.33 M INR
7.73 B INR
11.35 M
Company info
Sector
Industry
CEO
Dineshkumar Mahadev Musalekar
Website
Headquarters
Nashik
Founded
1982
IPO date
Sep 11, 2023
ISIN
INE0N2P01017
FIGI
BBG01J3CG517
Identifiers
ISIN INE0N2P01017
Rishabh Instruments Ltd. engages in the business of manufacturing, designing, and development of test and measuring instruments and industrial control products. The firm's products include transducers, isolators, and temperature controllers. It operates through the following geographical segments: Asia, USA, Europe, Poland, and Other. The company was founded by Narendra Joharimal Goliya on October 6, 1982 and is headquartered in Nashik, India.
RISHABH: Massive Weekly Multi-Month Horizontal Breakout 📊 Rishabh Instruments Limited (RISHABH) - Weekly (1W) Chart Analysis
This post is shared for EDUCATIONAL PURPOSES ONLY to analyze horizontal range breakouts and structural shifts on macro timeframes. It is not financial or investment advice.
🟢 Technical Observations:
1. Significant Horizontal Brea
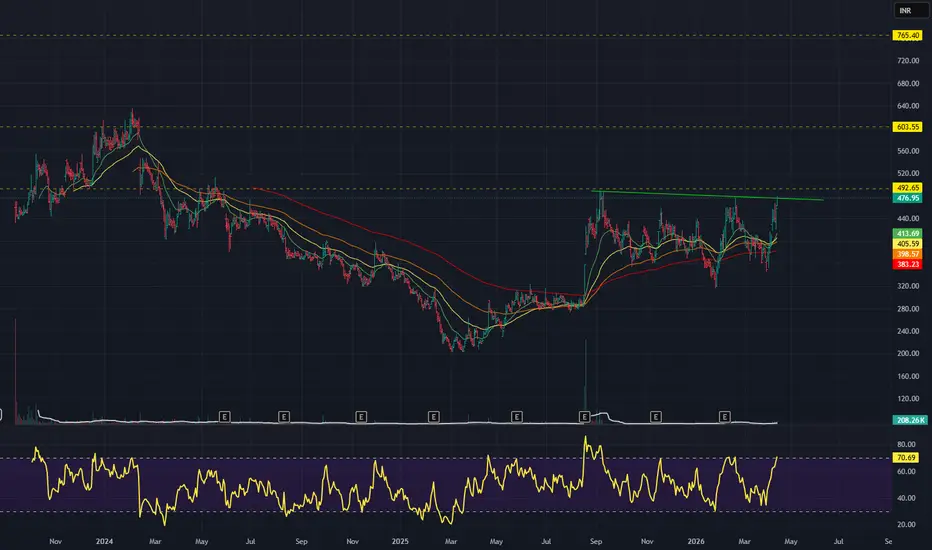
RISHABH INSTRUMENTS LTD – Breakout Retest Opportunity ..........📊 Technical Structure
Strong breakout from a long-term descending trendline followed by a sustained uptrend.
Previous resistance zone around ₹460–490 has now turned into a key support area.
Price is retesting the breakout zone after a sharp rally, offering a favorable risk-reward setup.
Both
Rishabh Instruments LtdRishabh Instruments Ltd shows strong profitability momentum, improving margins, and expanding global and clean‑energy opportunities, positioning it for sustained long‑term growth. The company’s recent financial results highlight operational discipline, strategic restructuring, and rising traction in
See all ideas
Summarizing what the indicators are suggesting.
Oscillators
Neutral
SellBuy
Strong sellStrong buy
Strong sellSellNeutralBuyStrong buy
Oscillators
Neutral
SellBuy
Strong sellStrong buy
Strong sellSellNeutralBuyStrong buy
Summary
Neutral
SellBuy
Strong sellStrong buy
Strong sellSellNeutralBuyStrong buy
Summary
Neutral
SellBuy
Strong sellStrong buy
Strong sellSellNeutralBuyStrong buy
Summary
Neutral
SellBuy
Strong sellStrong buy
Strong sellSellNeutralBuyStrong buy
Moving Averages
Neutral
SellBuy
Strong sellStrong buy
Strong sellSellNeutralBuyStrong buy
Moving Averages
Neutral
SellBuy
Strong sellStrong buy
Strong sellSellNeutralBuyStrong buy
Displays a symbol's price movements over previous years to identify recurring trends.
Frequently asked questions
The current price of RISHABH is 764.70 INR — it has decreased by −1.75% in the past 24 hours. Watch Rishabh Instruments Limited stock price performance more closely on the chart.
Depending on the exchange, the stock ticker may vary. For instance, on NSE exchange Rishabh Instruments Limited stocks are traded under the ticker RISHABH.
RISHABH stock has fallen by −6.49% compared to the previous week, the month change is a 14.84% rise, over the last year Rishabh Instruments Limited has showed a 80.06% increase.
RISHABH reached its all-time high on Sep 9, 2026 with the price of 852.00 INR, and its all-time low was 201.50 INR and was reached on Mar 4, 2025. View more price dynamics on RISHABH chart.
See other stocks reaching their highest and lowest prices.
RISHABH stock is 3.19% volatile and has beta coefficient of 1.82. Track Rishabh Instruments Limited stock price on the chart and check out the list of the most volatile stocks — is Rishabh Instruments Limited there?
Today Rishabh Instruments Limited has the market capitalization of 29.60 B, it has increased by 1.19% over the last week.
Yes, you can track Rishabh Instruments Limited financials in yearly and quarterly reports right on TradingView.
RISHABH net income for the last quarter is 190.26 M INR, while the quarter before that showed 197.03 M INR of net income which accounts for 0.00% change. Track more Rishabh Instruments Limited financial stats to get the full picture.
Yes, RISHABH dividends are paid annually. The last dividend per share was 2.00 INR. As of today, Dividend Yield (TTM)% is 0.26%. Tracking Rishabh Instruments Limited dividends might help you take more informed decisions.
Rishabh Instruments Limited dividend yield was 0.57% in 2025, and payout ratio reached 9.43%. The year before the numbers were 0.00% and 0.00% correspondingly. See high-dividend stocks and find more opportunities for your portfolio.
As of Sep 20, 2026, the company has 731 employees. See our rating of the largest employees — is Rishabh Instruments Limited on this list?
EBITDA measures a company's operating performance, its growth signifies an improvement in the efficiency of a company. Rishabh Instruments Limited EBITDA is 1.31 B INR, and current EBITDA margin is 16.22%. See more stats in Rishabh Instruments Limited financial statements.
Like other stocks, RISHABH shares are traded on stock exchanges, e.g. Nasdaq, Nyse, Euronext, and the easiest way to buy them is through an online stock broker. To do this, you need to open an account and follow a broker's procedures, then start trading. You can trade Rishabh Instruments Limited stock right from TradingView charts — choose your broker and connect to your account.
Investing in stocks requires a comprehensive research: you should carefully study all the available data, e.g. company's financials, related news, and its technical analysis. So Rishabh Instruments Limited technincal analysis shows the buy rating today, and its 1 week rating is buy. Since market conditions are prone to changes, it's worth looking a bit further into the future — according to the 1 month rating Rishabh Instruments Limited stock shows the strong buy signal. See more of Rishabh Instruments Limited technicals for a more comprehensive analysis.