
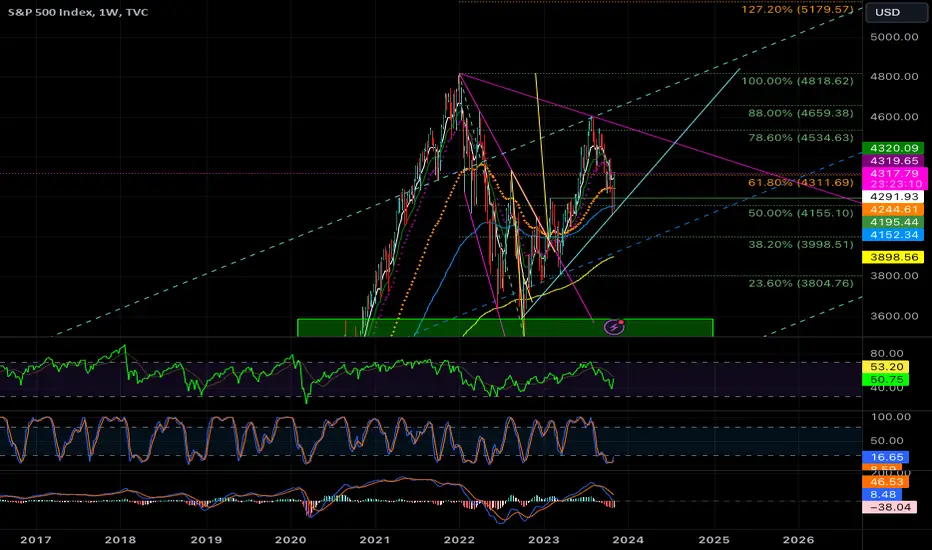
It has been just over one year since my last post on the S&P 500 (Oct 2022) and the index is up by around 19% since then. Not bad. (adding the link of my related post.) The weekly chart with the indicators and the pattern between the Fibonacci levels show that it's highly possible that the pattern will be completed and we'll be testing the all time high at 4818. This week's bar seems to be a bullish engulfing bar which is a reversal of the down trend. Although the future is unpredictable, there's a chance of 11% upside according to this construction. Let's see how it goes.

Publicaciones relacionadas
Exención de responsabilidad
La información y las publicaciones no constituyen, ni deben considerarse como, asesoramiento o recomendaciones financieras, de inversión, de trading u otro tipo, proporcionadas o respaldadas por TradingView. Obtenga más información en Condiciones de uso.
Publicaciones relacionadas
Exención de responsabilidad
La información y las publicaciones no constituyen, ni deben considerarse como, asesoramiento o recomendaciones financieras, de inversión, de trading u otro tipo, proporcionadas o respaldadas por TradingView. Obtenga más información en Condiciones de uso.