
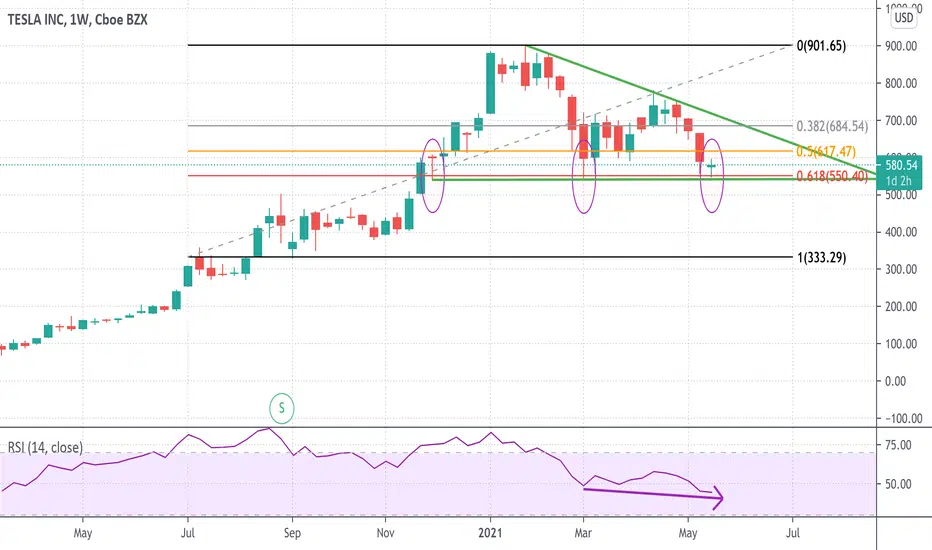
A weekly chart of TSLA will show us the longer term trend, which fate could be tested at the $550 level, which is coincidental with the 61.8% Fibonacci Retracement, a break below this level suggests the next target on the downside is $330 approximately.
There is a slight divergence with the RSI, when you take a look at the last bottom. (Bearish)
I will be keeping this on a close watch.
There is a slight divergence with the RSI, when you take a look at the last bottom. (Bearish)
I will be keeping this on a close watch.

Exención de responsabilidad
La información y las publicaciones no constituyen, ni deben considerarse como, asesoramiento o recomendaciones financieras, de inversión, de trading u otro tipo, proporcionadas o respaldadas por TradingView. Obtenga más información en Condiciones de uso.
Exención de responsabilidad
La información y las publicaciones no constituyen, ni deben considerarse como, asesoramiento o recomendaciones financieras, de inversión, de trading u otro tipo, proporcionadas o respaldadas por TradingView. Obtenga más información en Condiciones de uso.