
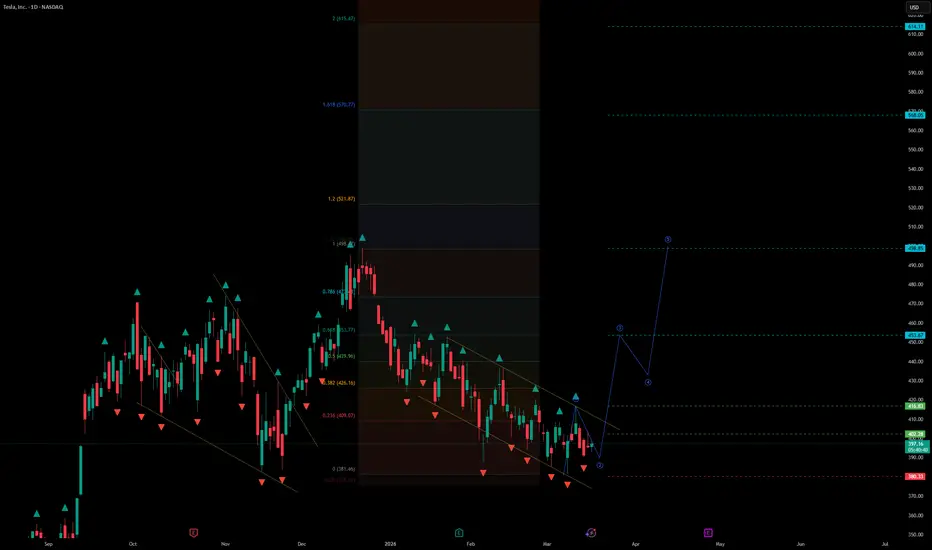
Tesla, Inc. (TSLA) — H4
Potential Wave 3 Formation + Trendline Break (Bullish Continuation)
🔎 Market Structure (H4)
On the H4 timeframe, TSLA is forming the technical conditions for a potential Wave 3 to the upside, confirmed by:
a breakout above the corrective trendline (structure shift)
completion of the pullback phase (Wave 2) after the prior decline
stabilization above the local base with early signs of momentum recovery
transition from corrective movement into potential impulsive continuation
This setup fits a classic Elliott Wave continuation model, where Wave 3 often accelerates after Wave 2 completes and price holds above the broken trendline.
📐 Elliott Wave Context
Wave 1: initial impulsive move up (trend initiation from the local base)
Wave 2: corrective retracement / consolidation within structure
Wave 3: expected impulsive expansion higher (current scenario)
📌 Key principle:
The bullish scenario remains valid as long as price holds above the low of Wave 1.
📍 Entry
Entry: 416.83
*Alternative entry (scale-in): 402.28
The entry is positioned:
above the broken trendline (breakout confirmation zone)
inside the impulse activation area after correction completion
with a secondary add-on level near structural support for risk-controlled scaling
🎯 Target Levels (Wave 3 Projections)
Targets are derived from projected impulse expansion zones and key reaction levels:
TP1: 453.67
TP2: 498.85
TP3: 568.05
TP4: 614.11
Each target represents a potential reaction zone and a logical level for partial profit-taking during Wave 3 development.
🛑 Invalidation / Stop Loss
Stop Loss: 380.33
📍 The stop is placed below the low of Wave 1, which:
invalidates the Wave 3 bullish scenario if breached
signals a deeper correction / structure failure
protects against a failed breakout and trend reversal
🧠 Risk & Trade Management
Trend-following setup
Wave 3 can accelerate quickly once momentum expands.
Recommended approach:
partial profits at TP1 / TP2
move stop to breakeven after strong follow-through confirms the impulse
keep risk reduced until price holds above the broken trendline on multiple H4 closes
scaling is preferable only on pullbacks that respect the breakout zone / support
📌 Summary
TSLA on H4 shows a corrective trendline breakout and structural conditions for a potential Wave 3 continuation to the upside.
The bullish scenario remains valid above 380.33, with upside targets at 453.67 → 498.85 → 568.05 → 614.11.
Potential Wave 3 Formation + Trendline Break (Bullish Continuation)
🔎 Market Structure (H4)
On the H4 timeframe, TSLA is forming the technical conditions for a potential Wave 3 to the upside, confirmed by:
a breakout above the corrective trendline (structure shift)
completion of the pullback phase (Wave 2) after the prior decline
stabilization above the local base with early signs of momentum recovery
transition from corrective movement into potential impulsive continuation
This setup fits a classic Elliott Wave continuation model, where Wave 3 often accelerates after Wave 2 completes and price holds above the broken trendline.
📐 Elliott Wave Context
Wave 1: initial impulsive move up (trend initiation from the local base)
Wave 2: corrective retracement / consolidation within structure
Wave 3: expected impulsive expansion higher (current scenario)
📌 Key principle:
The bullish scenario remains valid as long as price holds above the low of Wave 1.
📍 Entry
Entry: 416.83
*Alternative entry (scale-in): 402.28
The entry is positioned:
above the broken trendline (breakout confirmation zone)
inside the impulse activation area after correction completion
with a secondary add-on level near structural support for risk-controlled scaling
🎯 Target Levels (Wave 3 Projections)
Targets are derived from projected impulse expansion zones and key reaction levels:
TP1: 453.67
TP2: 498.85
TP3: 568.05
TP4: 614.11
Each target represents a potential reaction zone and a logical level for partial profit-taking during Wave 3 development.
🛑 Invalidation / Stop Loss
Stop Loss: 380.33
📍 The stop is placed below the low of Wave 1, which:
invalidates the Wave 3 bullish scenario if breached
signals a deeper correction / structure failure
protects against a failed breakout and trend reversal
🧠 Risk & Trade Management
Trend-following setup
Wave 3 can accelerate quickly once momentum expands.
Recommended approach:
partial profits at TP1 / TP2
move stop to breakeven after strong follow-through confirms the impulse
keep risk reduced until price holds above the broken trendline on multiple H4 closes
scaling is preferable only on pullbacks that respect the breakout zone / support
📌 Summary
TSLA on H4 shows a corrective trendline breakout and structural conditions for a potential Wave 3 continuation to the upside.
The bullish scenario remains valid above 380.33, with upside targets at 453.67 → 498.85 → 568.05 → 614.11.

Exención de responsabilidad
La información y las publicaciones no constituyen, ni deben considerarse como, asesoramiento o recomendaciones financieras, de inversión, de trading u otro tipo, proporcionadas o respaldadas por TradingView. Obtenga más información en Condiciones de uso.
Exención de responsabilidad
La información y las publicaciones no constituyen, ni deben considerarse como, asesoramiento o recomendaciones financieras, de inversión, de trading u otro tipo, proporcionadas o respaldadas por TradingView. Obtenga más información en Condiciones de uso.