
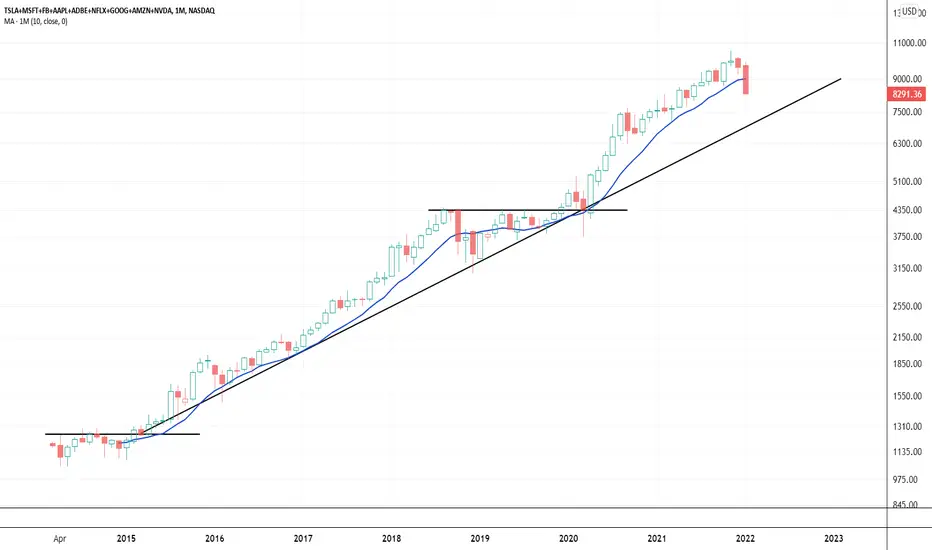
This is a monthly candle chart of the FANG complex. The last time the group had a monthly close below it's 10 Month moving average it traded back down towards its trend line. The stocks traded down for about 5 months and consolidated for another 8 months, when looking at them as a group. If you have a 401K, IRA, and 529 plans consider how much exposure you have to this mix. The complex could fall quite a bit and not break the long term up trend. Considering the month isn't over quite yet this chart is premature. I figured it was an interesting look none the less.
Thoughts, feelings, ideas?
Here's the link to the watch list:
tradingview.com/watchlists/62522214/
Thoughts, feelings, ideas?
Here's the link to the watch list:
tradingview.com/watchlists/62522214/

Exención de responsabilidad
La información y las publicaciones no constituyen, ni deben considerarse como, asesoramiento o recomendaciones financieras, de inversión, de trading u otro tipo, proporcionadas o respaldadas por TradingView. Obtenga más información en Condiciones de uso.
Exención de responsabilidad
La información y las publicaciones no constituyen, ni deben considerarse como, asesoramiento o recomendaciones financieras, de inversión, de trading u otro tipo, proporcionadas o respaldadas por TradingView. Obtenga más información en Condiciones de uso.