Weekly Chart

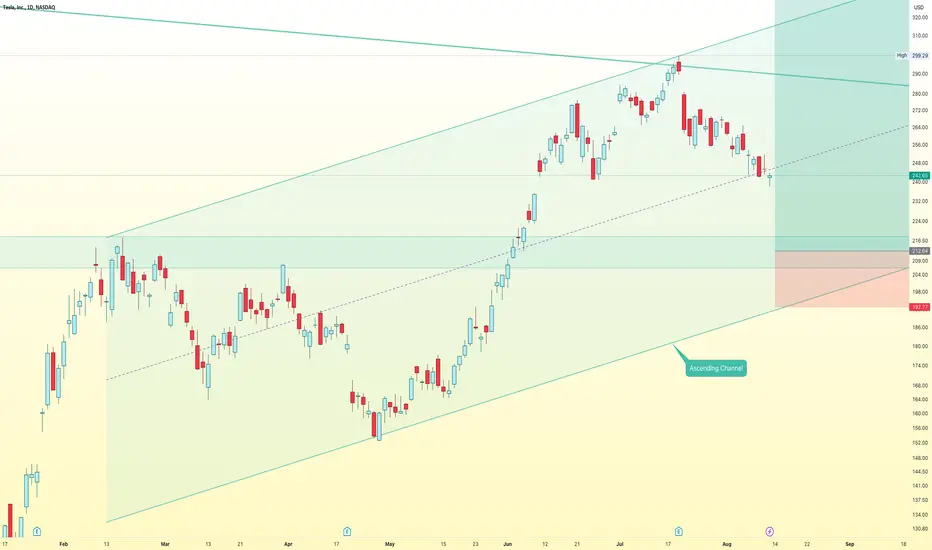
On this chart, Tesla TSLA is still below the resistance and going down to support around $212
Daily Chart
Tesla has a key level around $212 and it's also in ascending channel so I expect price will bounce back when touch this level
Wait for next move around there
On this chart, Tesla
TSLA is still below the resistance and going down to support around $212Daily Chart
Tesla has a key level around $212 and it's also in ascending channel so I expect price will bounce back when touch this level
Wait for next move around there
Nota
Bounce back

📱Copy Trade on Binance: bit.ly/3NHOTKQ
🔐 Buy Cold Wallet Ledger bit.ly/3OmOrBe
🔐 Buy Cold Wallet Ledger bit.ly/3OmOrBe
Publicaciones relacionadas
Exención de responsabilidad
La información y las publicaciones no constituyen, ni deben considerarse como, asesoramiento o recomendaciones financieras, de inversión, de trading u otro tipo, proporcionadas o respaldadas por TradingView. Obtenga más información en Condiciones de uso.
📱Copy Trade on Binance: bit.ly/3NHOTKQ
🔐 Buy Cold Wallet Ledger bit.ly/3OmOrBe
🔐 Buy Cold Wallet Ledger bit.ly/3OmOrBe
Publicaciones relacionadas
Exención de responsabilidad
La información y las publicaciones no constituyen, ni deben considerarse como, asesoramiento o recomendaciones financieras, de inversión, de trading u otro tipo, proporcionadas o respaldadas por TradingView. Obtenga más información en Condiciones de uso.