ETHUSDT - The Battle for a Key Support Zone BINANCE:ETHUSDT.P is showing local bullish momentum and appears stronger than Bitcoin in the current market environment. Price action is focused on the 1800–1850 zone, where buyers and sellers are competing for control
Bitcoin remains in consolidation between 61,000 and 65,000, while the broader market trend is still bearish. The lack of both fundamental and technical support continues to weigh on the crypto market as a whole.
From a technical perspective, Ethereum has broken above resistance, confirming a short-term bullish structure. During the ongoing correction, price is respecting the local trendline while testing the 1808–1848 area of interest
Resistance levels: 1848, 1946, 1966
Support levels: 1833, 1807, 1774
The key trigger remains 1848. If bulls can establish sustained consolidation above this level, it could become the technical catalyst for a move toward 1945–1966
Best regards,
R. Linda  Long
Long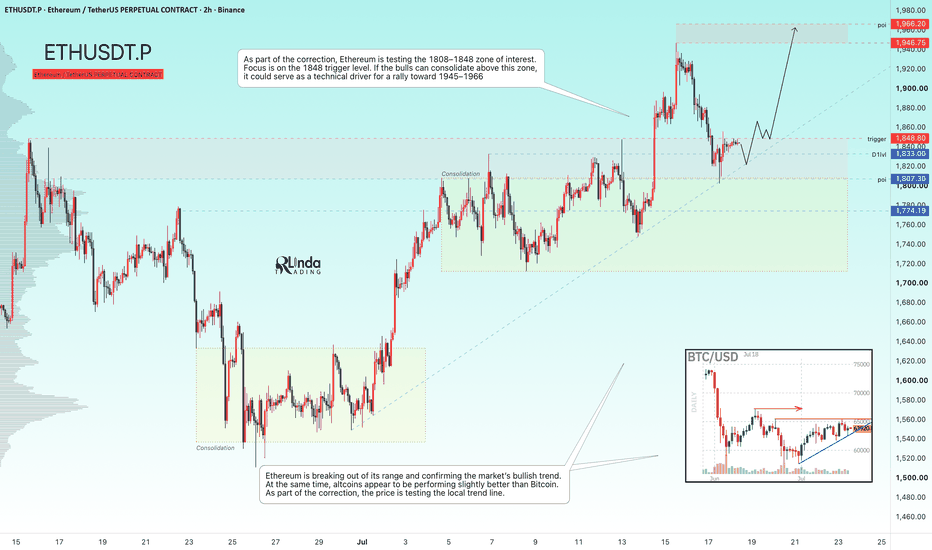
Bitcoin Battles $65K Resistance — Is Another Correction Next?Over the past few hours, Bitcoin ( BINANCE:BTCUSDT ) has experienced highly volatile price action, with strong momentum in both bullish and bearish moves. One of the main reasons could be the reopening of the financial markets, along with the latest news surrounding geopolitical tensions in the Middle East and recent statements from political leaders.
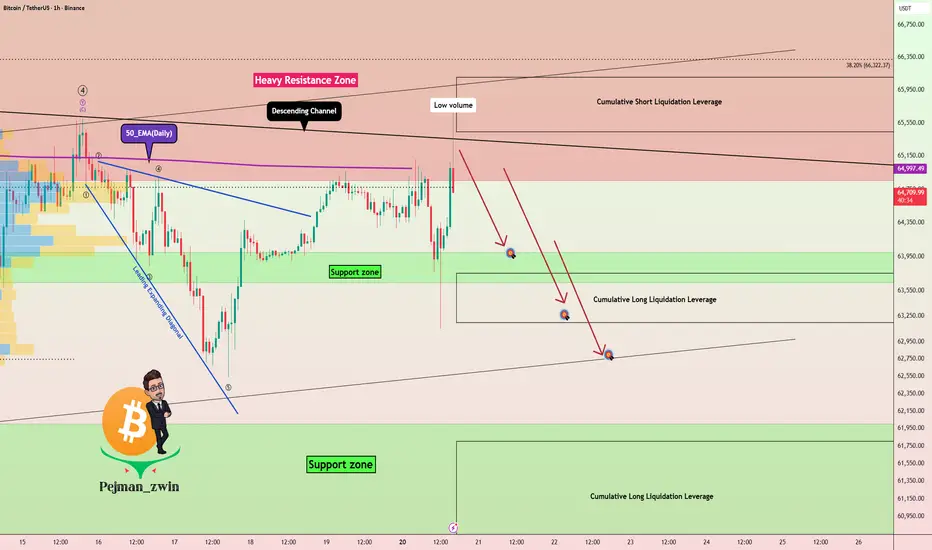
Bitcoin is once again trading near the 50_EMA (Daily), the upper trendline of the Descending Channel, the Cumulative Short Liquidation Leverage($66,100-$65,440), and has re-entered the heavy resistance zone ($76,600-$64,850).
From an Elliott Wave perspective, it appears that Bitcoin is still completing its main wave 4, which suggests that another corrective move could still be ahead.
Since Bitcoin has shown a strong correlation with the S&P 500 index ( CAPITALCOM:SPX500 ), and there is a possibility that the index may move lower in the coming hours, this could have a direct impact on Bitcoin and lead to further downside.
I expect Bitcoin to resume its bearish move and decline at least toward the support zone($64,000-$63,640) and the Cumulative Long Liquidation Leverage($63,750-$63,170). If bearish momentum increases, we could even see a move toward the key trading level of $62,523.
First Target: $64,123
Second Target: Cumulative Long Liquidation Leverage($63,750-$63,170)
Third Target: $62,523
Stop Loss(SL): $66,300
Cumulative Short Liquidation Leverage: $68,650-$67,500
Cumulative Long Liquidation Leverage: $61,800-$60,560
Cumulative Long Liquidation Leverage: $58,300-$57,700
Note: Since global markets are currently sensitive to the Middle East tensions, it's important to monitor geopolitical developments and be even more disciplined with risk management.
What’s your view on Bitcoin? Do you think Bitcoin can finally reclaim $65,000, or should we prepare for another correction?
💡 Please respect each other's opinions and express agreement or disagreement politely.
📌Bitcoin Analysis (BTCUSDT), 1-hour time frame.
🛑 Always set a Stop Loss(SL) for every position you open.
✅ This is just my idea; I’d love to see your thoughts too!
🔥If you find it helpful, please BOOST this post and share it with your friends.  Short
Short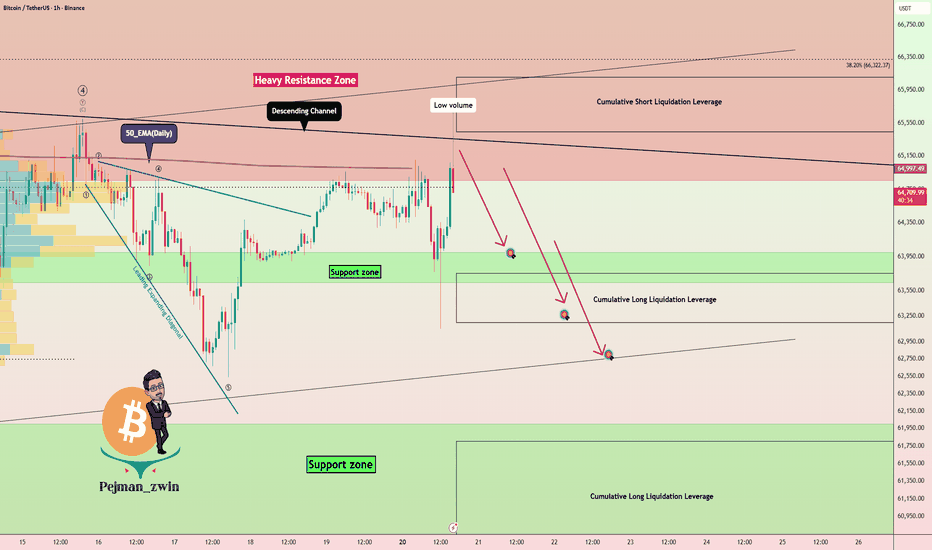
AUDNZD - Bullish Momentum Faces a Critical Test!AUDNZD remains bullish from a broader perspective, but recent price action suggests that bullish momentum is beginning to weaken after the break below the red ascending channel.
Following the rejection from the red supply area, price moved lower and is now testing the lower boundary of the blue channel, where it aligns with an important support area. This creates a technical zone that may attract buyers and is worth monitoring closely.
⭕As long as this support continues to hold, we can start looking for buy setups on lower timeframes, anticipating a bullish reaction from the current area.
⭕However, if price breaks below the lower boundary of the blue channel and the green trigger area, it would provide an important indication that momentum is shifting from bullish to bearish on the daily timeframe, increasing the probability of a deeper correction toward the lower boundary of the broader brown ascending channel.
The reaction around this support may help determine whether buyers can defend the daily bullish structure, or if sellers are beginning to take control, leading to a broader correction within the long-term bullish trend.
⚠️ Disclaimer: This analysis reflects my personal market view and is not financial advice.
Rayan Nasser
#AUDNZD #AUD #NZD #Forex #TechnicalAnalysis #PriceAction #Trading #MarketStructure U.S. Dollar / Japanese Yen ($USDJPY) Daily: Classical Elliott U.S. Dollar / Japanese Yen ( FX:USDJPY ) Daily: Classical Elliott Wave Matrix – Mapping Wave (4) Correction Toward 158.000 Channel Floor
### 🇺🇸🇯🇵 U.S. Dollar / Japanese Yen ( FX:USDJPY ) Daily Macro Technical Study (Ref: USDJPY_2026-07-09_08-44-48.png)
We are deploying a comprehensive structural and behavioral forecast for the USDJPY currency pair on the Daily (1D) interval. The asset continues to trend within a pristine, high-timeframe ascending channel framework, adhering strictly to classical Elliott Wave structural impulses.
The pair shows minor intraday distribution signatures today, trading down **-0.18% at 162.346**, signaling a local momentum shift near multi-month structural extremes.
---
### 🔍 Elliott Wave Anatomy & Channel Geometry:
Our active systematic model breaks down the current macro sequence across two major technical dimensions:
1. **Wave (3) Apex & Rejection at the 164.000 Ceiling:** The strong, volume-backed impulse sequence has formally completed its **Wave (3)** extension right at the upper red diagonal boundary of the ascending channel. The localized double-top structure and distinct upper wicks printed near the **163.000 – 164.000** supply block confirm heavy institutional profit-taking.
2. **The Wave (4) Correction Path (Target 158.000):** As modeled by our blue tracking vector, price action is entering a necessary corrective phase. We anticipate a controlled mean-reversion decline targeting the **158.000 psychological baseline**. This zone acts as a massive confluence floor, overlapping the primary **ascending channel support line** and sitting just ahead of the macro institutional **200-period EMA (purple line at 156.975)**.
* *Note:* The rising **72-period SMA ribbon (orange line at 159.701)** will act as the first intermediate dynamic cushion during this distribution.
---
### 🚀 Future Outlook: The Wave (5) Impulse Launch
Once the market successfully completes the Wave (4) mitigation phase inside the **158.000 – 159.000** demand cluster, aggregate order flow is mathematically positioned to trigger the final cyclical impulse—**Wave (5)**. This secondary expansion leg will target a definitive breakout above local peaks, driving price action back toward the premium channel limits above **164.000**.
### 📊 Tactical Framework Summary:
* **Immediate Bias:** Bearish Corrective (Wave 4 Development)
* **Core Downside Target:** 158.000 (Channel Floor & Dynamic Confluence)
* **Macro Swing Bias:** Heavily Bullish (Awaiting Wave 5 Accumulation Signatures)
---
📊 **ChartPro Data**
*FX Structural Architecture, Elliott Wave Sourcing & Trend Geometry Matrices.*
⚠️ **Disclaimer:** For educational and informational purposes only. This market study represents a personal trading framework and does not constitute financial or investment advice. HYPEUSDT - Consolidation Before Further Growth BINANCE:HYPEUSDT.P is consolidating within both its local and global bullish trends. Technically, this phase appears to be a period of accumulation before a potential continuation of the uptrend
Bitcoin is currently caught between three major forces: the Fed's softer rhetoric, a reversal in ETF flows, and renewed geopolitical tensions in the Middle East. While Bitcoin remains in a countertrend correction within its broader bearish trend, HYPE continues to show relative strength. The market is forming two key trigger levels around the boundaries of the current trading range: 72.09 and 68.30
Resistance levels: 72.09, 77.00
Support levels: 68.30, 65.60
Technically, two scenarios remain in focus before the next bullish leg. The first is a retest of resistance followed by a breakout, where consolidation and a close above 72.09 could trigger further upside. Alternatively, the market may first perform a long squeeze below the 68.30 support level before resuming its upward trend
Best regards,
R. Linda  Long
Long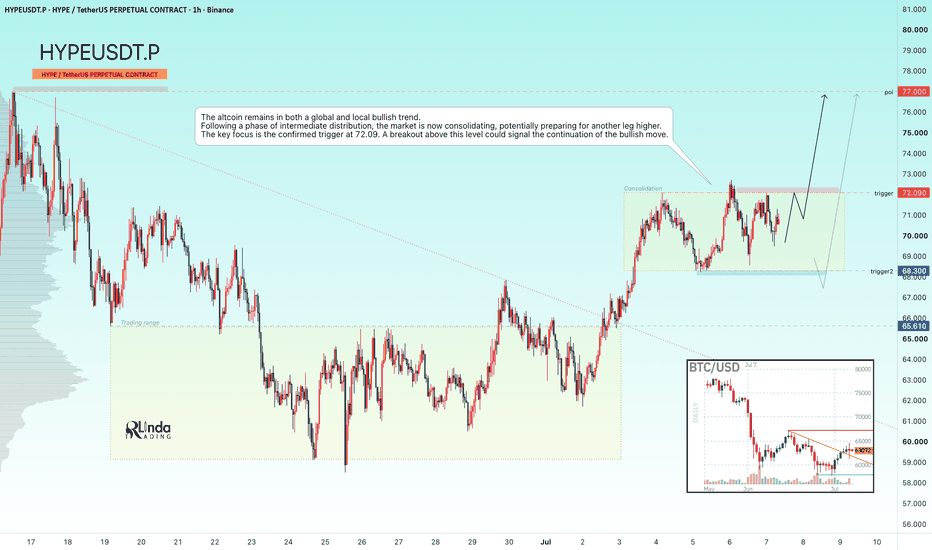
GOLD - A pullback before a potential rise to 4220 Following the breakout above the 4100 consolidation range and the recent rally, ICMARKETS:XAUUSD has entered a corrective phase. The geopolitical and fundamental backdrop remains unstable
Gold staged a strong recovery after weaker-than-expected U.S. employment data shifted Fed expectations from hawkish to more neutral. The probability of a September rate hike has fallen from 66% to around 53–55%, while the U.S. dollar has stalled and Treasury yields have declined, creating favorable conditions for a rebound after gold's sharpest quarterly drop in years.
However, with the start of the new trading week, gold has temporarily lost momentum due to renewed geopolitical developments. Market attention is now focused on headlines from the Middle East and the return of liquidity following the U.S. holiday weekend.
Key drivers:
Bearish for gold: stronger U.S. dollar, renewed geopolitical risks, profit-taking after the recent rally.
Bullish for gold: weaker U.S. dollar, progress in geopolitical negotiations, and the return of market liquidity after the U.S. holidays
Resistance levels: 4198, 4220
Support levels: 4144, 4121, 4095
Technically, market makers may target a retest of the 4198–4220 liquidity zone and the recent swing high. However, both the Asian and European sessions are currently favoring a corrective move and a liquidity hunt before another potential rally. A long squeeze into the 4144–4121 support zone could trigger another bullish impulse.
However, keep in mind that both the local and the broader market trends remain bearish.
Best regards,
R. Linda  Long
Long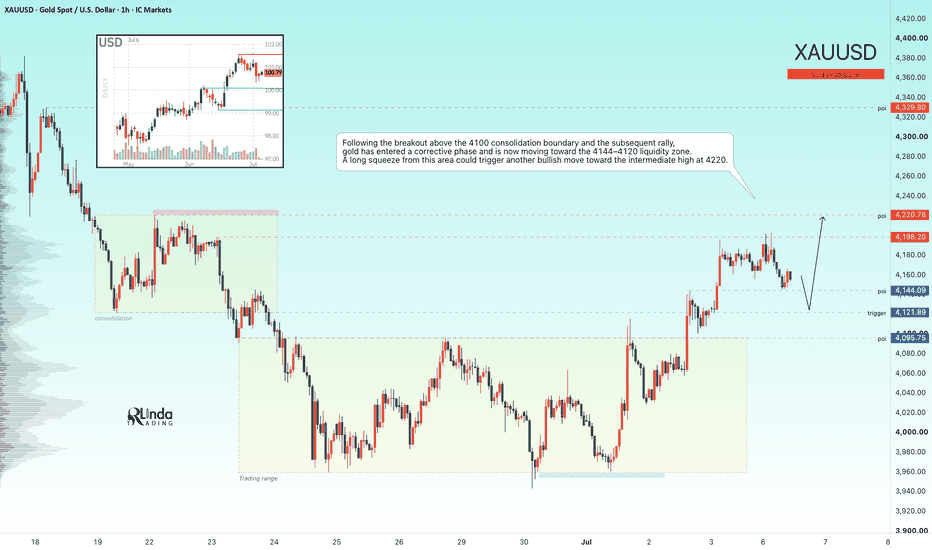
EURJPY - A Breakthrough of Resistance to Continue the Uptrend FX:EURJPY is testing the 184.84 support level after breaking above a key resistance. The broader trend remains bullish, providing overall support for further upside
EURJPY is currently influenced by three major factors: a widening interest rate differential in favor of the euro, persistent bearish positioning on the Japanese yen as large speculators continue to increase short exposure, and growing risks of a Japanese currency intervention amid the yen's weakest levels in decades. Despite these factors, the technical structure remains favorable for further gains.
The chart is forming a classic breakout pattern, with price holding above the former resistance level
Resistance levels: 185.37, 186.32
Support levels: 184.84, 184.57
Following a pullback from 185.37, the pair is testing the 184.84 support and liquidity zone. Within the broader bullish trend, if bulls manage to defend this trigger level, it could pave the way for another leg higher
Best regards,
R. Linda GBPCAD - Resistance Zone Under Pressure !GBPCAD remains overall bullish, continuing to respect the red ascending channel that has been guiding the broader trend.
After rejecting the lower boundary of the channel and the support area, price managed to recover and is now approaching a strong resistance zone that has generated multiple rejections recently, making this an interesting area to monitor.
From here, we can start looking for sell setups on lower timeframes, especially if price shows signs of rejection from the current resistance area.
📌If resistance continues to hold, we may see a move lower toward the lower boundary of the channel, or even the blue support area, which could become the next downside target if bearish momentum continues.
📌However, if price breaks above the current resistance area, the focus shifts toward the next resistance zone, where price may face another potential rejection.
The reaction here may reveal whether the market is preparing for a pullback, or if buyers still have enough momentum to continue pushing higher.
⚠️ Disclaimer: This analysis reflects my personal market view and is not financial advice.
Rayan Nasser
#GBPCAD #GBP #CAD #Forex #TechnicalAnalysis #PriceAction #Trading #MarketStructure
Euro Stoxx 50 ($SX5E) Daily: Bullish Channel Extension EyesEuro Stoxx 50 ( TVC:SX5E ) Daily: Bullish Channel Extension Eyes 6,332 Target Ahead of Overextended Mean-Reversion Alert
### 🇪🇺 Euro Stoxx 50 Index ( TVC:SX5E ) Daily Macro Framework (Ref: SX5E_2026-06-25_09-05-04.png)
We are deploying a macro-structural trend analysis on the Euro Stoxx 50 Index ( TVC:SX5E - TVC) on the Daily (1D) timeframe. While the primary aggregate European equity order flow remains aggressively bullish, our quantitative matrix flashes a vital tactical alert regarding short-term price overextension relative to long-term institutional moving averages.
The benchmark index is currently trading up at **6,252.70 (+0.61%)**, advancing inside a highly defined geometric ascending corridor.
---
### 🔍 Trend Geometry & Immediate Upside Target:
1. **The Ascending Channel:** The index continues to firmly validate its primary bullish structures, cleanly bracketed by the upper and lower diagonal red parallel trendlines. Momentum remains strongly skewed to the upside.
2. **The Near-Term Ceiling:** The immediate path of least resistance points toward a continuation sweep to test the absolute upper boundary of the channel. This retest perfectly aligns with the heavy historical horizontal supply barrier locked at **6,332.50** (thick horizontal red line).
---
### ⚠️ Technical Overextension & Mean-Reversion Risk:
Despite the clear bullish velocity, professional risk management requires analyzing the vertical space separating current spot prices from the underlying institutional baselines. The short-term extension has grown highly stretched compared to the following defensive clusters:
* **The Intermediary Filter:** The 72-period SMA (orange line sitting down at **5,928.11**).
* **The Long-Term Baseline:** The core institutional 200-period EMA (purple line sitting at **5,815.49**).
### 🎯 Proportional Pullback Projections:
Once the price achieves its immediate target at the top of the channel or near the **6,332.50** ceiling, we anticipate a healthy technical cooling phase to initiate a substantial mean-reversion rotation:
* **Correction Target 1 (Structural Re-test):** An initial healthy down-leg of **-2.43% (-152.36 points)** to seek liquidity at the lower ascending support line of the active channel.
* **Correction Target 2 (Institutional Demand Node):** If broader profit-taking materializes, a macro correction extending down to **-6.50% (-406.95 points)** will push the index into our primary demand cluster (highlighted by the yellow circle). This zone marks the key structural rebalancing node where the 72 SMA and 200 EMA converge.
### Tactical Playbook:
The market remains a strong 'buy-the-dip' structure on a macro level, but chasing fresh long positions directly into the upper parameters of the channel carries poor structural risk/reward parameters. We favor securing profits on near-term longs as the index approaches **6,332**, patiently waiting for a technical rotation toward the lower support geometries before re-engaging with high-asymmetry long exposure.
---
📊 **ChartPro Data**
*European Blue-Chip Architecture, Mean-Reversion Matrices & Systematic Risk Mitigation.*
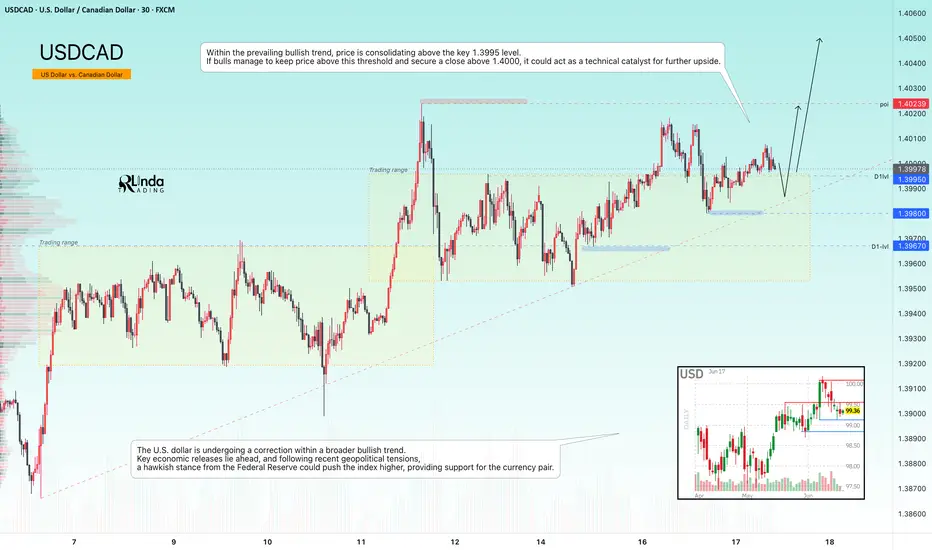
⚠️ **Disclaimer:** For educational and informational purposes only. This technical study represents a personal trading framework and does not constitute financial or investment advice. USDCAD - Retest of 1.40. Markets are awaiting the Fed's decisionFX:USDCAD maintains a strong bullish trend and is testing the 1.4000 resistance level while attempting to hold above this key threshold. The Federal Reserve meeting is now in focus
USDCAD has entered a consolidation phase ahead of major news events, with the primary focus on the Fed's interest rate decision and comments from the new Fed Chair
The U.S. dollar is currently correcting within a broader bullish trend. With key economic releases approaching and geopolitical tensions still in the background, a hawkish stance from the Federal Reserve could push the Dollar Index higher, providing additional support for the currency pair.
Resistance levels: 1.4000, 1.4024, 1.4100
Support levels: 1.3995, 1.3980, 1.3967
Within the prevailing bullish trend, price is consolidating above the key 1.3995 level. If bulls manage to defend this area and secure a close above 1.4000, it could become a technical catalyst for further upside
Best regards,
R. Linda GOLD - Consolidation before growth. Positive background?ICMARKETS:XAUUSD is holding above $4,300 on Tuesday after pulling back from the six-day high of $4,369 reached during the previous U.S. trading session. The three-day rally has given way to consolidation, leaving room for further gains
Gold is currently in a phase of strong technical recovery, driven by a combination of geopolitical optimism and a reassessment of inflation risks. The market is entering the upcoming Federal Reserve meeting in a much more balanced position than it was immediately after the jobs report.
The market is awaiting two key events: the June 16–17 Federal Reserve meeting (including the updated dot plot and Chair Warsh’s press conference) and the official signing ceremony of the peace agreement in Geneva on June 19.
If the Fed’s dot plot proves less hawkish than the market expects and Friday’s signing ceremony confirms progress, gold could test 4426–4476 and continue higher. However, if Warsh confirms a high probability of further rate hikes in the second half of the year and the details of the agreement disappoint, gold may enter a corrective phase
Resistance levels: 4363, 4426, 4476
Support levels: 4306, 4268, 4246
A false breakout of 4363 is triggering a correction (the reaction remains weak), while gold continues to consolidate above the key support zone at 4300–4310. Fundamentally, the local backdrop is improving and providing support to the market. A rebound from the 4300 area could lead to a move toward 4426–4476
Best regards,
R. Linda Long 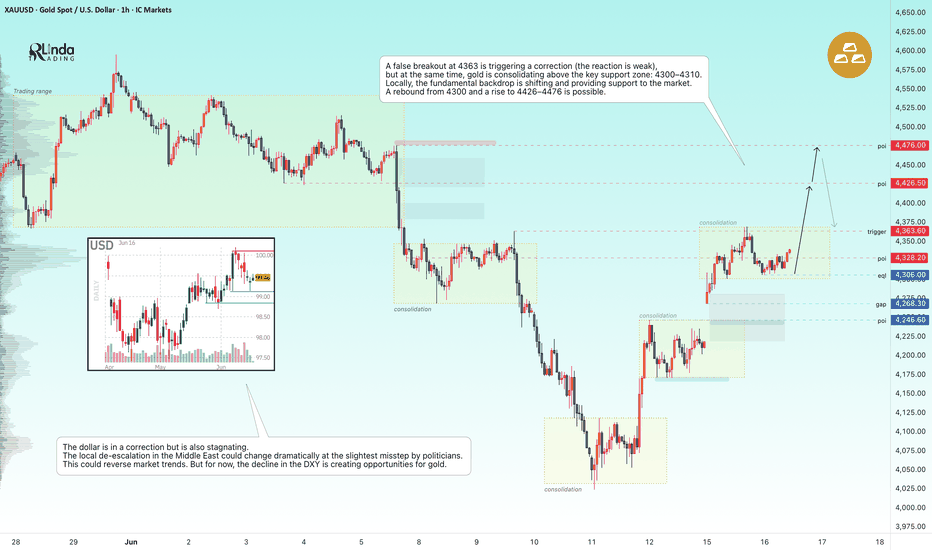
HYPEUSDT - Ready for the trend to continue BINANCE:HYPEUSDT.P continues to maintain its overall bullish trend and appears poised to resume its upward movement following the recent correction. Despite weakness in Bitcoin, the altcoin remains resilient and has a strong chance of retesting its all-time high.
After a period of consolidation during the corrective phase, the market is transitioning back into a rally phase and looks poised to continue higher. The coin continues to demonstrate notable relative strength, and in the medium term, it may challenge its all-time high. The broader weakness across the cryptocurrency market has had limited impact on HYPE, aside from the wave of negative news in early June that triggered panic and capital outflows.
The fundamental outlook for HYPE continues to improve, giving traders an opportunity to target the 70.0–75.0 range.
Resistance levels: 65.80, 70.0, 72.4
Support levels: 64.0, 62.40
Technically, the price remains in a bullish cycle. The key trigger is 65.800—a close above this level could open the door for the rally to continue.
Best regards, R. Linda Long 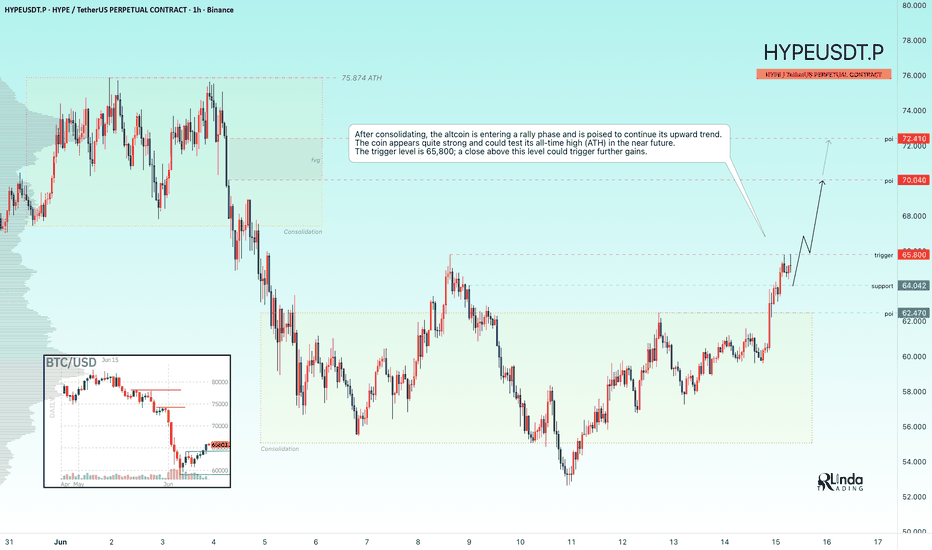
 Long
Long
 Long
Long
$ETH — 24 hours later, the thesis is building, not breaking.Yesterday's call: three pillars in agreement at the channel breakdown. Today's tape: every one of them is still speaking.
Wyckoff. Daily close held above Monthly Support ($1,963.56) and the Daily OB ($1,940–$1,985). The spring below the channel rail is a confirmed reaction now, not a wick. No fresh downside follow-through on the close is the schematic's first sign of strength.
Elliott. The expanding ending diagonal terminated where it was supposed to. Price reclaimed inside the lower channel zone and is coiling beneath the $2,061 POC — the magnet I flagged yesterday. Wave 5 didn't extend. It reversed.
Order Flow. Spot CVD curling up — real buyers showing for the first time since the breakdown. Margin CVD still bleeding as late shorts unwind. OI flushed sharply off the highs — late shorts forced out, not adding. Funding compressing back toward neutral after dipping negative. The crowded-short fuel is partially burnt off.
CAP gate check at this inflection:
— Session: active (Asia → London overlap)
— BOS: pending (need clean 1H close above $2,061)
— OTE: $1,985–$2,005 for re-entry on the pullback
— Sweep: yesterday's wick to $1,973 already collected the stops below
— CHoCH: triggers on a reclaim and hold of $2,061
Four of five gates present or developing. CHoCH is the only thing standing between this being a setup and this being a trigger.
Levels that matter:
— Reclaim & hold $2,061 POC → opens $2,090, then $2,180 (start of Wave 5 / 0.382 fib)
— Reject $2,061 and lose $1,963 → invalidates the reaction, reactivates the bearish case toward $1,830
— Coil between → still constructive. The longer it bases here, the deeper the floor.
The noise hasn't returned. The signal is still clean.
CAP · Continuation Acceleration Protocol
Three pillars. One conviction. Five gates. Long 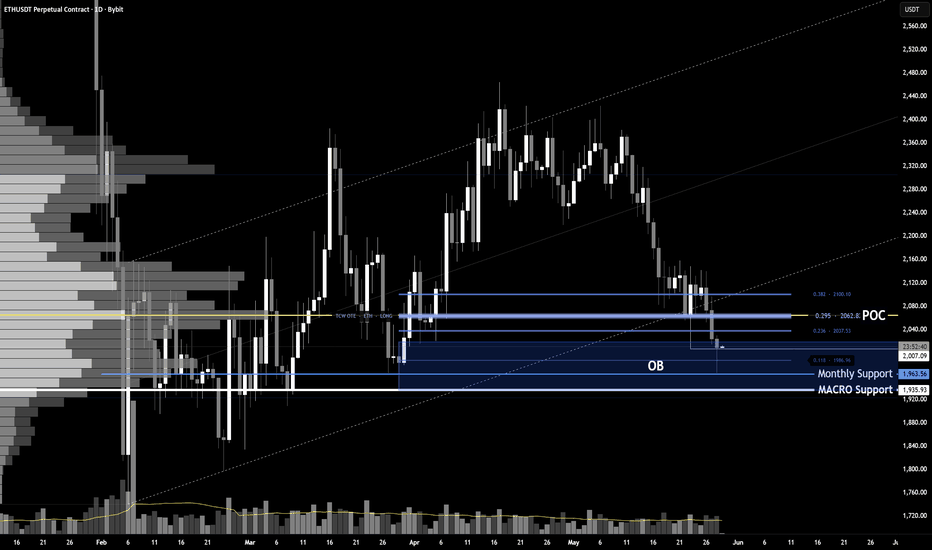

 Long
Long